
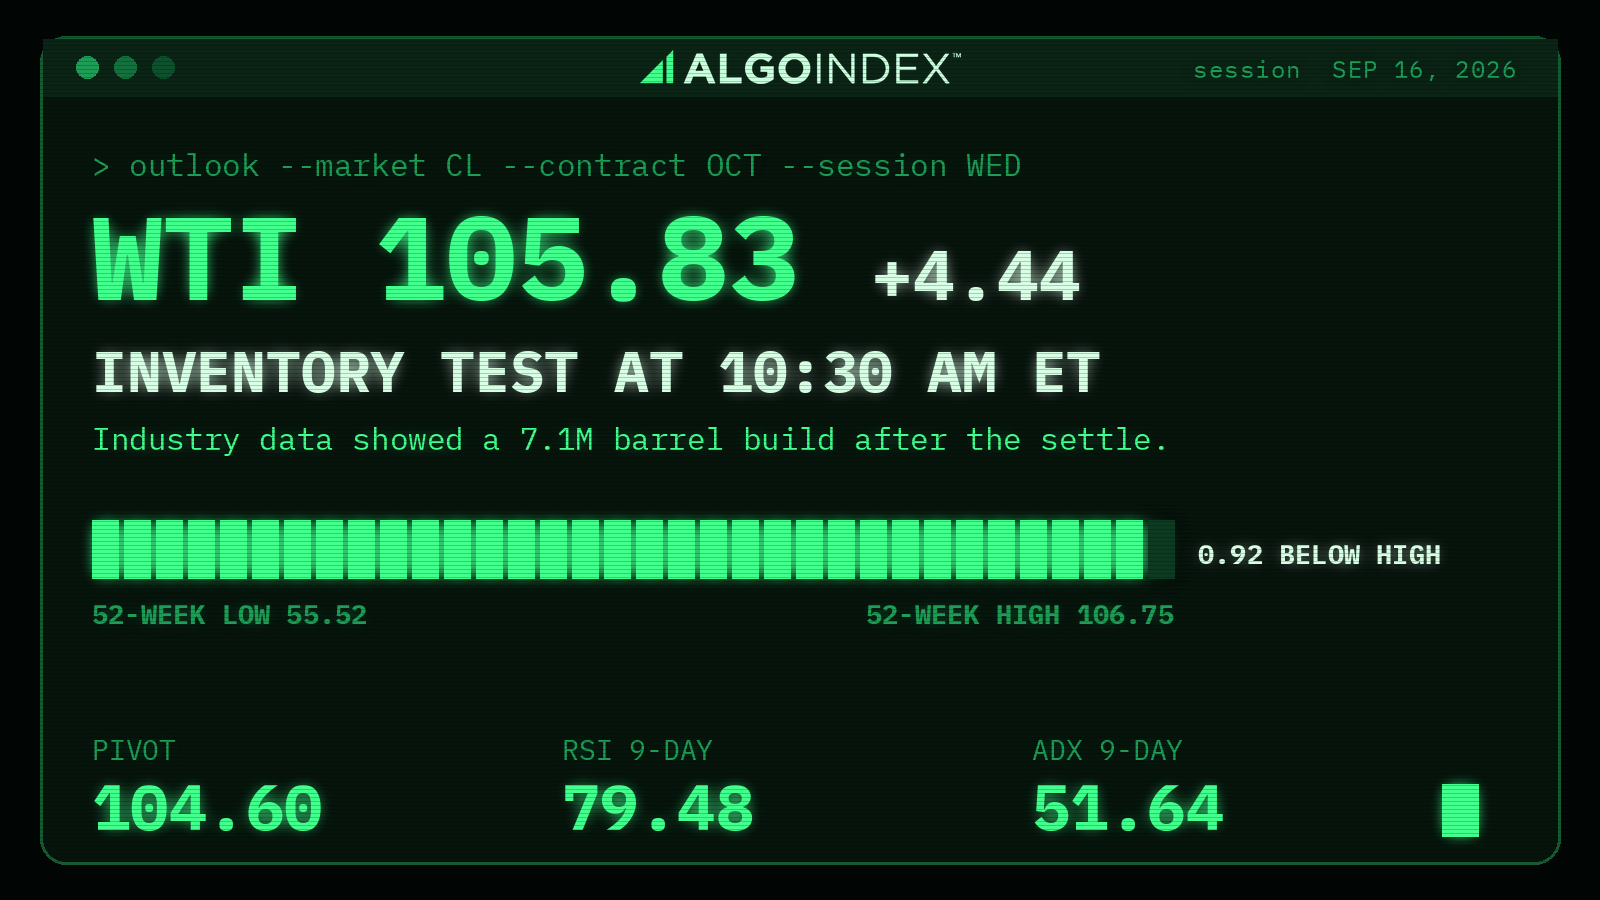
Our Tuesday outlook sold crude from 102.90 to 103.30 and named a settlement above 104.46 as the end of the idea. October WTI settled at 105.83, up 4.44 dollars or 4.38 percent. The trade was wrong, and the market said so clearly. Tuesday's session ran from 101.21 to 106.75, and that high is also the published 52-week, 13-week and one-month high, so crude printed a new annual peak and held almost all of it into the settle.
The supply news explains the force of the move. Two regional officials told the Associated Press a damaged Saudi pipeline could need three to five weeks of repairs, and it may run only partially in the meantime. US Energy Secretary Chris Wright told CNBC he expects the outage to be measured in days. Brent settled at 108.75 dollars, up 2.9 percent, and diesel settled at a record 5.2620 dollars a gallon. Then, after the settle, industry data showed a 7.14 million barrel crude build against an expected 1.8 million barrel draw. The contract gave back 91 cents in evening trade. The government's inventory report at 10:30 AM ET Wednesday now decides which of those two stories carries the session.
Update, September 16, 2026, 2:37 AM ET: This article now includes the US Energy Secretary's estimate that the Saudi pipeline outage will be measured in days, alongside the three-to-five-week estimate from regional officials, and its numeric reference no longer describes the outage as a multi-week fact.
October WTI crude futures settled at 105.83, up 4.38 percent, just beneath a 106.75 52-week high, before an industry report showed a 7.14 million barrel build. The key Wednesday levels are the 104.60 to 104.69 band and the 102.39 to 102.44 confluence beneath, and 106.75 overhead. The primary setup buys a pullback from 103.40 to 104.60, stop 102.30, targets 106.75, 107.98 and 110.14, with the 10:30 AM ET government report the main risk.
Lean bullish inside a confirmed uptrend. The 10:30 AM ET government inventory report is the override.
An annual high on an expansion day
Crude expanded while the other three markets in the set compressed. Tuesday's 5.54-dollar range measured 1.41 times the 14-day average true range of 3.92 and topped the 14-day average daily range of 3.97. The close held near the top. The settlement landed in the top 17 percent of that range, 0.92 dollars beneath the high and 90.6 percent above the 52-week low of 55.52. Published period changes show a 9.19 percent gain over five days, 24.77 percent over 20 days and 84.16 percent year to date.
Every average sits beneath price, stacked in ascending order. The 5-day average is 102.93, the 20-day 91.41, the 50-day 84.19, the 100-day 82.35, the year-to-date average 76.35 and the 200-day 74.18. That is the configuration of a mature uptrend, and it carries a warning. The settlement sits 14.42 dollars above the 20-day average, more than three and a half average true ranges. Level-crossing math puts the 9-day crossing at 97.70 and the 18-day at 91.31, and the four-week span's 38.2 and 50 percent retracements sit at 96.39 and 93.18.
Trend strength is the story in the indicators. The 9-day directional index reads 51.64, with positive direction at 36.34 against negative at 5.04, and the 14-day reads 35.18 with positive at 35.30 against 8.03. The multi-indicator composite reads 100 percent buy at maximum strength. Overbought readings come with it. The 14-day stochastic percent K sits at 91.80 against a percent D of 89.11, raw stochastics run from 89.63 on the 9-day to 95.28 on the 100-day, and relative strength reads 79.48, 76.15 and 72.26 on the 9, 14 and 20-day windows. In a trend this strong, those readings make a poor standalone reason to sell.
Volatility is high in absolute terms. Historic volatility reads 35.39 percent on the 14-day and 38.73 percent on the 9-day, beneath 45.92 percent on the 50-day. The 14-day average true range equals 3.74 percent of price, roughly four times the broad equity index's figure, so the dollar width of a stop understates the risk.
A physical squeeze meets a paper build
The shortage shows up in the products. Diesel is the fuel most tied to freight and industry, and a record settlement there points to physical tightness. Natural gas settled at 2.9190 dollars. In Libya, a valve closure by facility guards shut the Hamada-Zawiya pipeline, and Saudi Aramco was reported to be canceling and delaying some crude cargoes to European buyers. The conflict involving Iran is described in trade commentary as in its seventh month, and analysis in the trade press puts the price gap between crude grades tied to Strait of Hormuz risk at more than 40 dollars. Explosions were reported on Iran's Kharg Island on September 8 and in Erbil in northern Iraq on Tuesday evening.
The inventory estimate cuts the other way. Beyond the 7.14 million barrel crude build, gasoline stocks rose 1.46 million barrels and distillates 1.61 million, while the Cushing hub drew 246,000 barrels. The October contract reopened at 105.48, traded between 104.69 and 105.63, and printed 104.92 on about 9,030 contracts. The government report is forecast to show a 1.5 million barrel draw against a 0.391 million draw the prior week. A confirmed build of anything like the industry figure would contradict the scarcity case that drove a 9.19 percent five-day advance.
Macro sits one step removed. The 10-year Treasury yield closed at 5.006 percent, and the dollar index rose 0.14 percent, with commentary tying the move to crude's surge on the view that higher energy prices could push the central bank toward more tightening. That loop limits itself: a firmer dollar weighs on the next leg of crude's advance. The rate decision at 2:00 PM ET, with consensus at 4.00 percent against 3.75 percent and an increase more than 90 percent priced, reaches crude through the dollar and the demand outlook. The gold outlook tracks the same rates channel from the metals side.
Open interest in the October contract stands at 149,457, and the contract expires in roughly a week, so the roll into November can move spreads on its own. No options positioning read is used for crude, so the levels below rest on price structure and the computed level set.
Levels between the pivot and the high
Support begins just under the evening trade. The overnight high at 105.63 and low at 104.69 come first, and the computed pivot at 104.60 sits nine cents beneath that low, forming the first decision band. The 14-day stochastic stall reference at 103.84 and one standard deviation support at 103.43 follow, then the 5-day average at 102.93. The next shelf is tight. Three methods land inside five cents there: first pivot support at 102.44, two standard deviation support at 102.43 and the 14-day relative strength reference at 102.39. Beneath them sit the one-range projections at 101.91 and 101.86, three standard deviation support at 101.67 and Tuesday's 101.21 low. The second pivot support at 99.06 and third at 96.90 mark deeper objectives.
Overhead, 106.75 is the line between continuation and failure. The computed upside objective at 107.15, the 14-day relative strength reference at 107.50, first pivot resistance at 107.98 and one standard deviation resistance at 108.23 follow. Two standard deviation resistance sits at 109.23, the one-range projections at 109.75 and 109.80, three standard deviation resistance at 109.99 and the second pivot resistance at 110.14. The third pivot resistance at 113.52 needs a genuine escalation.
The calendar is crowded early. UK consumer prices at 2:00 AM ET are forecast at 3.1 percent, with input producer prices at 5.4 percent. US retail sales and import prices land at 8:30 AM ET, and import prices carry an energy component. The cash open at 9:30 AM ET gives the first directional test before the 10:30 AM ET report. Bank of Canada minutes arrive at 1:30 PM ET, the decision at 2:00 PM ET and the press conference at 2:30 PM ET. Thursday carries a Bank of England decision at 7:00 AM ET, jobless claims at 8:30 AM ET and a Bank of Japan decision late in the session. Further out, the producer group's monthly report is due October 13 and the energy agency's monthly report October 14.
The trade map for Wednesday
The primary setup is a long from 103.40 to 104.60, the band from the computed pivot down to one standard deviation support. The stop at 102.30 sits beneath the three-method confluence, so a stop-out means losing the first pivot support, the two standard deviation support and the relative strength reference together.
| Setup | Primary: long | Alternate: short |
|---|---|---|
| Condition | Pullback into the pivot and first support | Decisive loss of 101.21 after the inventory report |
| Entry zone | 103.40 to 104.60 | Beneath 101.21 |
| Stop | 102.30 | Above 103.43 |
| Target 1 | 106.75 (52-week high) | 99.06 |
| Target 2 | 107.98 (first pivot resistance) | 96.90 |
| Target 3 | 110.14 (second pivot resistance) | None |
| Reward to risk | 1.6, 2.3, 3.6 from 104.00, 1.70 of risk | Smaller size |
| Invalidation | Close beneath 101.21 | Back above 103.43 |
| Override | Government build near 7.1 million barrels | A confirmed draw |
From a 104.00 midpoint the risk is 1.70 dollars. The first target at the 106.75 high returns about 1.6 times risk, the second at the 107.98 first pivot resistance about 2.3 times, and the third at the 110.14 second pivot resistance about 3.6 times, which needs a supply catalyst. A close beneath Tuesday's 101.21 low ends the idea. The 10:30 AM ET report can end it first. A build near the 7.14 million barrel industry estimate argues against buying the dip at all, and a firm draw makes the entry unlikely to trade. Guidance at 2:00 PM ET that firms the dollar can cap the upside even with supply unchanged. The alternate is a short on a decisive loss of 101.21, aiming at 99.06 and then 96.90 with a stop above 103.43. It runs against the trend and the composite, so it needs the inventory report as its trigger and a smaller size.
Scenario ranges are analyst judgment. The low-range case, 103.50 to 107.00, fits an inventory report near forecast. The mid-range case, the most likely, runs 102.50 to 108.00. The high-range case, 100.50 to 110.00, needs an inventory shock or a fresh escalation. The session bands run 103.80 to 106.00 overnight, 103.60 to 106.30 through London, 102.80 to 107.00 in the morning and 102.50 to 108.00 in the afternoon. The base case extends the evening give-back into 103.40 to 104.60 during the European morning, holds that band, and hands the rest of the day to the 10:30 AM ET print. A hold of support and a retest of 106.75 is the trend-following outcome.
October crude closed 0.92 dollars beneath its highest price of the past year, and the first official answer to Tuesday's industry build arrives at 10:30 AM ET.
The complete data picture
Every figure behind the session for October WTI crude: the key readings, the remaining charts, the full level map, then the complete numeric reference.
Complete level map, split at the October settlement 105.83. October contract. The pivot ladder is computed from Tuesday’s 106.75 high, 101.21 low and 105.83 settlement; the high matches the separately published 52-week high.
| Resistance, top down | Support, top down |
|---|---|
| 113.523rd pivot resistance | 105.63Overnight high |
| 110.142nd pivot resistance | 104.69Overnight low |
| 109.993rd SD resistance | 104.60Computed pivot |
| 109.80One 14-day daily range above | 103.8414-day stochastic stall reference |
| 109.75One 14-day true range above | 103.431st SD support |
| 109.232nd SD resistance | 102.935-day average |
| 108.231st SD resistance | 102.441st pivot support |
| 107.981st pivot resistance | 102.432nd SD support |
| 107.5014-day relative strength reference | 102.3914-day relative strength reference |
| 107.15Computed upside objective | 101.91One 14-day true range below |
| 106.75Tuesday high and 52-week high | 101.86One 14-day daily range below |
| 101.673rd SD support | |
| 101.21Tuesday low | |
| 99.062nd pivot support | |
| 97.709-day average crossing | |
| 96.903rd pivot support | |
| 96.3938.2% of the 4-week span | |
| 93.1850% of the 4-week span | |
| 91.4120-day average | |
| 91.3118-day average crossing | |
| 84.1950-day average | |
| 82.35100-day average | |
| 76.35Year-to-date average | |
| 74.18200-day average | |
| 55.5252-week low |
Full numeric reference: every figure from the session review
1. Executive Summary
October crude settled Tuesday at 105.83, up 4.44 dollars or 4.38 percent, after trading a 5.54 dollar session between 106.75 and 101.21 and closing in the top 17 percent of that range. The high is the headline: 106.75 is also the published 52-week high, the 13-week high and the one-month high, so crude did not merely rally, it printed a new annual peak and held almost all of it into the settle.
This is the instrument driving everything else in the four-market set. The 4 percent surge in crude is what lifted inflation expectations, pushed benchmark 10-year Treasury yields above 5 percent to the highest level since 2007, firmed the dollar, and pressured both equity indices and gold. Reading the four instruments together, crude is the cause and the other three are the consequence.
The supply story behind it is unusually concrete. A crucial Saudi pipeline struck earlier in the month is out of service, with regional officials estimating three to five weeks of repairs and the US Energy Secretary saying he expects the outage to be measured in days. The conflict involving Iran is described in trade commentary as now in its seventh month. Risk around the Strait of Hormuz has opened a price gap of more than 40 dollars between crude grades. Brent settled at 108.75 dollars, up 3.07 or 2.9 percent, and diesel settled at 5.2620 dollars a gallon, described as the highest on record. Record distillate prices are the clearest evidence that this is a physical shortage rather than a speculative move.
The technical condition is a powerful confirmed uptrend that is also stretched. The settle sits above every average on the board, from the 5-day at 102.93 to the 200-day at 74.18, and the contract is up 84.16 percent year to date. The 9-day directional index reads 51.64 with the positive directional indicator at 36.34 against a negative of 5.04, a ratio above seven to one, and the multi-indicator composite reads 100 percent buy at maximum strength. Against that, the 14-day stochastic percent K sits at 91.80, which is as overbought as the readings get.
The primary setup therefore buys a pullback rather than chasing the high: long the 103.40 to 104.60 band where the computed pivot and the one standard deviation support sit, against a stop beneath the tight 102.43 to 102.44 pair. The single largest risk to it is not technical but scheduled: industry data released after Tuesday's close showed a crude build of 7.1 million barrels against a 1.8 million draw forecast, and the official government figure lands at 10:30 AM ET Wednesday.
2. Price Action and Technical Structure
2.1 Intraday and Session Review
Tuesday's October session ran 106.75 to 101.21, a 5.54 dollar band, and settled at 105.83, which is 4.62 dollars above the low and therefore about 83 percent of the way up the range. Those extremes are the completed-session inputs behind the published pivot ladder rather than an independently read bar, and the high is independently corroborated: 106.75 is also published separately as the 52-week high, the 13-week high and the one-month high, so Tuesday's high and the annual high are the same print.
Unlike the three other markets in the set, crude expanded rather than compressed. The 5.54 dollar range measures 1.41 times the 14-day average true range of 3.92 and comfortably exceeds the 14-day average daily range of 3.97. A market that expands its range, closes near the high and sets an annual peak on the same day is showing genuine demand rather than drift.
Since the 4:00 PM ET settle and the Globex reopen the contract has traded 105.48 at the open with a 105.63 high and 104.69 low, printing 104.92 on about 9,030 contracts. That is 0.91 dollars beneath Tuesday's settle, or about 0.86 percent, the first meaningful give-back after the surge and most plausibly a response to the industry inventory build reported after the settle.
2.2 Daily Structure
The longer-horizon picture is a powerful advance. The settle sits 0.92 dollars beneath the 52-week high of 106.75 and 90.6 percent above the 52-week low of 55.52. The period changes are extraordinary: positive 8.83 dollars over five days, or 9.19 percent; positive 20.82 over 20 days, or 24.77 percent; positive 34.75 over 50 days, or 49.55 percent; positive 46.53 over 200 days, or 79.74 percent; and positive 47.93 year to date, or 84.16 percent.
A market that has nearly doubled in a year and gained a quarter in a month is not in a normal distribution of outcomes. It is in a supply-driven repricing, and the relevant question for Wednesday is not whether the trend exists but whether the next catalyst extends or interrupts it.
2.3 4-Hour and Swing Structure
The swing sequence is a clean series of higher highs and higher lows with no structural damage anywhere in the recent range. The retracement mathematics are worth stating precisely because they show how far any corrective move would have to travel: the 38.2 percent retracement of the four-week span sits at 96.39 and the 50 percent retracement at 93.18. Both are far beneath the current pivot ladder, which means a decline to either would represent a change of character rather than a pullback.
The nearer structure is defined by the pivot ladder itself, and the notable feature is how tightly the first support band is packed. The first pivot support at 102.44 and the two standard deviation support at 102.43 are one cent apart, and the 14-day relative strength reference at 102.39 sits just beneath them. Three independent methods place a level inside five cents.
2.4 Moving Averages
The October contract's average stack against the 105.83 settle:
- 5-day average 102.93, price above by 2.90 dollars
- 20-day average 91.41, price above by 14.42 dollars
- 50-day average 84.19, price above by 21.64 dollars
- 100-day average 82.35, price above by 23.48 dollars
- 200-day average 74.18, price above by 31.65 dollars
- Year-to-date average 76.35, price above by 29.48 dollars
Price is above every average by a wide margin, and the averages themselves are stacked in perfect ascending order from the 200-day upward. That is the defining configuration of a mature uptrend, and it is also a warning: the distance between price and the 20-day average alone is 14.42 dollars, which is more than three and a half times the 14-day average true range. Reversion risk in a market this extended is large when it comes.
Level-crossing mathematics place the 9-day average crossing at 97.70 and the 18-day at 91.31, both far beneath price, which quantifies how much room exists between the current quote and the first average-based support.
2.5 Oscillator and Trend Readings
The oscillator set is deeply overbought:
- 9-day raw stochastic 89.63 percent, percent K 88.54, percent D 85.80, relative strength 79.48
- 14-day raw stochastic 92.84 percent, percent K 91.80, percent D 89.11, relative strength 76.15
- 20-day raw stochastic 93.11 percent, percent K 91.89, percent D 89.15, relative strength 72.26
- 50-day raw stochastic 94.85 percent, relative strength 62.97
- 100-day raw stochastic 95.28 percent, relative strength 59.26
Every period reads above 88 on percent K and the relative strength readings rise as the window shortens, which is the signature of accelerating momentum rather than a fading move.
The trend readings are the strongest in the four-market set by a wide margin. The 9-day directional index is 51.64 with the positive directional indicator at 36.34 against a negative of 5.04. The 14-day reading is 35.18 with the positive at 35.30 against a negative of 8.03. A directional index above 50 with that spread describes a market in a strong, well-established trend, and in that condition overbought oscillators are a poor standalone reason to fade. The other three markets all showed weak directional indices with negative direction; crude is their mirror image on both counts.
Historic volatility is 35.39 percent on the 14-day and 38.73 percent on the 9-day, beneath the 50-day at 45.92 percent, so realized volatility is elevated in absolute terms while having cooled from its own recent peak.
The multi-indicator composite reads 100 percent buy with strength characterized as maximum and direction as strengthening, and the composite trend signal is also positive. That is the strongest possible reading from this indicator set. For context across the four-market set, the broad equity index reads 16 percent sell, gold 40 percent sell and the technology index 64 percent sell, so crude is the only instrument of the four being bought, and it is being bought maximally. These are conviction scores from a bundled indicator set, not calibrated probabilities.
2.6 Volatility and Expected Range
- 9-day average true range 4.11 dollars, 3.92 percent
- 14-day average true range 3.92 dollars, 3.74 percent
- 20-day average true range 3.79 dollars, 3.61 percent
- 9-day average daily range 4.40 dollars, 4.20 percent
- 14-day average daily range 3.97 dollars, 3.79 percent
- 20-day average daily range 3.73 dollars, 3.56 percent
One 14-day average true range around Tuesday's settle projects 101.91 to 109.75. One 14-day average daily range projects 101.86 to 109.80. Note that the lower bound of both bands sits essentially on Tuesday's session low of 101.21 and just above the three standard deviation support at 101.67, which concentrates a great deal of structure into the 101.20 to 102.45 zone.
Unlike the other three instruments, crude enters Wednesday having already spent more than its average range on Tuesday, so the argument for further expansion rests on the catalysts rather than on unspent distance.
3. Key Levels
All levels below are October crude oil futures prices and stand alone in their own domain. One contract-specific caveat belongs at the top of this section: the October contract expires within roughly a week, so open interest and liquidity will migrate to November over the next several sessions. Levels computed on October remain valid for October, but anyone carrying risk beyond the roll should re-derive them on the next contract rather than transferring these numbers across.
3.1 Resistance
113.52, third pivot resistance. The outer boundary of the computed ladder, reachable only on a genuine supply escalation.
110.14, second pivot resistance. Effectively paired with the three standard deviation resistance at 109.99, making 109.99 to 110.14 a defined upper shelf.
109.99, three standard deviation resistance. A statistical extension boundary and the practical ceiling for an ordinary trending session.
109.23, two standard deviation resistance. The first genuinely extended objective above the pivot ladder's first rung.
108.23, one standard deviation resistance. Sits 0.25 dollars above the first pivot resistance, so the two form a single band.
107.98, first pivot resistance. The primary upside objective for a continuation session, with the 14-day relative strength reference at 107.50 just beneath it.
107.15, the computed upside objective. A short-horizon projected target from the same level set that produces the pivot ladder.
106.75, the 52-week high and Tuesday's session high. The most important level on the board. It is the line that separates continuation from failure, and because the annual high and the session high are the same print, a decisive move above it has no historical supply overhead within the year.
3.2 Support
105.63, the overnight session high. The immediate reference beneath the settle and the first level a recovery must reclaim.
104.69, the overnight session low. Where the post-settle give-back found buyers.
104.60, the computed pivot point. Nine cents beneath the overnight low, which makes 104.60 to 104.69 the first real decision band of the session.
103.43, one standard deviation support. The lower edge of the preferred entry zone for the primary setup, with the 14-day stochastic stall reference at 103.84 just above it.
102.44, first pivot support, with two standard deviation support at 102.43. These two sit one cent apart and the 14-day relative strength reference at 102.39 lies just beneath, giving three independent methods inside five cents. This is the structural line for the primary setup's risk.
101.67, three standard deviation support. The statistical extreme of the downside band.
101.21, Tuesday's session low. The base of the expansion day. Its loss would mean the entire Tuesday advance has been given back and would change the short-term character of the move.
99.06, second pivot support. The first level beneath the round 100 handle and a meaningful psychological and structural objective if the inventory picture turns.
96.90, third pivot support. The outer boundary of the ladder, with the 38.2 percent retracement of the four-week span at 96.39 just beneath, bracketing a deeper corrective objective.
4. Macro Drivers
4.1 Supply Disruption
This is the dominant driver. A crucial Saudi pipeline struck earlier in the month is out of service, with regional officials estimating three to five weeks of repairs and the US Energy Secretary saying he expects the outage to be measured in days, and a Saudi refinery was hit in earlier strikes. Explosions were reported on Iran's Kharg Island on September 8 and in Erbil in northern Iraq on Tuesday evening. Saudi civil defense issued and then cleared warnings in Jazan and Khamis Mushait during Tuesday's session. Trade commentary describes the oil market as running out of buffers, which is the essential point: spare capacity is what normally absorbs a disruption of this size, and the market is pricing as though little remains.
4.2 Geopolitical Risk and the Strait
The conflict involving Iran is described in trade commentary as now in its seventh month. Analysis circulating in the trade press notes that risk around the Strait of Hormuz has opened a price gap of more than 40 dollars between crude grades, which is a direct measure of how much the market is paying for cargoes that do not have to transit the chokepoint. A senior US official stated that Iran is occasionally firing on commercial vessels while also saying the United States is not engaged in aggressive operations, and separately indicated openness to determining whether the United States engages. Separately, reporting indicates one Gulf producer is buying deeply discounted Iraqi crude at a 25 dollar discount, another sign of how widely differentiated the physical market has become.
The two-sided nature of this driver deserves emphasis. The same official commentary that describes openness to engagement also describes an expectation that the conflict ends after the midterm elections. Headlines from this complex can move crude several dollars in either direction without warning.
4.3 Physical Market and Refined Products
Brent settled at 108.75 dollars, up 3.07 or 2.9 percent, so the international benchmark rose slightly less than the domestic one on the day. Diesel settled at 5.2620 dollars a gallon, described as the highest on record, and natural gas settled at 2.9190 dollars. Record distillate pricing is the strongest available evidence that the tightness is physical rather than financial, because diesel is the product most directly tied to industrial and freight demand and the least amenable to substitution.
4.4 Inventories, and the Main Risk to the Long Case
Industry data released Tuesday afternoon, after the settle, estimated a crude build of 7.1 million barrels against a forecast 1.8 million draw, a very large upside surprise to inventories. Gasoline stocks rose 1.5 million and distillates rose 1.6 million, while the Cushing hub drew 0.246 million. Commentary summarized it as inventories jumping while Cushing keeps falling.
This is the clearest bearish input in the picture and the most likely proximate cause of the overnight give-back to 104.92. The official government inventory report lands at 10:30 AM ET Wednesday with a forecast 1.5 million barrel draw. If the official figure confirms a build of anything like the industry estimate, it directly contradicts the scarcity narrative that has driven a 9.19 percent five-day advance, and the resulting unwind could be sharp given how extended positioning is.
4.5 Macro, the Dollar and the Policy Decision
The dollar index rose 0.14 percent on Tuesday to sit just beneath Monday's one-and-a-half-week high, and commentary tied the move directly to the crude surge on the reasoning that higher energy prices raise inflation expectations and could push the central bank toward further tightening. Crude is priced in dollars, so this is a self-limiting feedback loop: the stronger the oil move, the more hawkish the expected policy response, the firmer the dollar, and the greater the headwind to the next dollar of crude upside.
That loop resolves partially at 2:00 PM ET Wednesday, when the interest rate decision, the rate statement and the Summary of Economic Projections all land, with consensus at 4.00 percent against a 3.75 percent prior and a 25 basis point increase more than 90 percent priced. For crude the transmission is second-order and runs through the dollar and through demand expectations rather than through supply.
4.6 Positioning
Direct futures positioning data for crude is not part of this edition and is therefore not quoted. What can be stated is structural: open interest in the October contract is 149,457 with the contract expiring in roughly a week, so a substantial roll into November is due over the coming sessions and can itself produce spread-driven price movement that is unrelated to the underlying supply picture.
5. Options Flow and Dealer Positioning Context
Crude oil is covered here without an options positioning read. The exchange-traded proxies that would supply one for an energy contract do not carry option volume deep enough to produce a reliable dealer-positioning read, so this piece deliberately makes no gamma or dealer-hedging claims for this instrument and relies on price structure, the computed level set and the physical market instead. No proxy is substituted, and no positioning level from another instrument is translated into crude terms.
What can be said about the volatility surface comes from the realized side. Historic volatility is 35.39 percent on the 14-day against 45.92 percent on the 50-day, and the 14-day average true range of 3.92 dollars represents 3.74 percent of spot, which is roughly four times the equivalent percentage for the broad equity index on Tuesday. Crude is by a wide margin the most volatile instrument in the set, and position sizing should reflect that rather than the dollar value of the levels alone.
6. Forecast
Scenario weightings below are analyst judgment, not statistically derived frequencies.
Night Session (6:00 PM ET Tuesday to 3:00 AM ET Wednesday, Globex/Asia)
Mild give-back on the inventory surprise, with the trend intact. The contract reopened at 105.48 and has printed 104.92, 0.91 dollars beneath the settle. The material overnight risk is headline-driven, and Asian trading hours from 9:00 PM ET onward carry the highest sensitivity to fresh Gulf developments, given the physical flows through the region. Expected Globex band 103.80 to 106.00, with a hold above 104.60 keeping the structure constructive and a break of 103.43 signalling the inventory print is being taken seriously.
London Session (3:00 AM to 8:00 AM ET Wednesday)
European hours set the tone for the physical differentials and typically see the most active Brent-related flow. UK inflation data at 2:00 AM ET, forecast at 3.1 percent year over year with input producer prices at 5.4 percent, is relevant here mainly as confirmation that the energy shock is feeding through to headline inflation across economies. Expected band 103.60 to 106.30.
Morning Session (9:30 AM to 12:00 PM ET Wednesday, RTH Open)
The cash open at 9:30 AM ET sets the session's first directional test, but the morning belongs to the 10:30 AM ET government inventory report, forecast at a 1.5 million barrel draw against a 0.391 million draw prior. Given the industry estimate of a 7.1 million build released Tuesday evening, this print carries an unusually wide distribution of outcomes. A confirmed build pressures the 103.43 support and potentially the 102.43 to 102.44 pair; a confirmed draw contradicts the industry figure and sets up a retest of 106.75. Expected morning band 102.80 to 107.00.
Afternoon Session (12:00 PM to 4:00 PM ET Wednesday)
The policy decision and projections land at 2:00 PM ET with the press conference at 2:30 PM ET. Pricing is likely to be disorderly between 2:00 PM and 2:45 PM ET. For crude the effect arrives through the dollar and through the implied demand path rather than directly. Guidance implying further increases strengthens the dollar and caps the advance; guidance implying a pause weakens it and removes a headwind. Expected afternoon band 102.50 to 108.00.
Night Session Forward (6:00 PM ET Wednesday)
Residual direction is set by whichever of the two Wednesday catalysts surprises more. Absent a surprise, the supply narrative reasserts itself into Asian hours, because the pipeline outage is a physical constraint rather than a daily data point. Gulf headlines have repeatedly arrived in the 3:00 PM to 5:00 PM ET window this week, so that is where the overnight risk concentrates.
Expected Range (Wednesday Full Session)
- Low-range scenario: 103.50 to 107.00, a 3.50 dollar band, roughly 0.9 times the 14-day average true range of 3.92, if the inventory report lands near forecast
- Mid-range scenario (most likely): 102.50 to 108.00, a 5.50 dollar band, roughly 1.4 times the 14-day average true range
- High-range scenario: 100.50 to 110.00, a 9.50 dollar band, roughly 2.4 times the 14-day average true range, on an inventory shock or a fresh supply escalation
Most Likely Path
The base case is that the overnight give-back extends modestly into the 103.40 to 104.60 band during the European morning, that band holds, and the 10:30 AM ET inventory print determines the rest of the session. Given a directional index above 50, price above every average, a composite at maximum buy and a physical shortage confirmed by record distillate prices, the trend-following resolution is a hold of support and a retest of 106.75. The genuine risk to that path is specific and scheduled rather than vague: a confirmed inventory build of the size the industry estimate implies would contradict the scarcity narrative directly, and a market this extended with a 14-day stochastic percent K of 91.80 has a long way to fall before it meets an average.
7. Wednesday Economic Calendar
The overnight block opens at 2:00 AM ET with the UK inflation set: consumer prices forecast at 3.1 percent year over year against a 2.9 percent prior, services at 3.5 percent against 3.4 percent, and producer input prices at 5.4 percent against 4.9 percent, the last of which is a direct read on how the energy shock is transmitting. The European morning brings the ECB wage tracker and final Italian harmonised prices at 4:00 AM ET, then eurozone industrial production at 5:00 AM ET, forecast at negative 0.1 percent year over year, which speaks to industrial energy demand. Canadian housing starts and an ECB speaker share the 8:15 AM ET slot.
The US morning opens at 8:30 AM ET with retail sales, forecast at 0.8 percent month over month against a negative 0.6 percent prior, core retail sales at 0.6 percent, and import prices at 0.5 percent against negative 0.4 percent, with import prices carrying an energy component. At 10:00 AM ET the housing market index is forecast at 34 and business inventories at 0.8 percent.
The first-order event for crude is the 10:30 AM ET government crude inventory report, forecast at a 1.5 million barrel draw against a 0.391 million draw prior. It matters more than usual because the industry estimate released Tuesday evening showed a 7.1 million barrel build, roughly 8.6 million barrels away from the 1.5 million barrel draw forecast for the official report, so the print will either confirm or refute the scarcity narrative driving the advance.
The secondary event is the 2:00 PM ET interest rate decision, rate statement and Summary of Economic Projections, consensus 4.00 percent against a 3.75 percent prior, with the press conference at 2:30 PM ET. Its effect on crude runs through the dollar and the implied demand path. Bank of Canada minutes arrive at 1:30 PM ET, relevant given Canadian crude flows.
Beyond Wednesday, Thursday brings a Bank of England decision at 7:00 AM ET, US jobless claims at 8:30 AM ET and a Bank of Japan decision late in the session. Two scheduled energy items sit further out and frame the medium term: a monthly producer-group report on October 13 and a monthly agency oil report on October 14. The October contract's expiry in roughly a week is the nearest structural event specific to this instrument.
8. Primary Trade Setup
Direction: Long
Rationale: Crude is in the strongest confirmed uptrend of the four markets covered for Wednesday, with a 9-day directional index of 51.64, a positive directional indicator of 36.34 against a negative of 5.04, price above every average on the board and a composite at 100 percent buy with maximum strength. Tuesday printed a new 52-week high and closed in the top 17 percent of an expanded range. The supply disruption behind it is a physical outage rather than a single headline, corroborated by record distillate pricing. In that condition the higher-expectancy trade is to buy a pullback into structure rather than to fade an annual high on overbought oscillators.
Entry Zone: 103.40 to 104.60, the band running from the computed pivot point down to the one standard deviation support.
Stop Loss: 102.30 (beneath the three-method confluence at 102.44, 102.43 and 102.39, so that a stop-out requires losing the first pivot support, the two standard deviation support and the relative strength reference together)
Target 1 (T1): 106.75 (the 52-week high and Tuesday's session high)
Target 2 (T2): 107.98 (first pivot resistance, with the computed upside objective at 107.15 and the relative strength reference at 107.50 beneath it)
Target 3 (T3, extended): 110.14 (second pivot resistance, paired with three standard deviation resistance at 109.99; only if a supply catalyst carries price through T2 on expanding volume)
Risk-to-Reward: From a 104.00 entry midpoint against the 102.30 stop, risk is 1.70 dollars. T1 returns 2.75 dollars, roughly 1.6 to 1. T2 returns 3.98 dollars, roughly 2.3 to 1. T3 returns 6.14 dollars, roughly 3.6 to 1.
Invalidation: A sustained move beneath 102.30, and in particular a close beneath Tuesday's session low of 101.21, negates the long thesis and signals the entire Tuesday expansion has been given back.
Macro override: The 10:30 AM ET inventory report is the override and it is scheduled rather than speculative. A confirmed build near the 7.1 million barrel industry estimate contradicts the scarcity narrative directly and argues for standing clear of the long rather than buying the dip into it. A confirmed draw does the opposite and makes the entry zone unlikely to be reached at all. The secondary override is the dollar: guidance at 2:00 PM ET implying further increases firms the dollar and caps the upside even if the supply picture is unchanged.
Alternate setup: Short on a decisive loss of 101.21 with follow-through, targeting 99.06 first and 96.90 second, stop above 103.43. This trades against the dominant trend and the composite, so it requires the inventory report as its trigger rather than price action alone, and it should be sized smaller than the primary.
Sizing note specific to this instrument: the 14-day average true range of 3.92 dollars is 3.74 percent of spot, roughly four times the equivalent percentage for the broad equity index on Tuesday. Position size should be set from that percentage rather than from the apparent narrowness of the dollar-denominated stop.
Sources and methodology
This outlook is built from our session review of October WTI crude oil futures, prepared after Tuesday's settlement on September 15, 2026, with evening electronic prices identified where they are used. Pivot levels are computed from Tuesday's 106.75 high, 101.21 low and 105.83 settlement, and the 106.75 high matches the separately published 52-week high.
No options positioning dataset is used for this contract. Period changes and range statistics are the published figures. The industry inventory estimate arrived after the settlement, and the government report is due at 10:30 AM ET Wednesday.
The WTI and Brent settlements, the record diesel settlement, the industry inventory figures, the Saudi pipeline repair estimates, the Libyan pipeline shutdown and the reported Aramco cargo changes were checked against published reports. Scenario ranges are analyst judgment; they are not statistically derived and carry no calibration.
Published sources include the Seoul Economic Daily market close report, the Associated Press report on the pipeline repairs, the Reuters report on the Energy Secretary's estimate, the Libya Herald report on the Hamada-Zawiya shutdown and the OilPrice.com report on the Aramco cargoes.
Outlooks for ES, NQ, GC and CL are collected on the market outlook page, and our forward trading record, recomputed from the record itself, is on the performance statement.
View pricing →


