
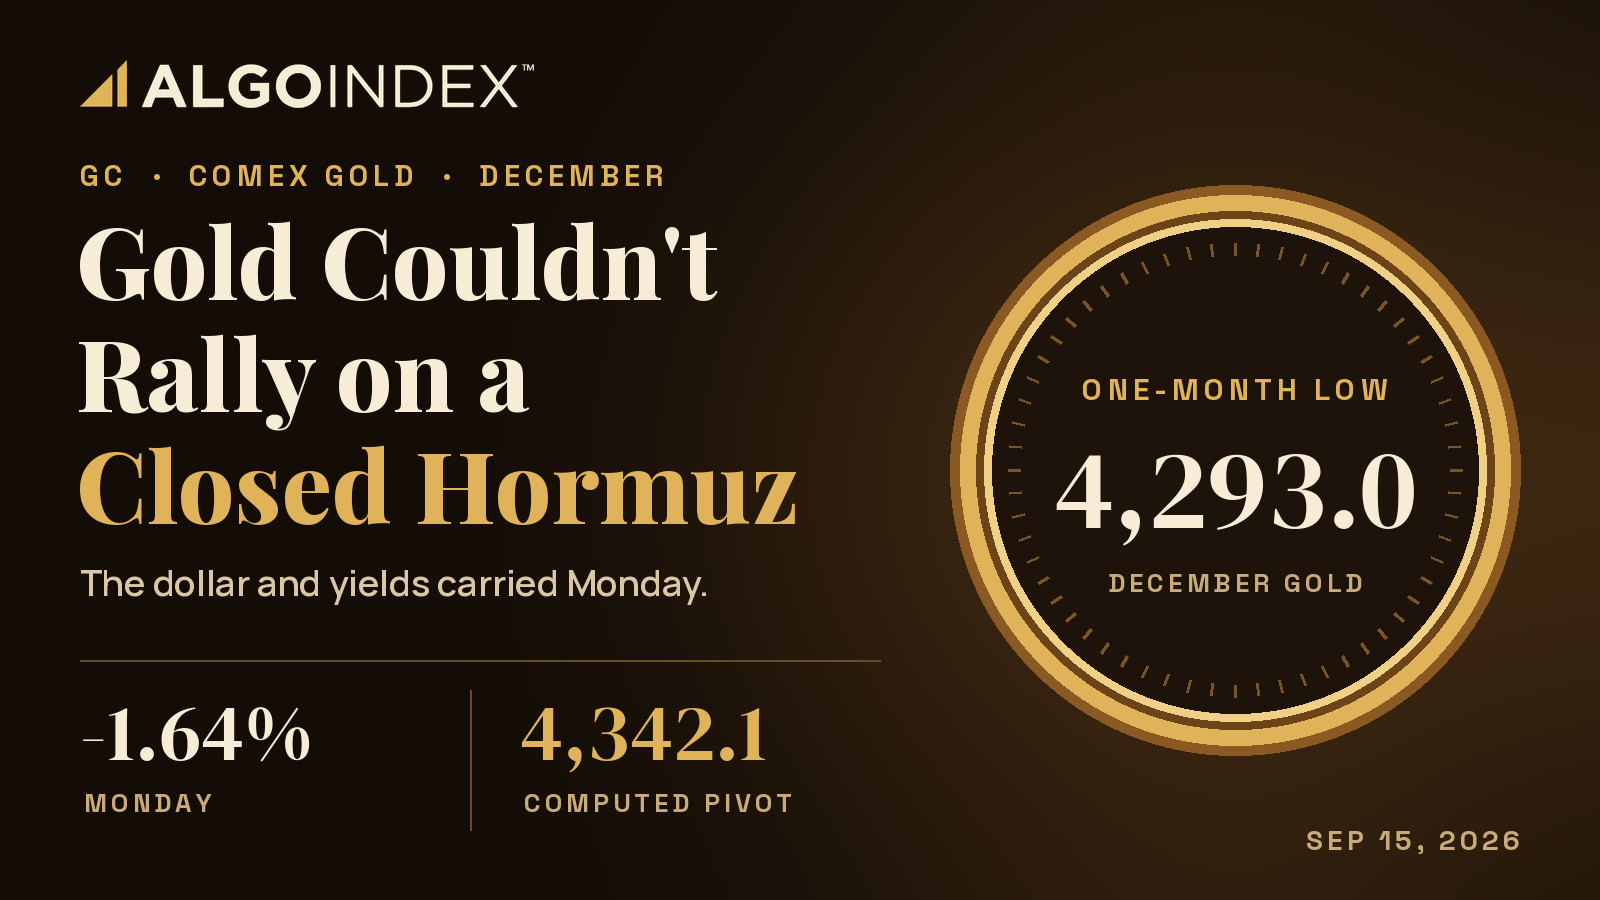
At 4,293.0 on Monday, December gold futures touched their lowest price in a month. Iran's Revolutionary Guard naval command had declared the Strait of Hormuz closed, a supertanker was reported burning after striking a mine south of the strait, crude settled 1.34 percent higher at 101.39 dollars and the volatility index jumped 7.95 percent to 17.11. Gold fell anyway.
By 4:24 PM ET the post-settlement electronic quote read 4,336.4, down 72.5 points or 1.64 percent from Friday's 4,408.9 close. The dollar index finished at 99.500 after touching a week-and-a-half high, and the 10-year Treasury yield at 4.992, with a Federal Reserve decision due Wednesday that the economic calendar forecasts at 4 percent against a previous 3.75 percent. Gold did not trade the war. It traded the rate path.
The metal enters Tuesday beneath the computed pivot at 4,342.1 and 9.2 points above the 50-day moving average at 4,327.2, the only average it still holds on a closing basis.
December gold futures fell 1.64 percent on Monday to a 4,336.4 electronic quote as of 4:24 PM ET, after a one-month low at 4,293.0, as a firmer dollar and near-5 percent yields outweighed a closed Strait of Hormuz. The key Tuesday levels are the 4,342.1 pivot and the 4,386 to 4,396 resistance band overhead, and the 4,327.2 50-day average and 4,290 to 4,300 shelf beneath. The primary setup is a short from 4,386 to 4,396, stop 4,421, targets 4,342.1, 4,293.0 and 4,238.3.
Lean bearish while the metal trades beneath its pivot and the dollar holds Monday's gains.
A gap that never filled
The contract opened at 4,375.0, already 33.9 points under Friday's close. Its only rally attempt stalled at 4,396.8 without reaching Friday's value, so the whole of Monday's range sat beneath the prior close. From there the metal slid through the US morning and into the early afternoon, reached 4,293.0 and held. That low sits 5.1 points under the 38.2 percent retracement from the 13-week low at 4,298.1.
The bounce went only so far. By 4:24 PM ET the quote had recovered to 4,336.4, and the front-month continuous quote was marking 4,340.2 late in the electronic session, about 43 points off the low and 60 points below the high. It stalled right where the 50-day average and the new pivot sit. The range measured 103.8 points against a 14-day average daily range of 114.0, and the metal finished at 41.8 percent of it.
We built Monday's long from 4,330 to 4,346 with a stop at 4,315. The contract was trading inside that zone at 8:15 AM ET Monday, and the slide to 4,293.0 later took the stop out.
Participation was thin for a break of this size. Volume reached 158,885 contracts against a 20-day average of 184,944, and open interest stands at 314,274, so there is no sign yet of a large-scale unwind. Over five sessions the contract has lost 149.7 points, or 3.34 percent, from a period that opened at 4,476.6 and peaked at 4,488.8 on September 8. The one-month window peaked at 4,755.0 on August 25 and is down 110.4 points, or 2.49 percent.
One average left
Price closed above the 50-day by 9.2 points, or 0.21 percent, and below everything else. The 5-day average sits at 4,408.6, 72.2 points overhead. The 100-day is 4,428.1, the 20-day 4,514.1 and the 200-day 4,648.1, which is 311.7 points above the quote. Repairing the intermediate structure means a close back over the 20-day, a climb of 177.7 points, or 4.10 percent.
The swing map has turned. Rallies have topped at 4,755.0 on August 25, 4,488.8 on September 8 and 4,396.8 on Monday, and Monday's low cleared the prior one-month base, pairing a lower low with those lower highs. On the longer horizons the damage looks smaller. The contract sits 25.00 percent below its 52-week high of 5,781.8 from January 29 and 13.67 percent above the 52-week low of 3,806.5, and it is still up 12.91 percent over 52 weeks. It is up 0.62 percent over three months, down 16.96 percent over six and down 3.79 percent for the year, retesting the lower half of a recovery that began near 4,015.6 at the end of June.
Momentum is the strongest case against chasing the decline. The 14-day raw stochastic reads 7.34 percent, with %K at 14.80 and %D at 20.82, and the 9-day raw reading is 12.77 percent. Relative strength is 41.79 on the 14-day, down 5.36 on the session. It reads 34.83 on the 9-day and 45.35 on the 20-day, and a 30 reading would take a price of 4,043.3. Negative direction leads on every window, 21.63 against 15.29 on the 14-day, but the average directional index of 19.97 sits under the 25 mark that signals a trend. The multi-indicator composite reads 40 percent sell.
Overhead, the pivot at 4,342.1 comes first, then Monday's 4,375.0 open and the computed first resistance at 4,391.1, which sits 5.7 points beneath Monday's high and forms the 4,386 to 4,396 band with it. Friday's close at 4,408.9 follows, then the moving-average crossover stall reference at 4,414.3, the second resistance at 4,445.9, three points from the top of a one average true range projection at 4,448.7, and the third resistance at 4,494.9. Beneath the 50-day, the shelf runs from 4,298.1 through Monday's low to the first computed support at 4,287.3. Below that sit the second support at 4,238.3, the projection's lower edge at 4,224.1, the third support at 4,183.5 and the 13-week low at 4,015.6.
The dollar did the selling
The dollar index closed at 99.500, up 0.41 percent, and the 10-year yield rose 0.023 to 4.992. Both raise the cost of holding a metal that pays nothing. The late recovery lines up with yields giving back an early advance, which makes the afternoon base a rates event.
Last week's data built that pressure. Core consumer prices rose 0.3 percent against a 0.2 percent forecast on September 11. Producer prices ran 5.4 percent year over year against 5.3 percent on September 10, with the prior revised up to 4.8 percent. Payrolls printed 162,000 against 55,000 expected on September 4, and personal consumption prices ran 3.7 percent against 3.6 percent. With an increase close to fully priced, the projections released alongside Wednesday's 2:00 PM ET decision are what move the metal, and Tuesday is a positioning day in front of them.
The war news kept coming. Drones struck two fishing boats in southern Iran at 4:17 PM ET with fishermen missing, a civil defense warning was issued and lifted in a southern Saudi province, and officials said a damaged Saudi pipeline will be largely out of service for three to five weeks. On the diplomatic side, Iran's president said his country has no intention of war with Saudi Arabia, and the US administration said oil is flowing through the strait and predicted crude would fall once the conflict ends. Silver fell harder than gold, down 2.26 percent to 63.715, leaving the gold to silver ratio at 68.12. Both metals sold together.
Chinese data released at 10:00 PM ET Monday offered little support for physical demand. Fixed-asset investment fell 7.2 percent over the first eight months, deeper than the 6.7 percent decline through July, and retail sales rose 0.4 percent against a 0.8 percent forecast, while industrial output beat at 5.2 percent. Central bank buying remains the multi-year bid under the metal, but it reports monthly and gives no intraday support.
A crowded long book into a tightening
Speculators have not left. Managed money held 145,804 long contracts against 10,832 short as of September 8, roughly 13.5 longs for every short, and non-commercial traders held 261,007 long against 29,047 short. Both groups cut shorts as well as longs that week. Those figures predate the slide from September 8 to Monday, so today's net is probably smaller, but a book this one-sided carried into a meeting priced for tightening is how an orderly decline turns disorderly. That risk is why the third support at 4,183.5 belongs on the map.
The gold exchange-traded fund closed at 394.07, down 1.18 percent, on 10,733,039 shares. Its positioning data offers little direction: it returns two gamma notional readings with opposite signs, minus 492 million and plus 175 million dollars, and a 1.71 percent implied move to an unnamed expiration, about 74.2 futures points at the 11.004 multiplier measured on Monday. It supports the timing read of a compressed Tuesday and nothing more.
The trade map for Tuesday
The primary setup is a short from 4,386 to 4,396, the band where the computed first resistance meets Monday's failed high. The stop sits at 4,421, above the 4,414.3 stall reference and Friday's 4,408.9 close.
| Setup | Primary: short | Alternate: long |
|---|---|---|
| Condition | Rejection at Monday's failed high | Absorption at the shelf |
| Entry zone | 4,386 to 4,396 | 4,290 to 4,300 |
| Stop | 4,421 | 4,262 |
| Target 1 | 4,342.1 (pivot) | 4,342.1 |
| Target 2 | 4,293.0 (Monday's low) | 4,391.1 |
| Target 3 | 4,238.3 (2nd computed support) | 4,445.9 |
| Reward to risk | 1.6, 3.3, 5.1 from 4,391, 30 points of risk | 1.4 and 2.9 from 4,295 |
| Invalidation | Decisive close above 4,408.9 | Dollar index holds its Monday gains |
Measured from a 4,391 midpoint against 30 points of risk, reward runs about 1.6 times risk to the 4,342.1 pivot, 3.3 times to Monday's 4,293.0 low and 5.1 times to the 4,238.3 second support. The last target needs selling to extend through the low on expanding volume. A decisive close above 4,408.9 fills Monday's gap and ends the idea. A sustained move over 4,445.9 opens 4,494.9 and the 20-day average. The dollar can end it sooner: a dollar index back beneath 99.00 with the 10-year yield under 4.95 removes the mechanism behind the decline and retires the short at any level. A weak 20-year auction at 1:00 PM ET that lifts the long end, or a hint of a larger move on Wednesday, argues for the extended target. A Gulf escalation that sends crude several dollars higher cuts both ways. It can spike gold on the headline, and Monday suggests that spike fades unless yields fall with it.
The alternate is a long from 4,290 to 4,300, and only on evidence that sellers are being absorbed at the shelf. The stop is 4,262 and the targets 4,342.1, 4,391.1 and 4,445.9. It depends on the dollar index giving back Monday's gains. From a 4,295 midpoint it pays about 1.4 times risk to the first target and 2.9 times to the second. Size stays reduced, since it trades against the structure and into an event.
Scenario ranges are analyst judgment. The low-range case, 4,312 to 4,376, is a 64-point session of waiting. The mid-range case, the most likely, runs 4,288 to 4,398, 110 points and in line with the 14-day average daily range. The high-range case, 4,240 to 4,450, needs a shock. A disorderly auction, a yield break or a Gulf escalation that moves crude sharply would qualify. The most likely path holds 4,315 to 4,370 through the overnight and European hours and tests the pivot from beneath at the US open. A morning rally then carries into 4,386 to 4,396 without clearing it. The auction decides the close. A firm reception lets the metal drift back toward the pivot and finish in the 4,330s, and a weak one drives a retest of 4,290 to 4,300. A break beneath 4,287.3 is, in most scenarios, a Wednesday event.
The only average gold still holds is the 50-day, and it sits 9.2 points beneath Monday's 4,336.4 quote.
The complete data picture
Every figure behind the session for December gold: the key readings, the remaining charts, the full level map, then the complete numeric reference.
Complete level map, split at the electronic quote 4,336.4 as of 4:24 PM ET. December futures. The reference print is the post-settlement electronic quote of 4,336.4 as of 4:24 PM ET; the pivot ladder is computed from it.
| Resistance, top down | Support, top down |
|---|---|
| 5,781.852-week high, January 29 | 4,327.250-day average |
| 4,962.8Fund volatility threshold, low confidence, not a tradable reference | 4,298.138.2% from 13-week low |
| 4,755.0One-month high, August 25 | 4,293.0Monday low and one-month low |
| 4,648.1200-day average | 4,287.3First computed support |
| 4,578.538.2% retracement from the four-week high | 4,238.3Second computed support |
| 4,524.050% of 4-week range | 4,224.1One-ATR projection low |
| 4,522.6Fund volatility threshold, low confidence, not a tradable reference | 4,183.5Third computed support |
| 4,514.120-day average | 4,043.3Level for a 30 reading on 14-day relative strength |
| 4,494.9Third computed resistance | 4,015.613-week low, end of June |
| 4,488.8September 8 high | 3,806.552-week low, September 18 last year |
| 4,448.7One-ATR projection high | |
| 4,445.9Second computed resistance | |
| 4,428.1100-day average | |
| 4,414.3Crossover stall reference | |
| 4,408.9Friday close | |
| 4,408.65-day average | |
| 4,396.8Monday high | |
| 4,391.1First computed resistance | |
| 4,375.0Monday open | |
| 4,342.1Computed pivot |
Full numeric reference: every figure from the session review
1. Executive Summary
Gold fell hard on Monday in the face of a geopolitical backdrop that would normally have bid it. The December contract printed a session high of 4,396.8 and a session low of 4,293.0, and the post-settlement electronic quote as of 4:24 PM ET read 4,336.4, down 72.5 points or 1.64 percent against Friday's prior close of 4,408.9. The session low at 4,293.0 is also the one-month low. The contract closed the day at 41.8 percent of its session range, a figure computed from that same high, low and post-settlement electronic print, which means the selling was absorbed off the low rather than accelerating into the bell. Every derived metric in this piece is computed from the post-settlement electronic quote of 4,336.4 as of 4:24 PM ET, and is labelled as such wherever it appears.
The dominant driver was monetary, not geopolitical. The economic calendar carries a forecast of 4 percent against a previous 3.75 percent for the Federal Reserve meeting that convenes Tuesday and announces Wednesday, so a 25 basis point increase is the scheduled consensus. No precise market-implied probability is asserted here. That expectation pushed the dollar index to a one and a half week high at 99.500, up 0.41 percent, while the ten-year yield finished at 4.992, up 0.023. The data flow behind that pricing has been consistently firm: core consumer prices rose 0.3 percent month over month against a 0.2 percent consensus, producer prices ran at 5.4 percent year over year against a 5.3 percent consensus and a revised 4.8 percent prior, and payrolls printed 162 thousand against a 55 thousand consensus. Gold's discount-rate channel simply overwhelmed its haven channel.
The structural contradiction heading into Tuesday is sharp. The energy complex is pricing an active supply shock: naval forces declared the Strait of Hormuz closed and under their control, a supertanker was reported ablaze after striking a mine south of the strait, a Saudi pipeline hit in strikes is expected to remain largely out of service for three to five weeks, and crude settled at 101.39 dollars a barrel, up 1.34 percent, with Brent at 105.68. Equity volatility confirmed the stress, with the volatility index up 7.95 percent to 17.11 while equity index futures fell. Gold did none of what that combination usually produces. A metal that cannot rally on a closed Hormuz, a burning tanker and a rising volatility index is a metal whose marginal buyer has been removed by the rate path, and that is the single most important observation available from Monday's session.
Positioning makes the imbalance actionable. The latest available commitment data, as of September 8, still shows managed money holding 145,804 long contracts against 10,832 short, and non-commercial longs at 261,007 against 29,047 short. That is a crowded long book being carried into a meeting priced for tightening. The primary setup for Tuesday is therefore a short from the reclaimed pivot and session-high confluence band between 4,386 and 4,396, with the alternate a long from the 4,290 to 4,300 shelf only on evidence of absorption, because the meeting itself does not resolve until Wednesday.
2. Price Action & Technical Structure
2.1 Intraday and Session Review
The contract opened at 4,375.0, already 33.9 points below Friday's 4,408.9 prior close, which established the session's character before the US morning began. The early attempt higher stalled at 4,396.8 and never reached Friday's settlement value, so the entire Monday range sat beneath the prior close. That is a gap-down session that never filled its gap, which removes any argument that Monday was a consolidation day. Friday's own high and low are not part of this edition, so no engulfing relationship to Friday's range is asserted.
From the failed morning high the contract worked steadily lower across the US morning and into the early afternoon, reaching 4,293.0 and setting a fresh one-month low in the process. The low held. The post-settlement electronic session recovered to 4,336.4 by 4:24 PM ET and the front-month continuous quote was marking 4,340.2 late in the electronic session, so the metal finished roughly 43 points off the low and roughly 60 points below the high. The recovery matters less than where it stalled: the bounce carried into the low 4,340s and stopped, which is precisely where the 50-day moving average at 4,327.2 and the newly computed pivot at 4,342.1 sit. Sellers defended the first mechanical resistance on the first attempt.
Session character by region was consistent rather than mixed. The overnight and London hours carried the metal lower with the dollar's strong open to the week, the US morning extended the move as yields firmed, and the afternoon produced a base rather than a reversal. There was no capitulation volume signature: total volume of 158,885 against a 20-day average of 184,944 means Monday's decline happened on below-average participation, which is a meaningful qualifier on how much conviction to assign to the break.
2.2 Daily Structure
Measured across the trailing five sessions, the period opened at 4,476.6, made its high at 4,488.8 on September 8 and made its low at 4,293.0 on Monday, a net move of 149.7 points or 3.34 percent lower since September 4. The one-month window opened at 4,437.3, peaked at 4,755.0 on August 25 and bottomed at Monday's 4,293.0, giving a one-month change of 110.4 points or 2.49 percent lower. Monday therefore did not merely extend a short-term slide, it marked the extreme of both the weekly and the monthly window.
Position within the longer structure is more balanced than the recent sessions suggest. The contract sits 25.00 percent below the 52-week high of 5,781.8 recorded on January 29 and 13.67 percent above the 52-week low of 3,806.5 from September 18 of last year. On a 52-week basis the metal is still 12.91 percent higher. The three-month change is a nearly flat plus 0.62 percent, while the six-month change is minus 16.96 percent and the year-to-date change is minus 3.79 percent. What that spread of horizons describes is a market that topped in late January, spent the spring and summer unwinding, found a base near 4,015.6 at the end of June, and is now retesting the lower half of that recovery.
The daily range of 103.8 points sits just under the 14-day average daily range of 114.0, so Monday was a normal-sized down day rather than an outlier, and the close at 41.8 percent of range is neither a strong-close nor a weak-close signature.
2.3 4-Hour and Swing Structure
The swing sequence remains a series of lower highs from the August 25 peak at 4,755.0 through the September 8 high at 4,488.8 to Monday's rejected 4,396.8. Each successive rally has terminated roughly 100 to 260 points beneath the prior one, and none of the intervening lows had, until Monday, taken out the preceding low decisively. Monday's 4,293.0 changed that by clearing the prior one-month base and registering a lower low to pair with the established lower highs. That completes a downward swing structure on the intermediate horizon.
The extension work sitting above current price is instructive. The 38.2 percent retracement measured from the four-week high sits at 4,578.5 and the 50 percent retracement from the four-week high and low sits at 4,524.0, both comfortably above the 20-day moving average, which means a genuine structural repair would require roughly 190 to 240 points of recovery. Below, the 38.2 percent retracement from the 13-week low sits at 4,298.1, effectively coincident with Monday's low, and that coincidence is why the 4,290 to 4,300 shelf carries more weight than a single session's extreme would otherwise justify.
2.4 Moving Averages
The stack is layered against price on every horizon except one, and the exception is the pivotal fact of the session.
- 5-day at 4,408.6, with price 72.2 points below, or 1.64 percent
- 20-day at 4,514.1, with price 177.7 points below, or 3.94 percent
- 50-day at 4,327.2, with price 9.2 points above, or 0.21 percent
- 100-day at 4,428.1, with price 91.7 points below, or 2.07 percent
- 200-day at 4,648.1, with price 311.7 points below, or 6.71 percent
Price closed above the 50-day by 9.2 points and below everything else. That single average is the only structural support the metal is holding on a closing basis, and the distance is small enough that a routine opening move on Tuesday resolves it in either direction. The 20-day at 4,514.1 sitting 177.7 points overhead frames the realistic ceiling for any counter-trend recovery that does not involve a policy surprise.
2.5 Oscillator and Trend Readings
Momentum is deeply compressed, which is the strongest argument against pressing new shorts at current levels.
- 14-day relative strength at 41.79, down 5.36 on the session, with the 9-day at 34.83 and the 20-day at 45.35
- 14-day raw stochastic at 7.34 percent, with percent K at 14.80 and percent D at 20.82
- 9-day raw stochastic at 12.77 percent, with percent K at 23.10 and percent D at 27.37
- 50-day raw stochastic at 41.83 percent and 100-day at 35.40 percent
- 14-day directional index at 19.97, with negative direction at 21.63 above positive direction at 15.29
- 9-day directional index at 25.18, with negative direction at 22.98 above positive direction at 12.01
- 14-day historic volatility at 20.99 percent and 20-day at 23.97 percent
The 14-day relative strength at 41.79 is below the midpoint but nowhere near an exhausted reading, and the level that would mark a 30 reading sits far below at 4,043.3. The stochastics, by contrast, are pinned near the bottom of their range on both the 9 and 14-day windows. The directional index at 19.97 is below the conventional 25 threshold that marks a trending market, so the short-horizon decline is better described as a directional drift inside a broader range than as an established trend. Negative direction leads positive direction on every window measured, which confirms the direction of that drift without confirming its strength.
The multi-indicator composite reads as follows: the overall average reads 40 percent Sell, the short-term group averages 40 percent Sell, the medium-term group averages 25 percent Sell, current strength is described as Weak and current direction as Average. The trend composite reads Hold. Within the component set, the 20-day moving average versus price, the 50-day moving average versus price, the 7-day directional indicator and the 50-day parabolic all read Sell, while the 20 to 50-day and 20 to 100-day moving average crossovers both read Buy. That split is the numeric expression of the structure described above: the short horizon is heavy, the intermediate crossovers have not yet rolled.
2.6 Volatility and Expected Range
- 14-day average true range: 112.3 points, 2.60 percent
- 9-day average true range: 114.7 points, 2.70 percent
- 20-day average true range: 110.7 points, 2.60 percent
- 50-day average true range: 113.3 points, 2.60 percent
- 14-day average daily range: 114.0 points, 2.63 percent
- 9-day average daily range: 117.5 points and 20-day at 113.9 points
A one average-true-range projection from the 4,336.4 post-settlement print spans 4,224.1 to 4,448.7. The fund-level positioning dataset carries a next-expiration implied move of 1.71 percent, which on the fund price of 394.07 is 6.74 dollars, and at the fund-to-futures multiplier of 11.004 measured during this session translates to 74.2 futures points.
That figure cannot be compared to a one-day range. The reading is labelled "next expiration" without a stated expiration date, and a 1.71 percent move to an expiry four sessions away is a very different statement from the same figure over one session. The 74.2 point figure is therefore recorded as a raw reading, and nothing is inferred from its ratio to the 14-day average daily range of 114.0 or the 14-day average true range of 112.3. No compression claim rests on it.
What can be said without it: realised volatility is elevated, the 14-day average true range of 112.3 is the working assumption for Tuesday's distance, and the case for a quiet Tuesday rests on the event calendar, which puts the policy announcement on Wednesday, rather than on the option surface.
3. Key Levels
All levels below are stated in the GC futures domain. The pivot ladder is computed fresh from Monday's session high of 4,396.8, session low of 4,293.0 and the post-settlement electronic print of 4,336.4, and therefore applies to Tuesday's session.
3.1 Resistance
4,342.1, the computed pivot. The first mechanical level overhead and only 5.7 points above where the metal finished the electronic session. The late-afternoon bounce stalled directly beneath it. Whether Tuesday opens above or below this single number frames the entire session, because a market trading beneath its own pivot after a 1.64 percent decline is mechanically in sell-rallies condition.
4,375.0, Monday's opening print. An unfilled reference from the session that produced the decline. Recovering the open would mean the whole of Monday's distribution has been retraced and would force a reassessment of the swing sequence.
4,391.1, the computed first resistance. The primary short-entry reference for Tuesday and the upper edge of the setup band described in section 8. It sits 5.7 points beneath Monday's session high, which makes the 4,386 to 4,396 band a confluence of the mechanical first resistance and the actual failure point of Monday's only rally attempt.
4,408.9, Friday's prior close. Monday never traded here. Reclaiming it would fill the gap that defined the session and would be the first genuine evidence that the decline was a one-day dislocation rather than a continuation.
4,445.9, the computed second resistance. Also the approximate upper edge of the one average-true-range projection at 4,448.7. Two independent methods converging within three points makes this the realistic ceiling for any Tuesday recovery that is not driven by a policy surprise.
4,494.9, the computed third resistance. Roughly 1.4 average true ranges above the reference print, so it is out of reach on a normal session and relevant only as the objective for a genuine short-covering event triggered by an unexpectedly soft policy outcome.
4,514.1, the 20-day moving average. The level that separates a bounce from a repair. Nothing about the intermediate structure changes until the metal closes back above this average, which currently requires 177.7 points of recovery, or 4.10 percent.
3.2 Support
4,327.2, the 50-day moving average. The only average price is holding, by 9.2 points on a closing basis. This is the most consequential support on the board precisely because the margin is so thin. Losing it on a closing basis removes the last structural support beneath the metal and leaves the September low as the next reference.
4,298.1, the 38.2 percent retracement measured from the 13-week low. Effectively coincident with Monday's session low and the reason the shelf beneath current price carries more weight than a single extreme.
4,293.0, Monday's session low and the one-month low. The session's defended level and the line that defines the alternate setup. Absorption here on Tuesday supports a counter-trend long, while a decisive break through it confirms the lower-low structure and opens the computed support ladder below.
4,287.3, the computed first support. Sitting 5.7 points beneath Monday's low, which means the 4,287 to 4,293 zone is a confluence of the mechanical support and the session extreme, and a break needs to clear both to be meaningful.
4,238.3, the computed second support. The first objective on a confirmed break of the September shelf and the third target of the primary setup.
4,224.1, the lower edge of the one average-true-range projection. Converging with the computed second support within 14 points, which marks the 4,224 to 4,238 band as the reasonable maximum downside for a single normal session.
4,183.5, the computed third support. Roughly 1.4 average true ranges below the reference print, reachable only on a session that runs well beyond a normal distance, which in practice means a hawkish policy surprise arriving early or a forced liquidation of the crowded long book described in section 4.6.
4,015.6, the 13-week low. The structural base from the end of June and the level whose failure would end the entire recovery that began there.
4. Macro Drivers
4.1 Dollar and Real Yields
The dollar was the proximate cause of Monday's decline. The dollar index closed at 99.500, up 0.406 or 0.41 percent, having reached a one and a half week high during the session, and the ten-year yield finished at 4.992, up 0.023 or 0.46 percent. Both moves push directly against the metal through the same channel, since a higher nominal yield paired with firm inflation expectations raises the opportunity cost of holding a non-yielding asset.
The sequencing within the session is worth noting precisely. The dollar's advance came alongside falling equities, which added a liquidity-demand component on top of the policy component, and it faded modestly from its best level only after yields gave up an early advance later in the day. That late yield softening is the most plausible mechanical explanation for gold's recovery from 4,293.0 to the low 4,340s into the late electronic session, and it means the metal's afternoon base was a rates-driven event rather than an independent bid.
4.2 Fed and Monetary Policy
The calendar forecast reads 4 percent against a previous 3.75 percent for the meeting that convenes Tuesday and announces Wednesday, which is a 25 basis point increase as the scheduled consensus, and investment-bank scenario commentary timestamped 9:03 AM ET Monday treats no move as a low-probability outcome. The calendar reading is the Monday 6:00 PM ET read of the economic calendar, and no numerical market-implied probability is asserted. The data supporting that expectation has been one-directional. Core consumer prices rose 0.3 percent month over month against a 0.2 percent consensus and a 0.2 percent prior, released Friday September 11. Producer prices ran 5.4 percent year over year against a 5.3 percent consensus, with the prior revised up from 4.7 to 4.8 percent, released September 10. Payrolls printed 162 thousand against a 55 thousand consensus with the prior revised from minus 23 thousand to plus 21 thousand, released September 4. Personal consumption prices ran 3.7 percent year over year against a 3.6 percent consensus, released August 26.
Available policy commentary is not uniform. One governor noted in early September that recent data finally showed some signs of disinflation, while another cautioned in late August that better-than-expected summer inflation data should not be read as a meaningful improvement in underlying trends. Investment-bank commentary circulated Monday morning treating no increase as a very low probability outcome on institutional-credibility grounds. For gold the relevant point is narrower than the debate: an increase is effectively fully priced, so the metal's response on Wednesday will be driven by the accompanying projections and guidance rather than by the decision itself, and Tuesday is a positioning day into that event.
4.3 Geopolitical Backdrop
The geopolitical situation is severe and gold is not responding to it, which is the defining feature of the session. Naval command declared the Strait of Hormuz closed and under its control. A supertanker was reported engulfed in flames after striking a naval mine south of the strait. Two fishing boats were struck by drones in southern Iran at 4:17 PM ET with fishermen missing. A civil defense warning was issued and subsequently lifted in a southern Saudi province. Separately, a Saudi pipeline hit in earlier strikes is expected to be largely out of service for three to five weeks according to officials cited in press reports, and Saudi Arabia is seeking to increase flows through the strait to compensate.
The diplomatic track ran in parallel and in the opposite direction. The Iranian president stated there is no intention of war with Saudi Arabia, that regional security can be built through cooperation, and questioned the basis for negotiating with Washington. The US administration indicated openness to determining whether it engages, stated that oil is flowing through the strait, and predicted crude would fall once the conflict ends. Reports cited sources describing a step-by-step agreement being sought.
For gold the implication is that the haven premium has already been bid and sold. A market that fails to rally on this news set has either absorbed the risk into price or has a marginal holder who is being forced out by the rate path. Both readings argue for treating any geopolitical spike on Tuesday as a supply opportunity rather than a trend beginning, unless it is accompanied by a fall in yields.
4.4 China and Structural Demand
Chinese activity data releases at 10:00 PM ET Monday, covering industrial output with a 4.8 percent consensus against a 4.5 percent prior, retail sales at 0.8 percent against 0.6 percent, urban investment year to date at minus 7.1 percent against minus 6.7 percent, and the unemployment rate at 5.2 percent, followed by a statistics bureau press conference. The urban investment figure deepening past minus 7 percent is the number that matters most for the physical demand channel, since sustained weakness there historically pressures optional jewellery and bar demand even while official reserve accumulation continues.
No official reserve announcement appeared in Monday's flow. Central bank accumulation remains the structural bid beneath the metal on a multi-year horizon and is the principal reason the 52-week change is still plus 12.91 percent despite a 25.00 percent drawdown from the January high, but it operates on a monthly reporting cadence and provides no intraday support. This subsection rests on scheduled-release inference rather than measured flow.
4.5 Energy and Cross-Asset
Crude settled at 101.39 dollars a barrel, up 1.34 dollars or 1.34 percent, reaching a three and three quarter month high, with Brent settling at 105.68, up 1.07 or 1.02 percent. Natural gas settled at 2.8960, gasoline at 3.3171 and diesel at 4.9615. In the electronic session the front-month crude contract was marking 101.96, up 1.91 percent.
The cross-asset picture is unusually clean. Equity index futures fell, with the broad index contract down 0.43 percent and the technology contract down 0.72 percent following a semiconductor selloff tied to artificial-intelligence executives backing slower development. The volatility index rose 7.95 percent to 17.11. Silver fell 2.26 percent to 63.715, putting the gold to silver ratio at 68.12 measured from the front-month continuous quotes. The energy-led inflation impulse is precisely what raises the probability of a firmer policy stance, which is why a crude rally that would historically support gold through the inflation-hedge channel is currently working against it through the policy channel.
Silver underperforming gold by roughly 60 basis points on the day is the internal metals-complex confirmation that this is a broad precious-metals liquidation rather than a gold-specific event.
4.6 Institutional Positioning
Commitment data as of September 8 shows non-commercial longs at 261,007 contracts, up 522, against non-commercial shorts at 29,047, down 3,314. Managed money holds 145,804 long, down 3,917, against 10,832 short, down 2,118. Commercials hold 54,403 long, down 7,047, against 324,677 short, down 1,491. Swap dealers hold 14,542 long, down 3,256, against 253,855 short, up 2,628. Producers hold 16,588 long against 47,549 short. Other reportables hold 115,203 long, up 4,439, against 18,215 short.
The speculative book is heavily one-sided. Managed money is long roughly 13.5 contracts for every one held short, and the non-commercial ratio is close to nine to one. Both cohorts trimmed shorts as well as longs in the reporting week, so the net has not meaningfully de-risked. A crowded long book carried into a meeting priced for tightening is the mechanism by which an orderly decline becomes a disorderly one, and it is the primary reason the computed third support at 4,183.5 is included in section 3.2 despite sitting well beyond a normal session's range. Open interest of 314,274 against Monday's 158,885 volume shows no evidence of a large-scale unwind having occurred yet.
Note that the commitment data is six calendar days stale as of Monday's close and cannot capture the September 8 to September 14 decline, so the current speculative net is likely smaller than the reported figure. This subsection rests on reported positioning rather than measured current exposure.
5. GLD Options Flow Context (Proxy)
This section uses the gold exchange-traded fund as the positioning proxy, since the dealer-positioning surface is published for the fund rather than for COMEX futures. The proxy is supplementary to the macro stack in section 4, which carries the primary edge for this instrument. Fund-to-futures translation throughout this section uses the multiplier of 11.004 measured during this session from the fund price of 394.07 against the futures price of 4,336.4, not an assumed ratio.
The fund closed at 394.07 against a previous close of 398.77, a decline of 4.70 or 1.18 percent, on volume of 10,733,039 shares. The front-month continuous quote for the fund during the electronic session read 392.84, down 1.49 percent. The fund's own 52-week high is 509.70 and its 52-week low is 332.97.
The positioning dataset returns two gamma notional figures for the fund, a negative 492 million reading and a positive 175 million reading, and a next-expiration implied move of 1.71 percent. At the measured multiplier that is 74.2 futures points of movement to an expiration the dataset does not name. As set out above, the expiry date is not stated, so the figure cannot be scaled to a single session and supports no conclusion about whether Tuesday is being priced for compression or expansion. It is recorded here as a reading, not as evidence. The two conflicting gamma notional signs are a further reason to treat this dataset as corroborating rather than leading.
Two modeled volatility thresholds are published for the fund at 411 and 451, which at the measured multiplier correspond to roughly 4,522.6 and 4,962.8 in futures terms. Both sit far above the current price, the nearer of the two more than 186 points overhead. These are modeled underlying-price thresholds produced by a positioning model rather than listed option strikes, and no contract need exist at either price. They are additionally flagged low-confidence because the high and low labels on this pair are known to render inverted on this surface. No level in section 3 is built from either figure, and neither should be treated as a tradable reference on Tuesday.
The plain summary of this section is that the fund-level positioning data supports the timing read, that Tuesday is a compression session ahead of Wednesday's event, and that it offers no independent directional edge for gold at present.
6. Forecast
Night Session (6:00 PM ET Monday to 3:00 AM ET Tuesday, Globex and Asia)
Bias is neutral to mildly lower. The metal reopens beneath its computed pivot at 4,342.1 and only 9.2 points above the 50-day moving average, so the opening hours are a test of whether the late-afternoon base was accumulation or merely the absence of sellers. Chinese activity data at 10:00 PM ET is the session's only scheduled catalyst, with the urban investment figure the most relevant line for physical demand. Asian physical interest typically improves on a decline of this size, which argues against an immediate extension lower. Expected Globex range is roughly 4,315 to 4,365, with the skew to the downside while price remains beneath the pivot.
London Session (3:00 AM to 8:00 AM ET Tuesday)
Bias is lower while the dollar holds its gains. European hours carry UK labour market data at 2:00 AM ET, French final inflation at 2:45 AM ET, German sentiment surveys at 5:00 AM ET with the economic sentiment consensus at 40 against a 34.2 prior, and a euro-area trade balance at 5:00 AM ET. The German sentiment print is the one with genuine dollar implications through the euro leg. European physical demand provides a base of interest rather than a directional force. Expected London range is roughly 4,310 to 4,370.
Morning Session (9:30 AM to 12:00 PM ET Tuesday, US Open)
Bias is lower with a defined invalidation. The scheduled US event is the New York regional manufacturing survey at 8:30 AM ET, consensus 15 against a prior of 20.60, which lands before the cash open and is a second-order release for gold. The cash open at 9:30 AM ET sets the session's first directional test. The level map is compact: the pivot at 4,342.1 immediately overhead, the 50-day moving average at 4,327.2 immediately beneath, and the first resistance at 4,391.1 defining the upper edge of the primary setup band. The metal trading above 4,342.1 through the first hour argues for a move toward the 4,386 to 4,396 band and the short entry; trading beneath 4,327.2 argues for a direct retest of the 4,290 to 4,300 shelf. Expected first-hour range is roughly 40 to 55 points absent a headline shock.
Afternoon Session (12:00 PM to 4:00 PM ET Tuesday)
Bias is neutral with a compression skew. The twenty-year bond auction at 1:00 PM ET is the session's first-order event for gold, because the metal's dominant channel on Tuesday is the long end of the yield curve and a weak reception that pushes yields higher is the most direct route to a test of the 4,290 shelf. The prior auction cleared at a 5.204 percent high yield with a 2.530 bid-to-cover, so those are the reference figures against which the reception is judged. Pricing is likely to be disorderly in the minutes immediately around the result. Beyond the auction, the afternoon belongs to positioning ahead of Wednesday's announcement, and that calendar position, rather than any option-surface reading, is the argument for drift rather than trend into the 5:00 PM ET end of the electronic session.
Night Session Forward (6:00 PM ET Tuesday)
Residual bias is neutral. With the policy announcement scheduled for Wednesday, the Tuesday evening reopen is the lowest-information window of the cycle and carries elevated headline risk from the Gulf without a mechanism for gold to sustain a move on it. Japanese trade and machinery orders data at 7:50 PM ET is the only scheduled catalyst.
Expected Range (Tuesday Full Session)
- Low-range scenario: 4,312 to 4,376, a 64 point session consistent with positioning waiting for Wednesday's announcement
- Mid-range scenario (most likely): 4,288 to 4,398, a 110 point session consistent with the 14-day average daily range of 114.0
- High-range scenario: 4,240 to 4,450, a 210 point session requiring a disorderly auction, a yield break or a Gulf escalation that moves crude sharply
Most Likely Path
The most probable Tuesday sees an Asian and European session that holds the 4,315 to 4,370 band, a US open that tests the pivot at 4,342.1 from beneath, and a morning recovery attempt that carries into the 4,386 to 4,396 confluence of the computed first resistance and Monday's failure point without clearing it. That rally supplies the primary short. The afternoon then turns on the twenty-year auction at 1:00 PM ET: a firm reception releases the metal to drift back toward the pivot and close in the 4,330s, while a weak reception that lifts the long end drives a retest of the 4,290 to 4,300 shelf into the close. The deeper break beneath 4,287.3 is a Wednesday event in most scenarios, because the announcement is what resolves the rate expectation currently driving the metal.
7. Tuesday Economic Calendar
The overnight block begins with Chinese activity data at 10:00 PM ET Monday covering industrial output at a 4.8 percent consensus against 4.5 percent prior, retail sales at 0.8 percent against 0.6 percent, urban investment year to date at minus 7.1 percent against minus 6.7 percent and unemployment at 5.2 percent, followed by the statistics bureau press conference. Australian central bank commentary is scheduled at 7:00 PM ET Monday.
London hours open with UK labour market data at 2:00 AM ET, covering the unemployment rate at a 4.9 percent consensus matching prior, average weekly earnings at 3.9 percent against a 4.1 percent prior, earnings excluding bonus at 3.5 percent matching prior, and employment change at minus 5 thousand against minus 13 thousand prior. French final inflation follows at 2:45 AM ET with harmonised prices at 2.7 percent year over year. German sentiment surveys print at 5:00 AM ET with economic sentiment at a consensus of 40 against a 34.2 prior and current conditions at minus 52.1 against minus 61.1, alongside the euro-area trade balance. European central bank commentary is scheduled at 10:00 AM ET.
The US morning carries Canadian wholesale sales and the New York regional manufacturing survey together at 8:30 AM ET, the latter with a consensus of 15 against a 20.60 prior. The US afternoon carries the twenty-year bond auction at 1:00 PM ET, referenced against a prior 5.204 percent high yield and 2.530 bid-to-cover, and a legislative cloture vote at 2:15 PM ET.
The single first-order event for gold on Tuesday is the twenty-year auction at 1:00 PM ET, because the long end of the curve is the transmission channel through which the policy expectation is currently reaching the metal, and because no US inflation or labour release is scheduled. The broader point is that Tuesday is a light US data day positioned directly beneath a heavy Wednesday: the policy announcement and US retail sales both land Wednesday, with retail sales at 8:30 AM ET carrying a 0.8 percent consensus against a minus 0.6 percent prior. Looking a week forward, the next first-order event group after Wednesday is the following month's inflation cycle, which means the event that resolves gold's current compression arrives Wednesday and not later. Position sizing on Tuesday should reflect that the session is a staging window rather than a resolution window.
8. Primary Trade Setup
Direction: Short
Rationale: Gold closed beneath its computed pivot with a completed lower-high and lower-low swing structure, a crowded speculative long book carried into a meeting whose scheduled consensus is a 25 basis point increase, and a demonstrated failure to bid on a closed Hormuz and a 1.34 percent crude settlement advance. The trade sells the mechanical first resistance where Monday's only rally attempt already failed.
Entry Zone: 4,386 to 4,396, the confluence of the computed first resistance at 4,391.1 and Monday's session high at 4,396.8
Stop Loss: 4,421 (above the moving-average crossover stall reference at 4,414.3 and above Friday's prior close at 4,408.9, so that a genuine reclaim of the prior session's reference invalidates rather than a wick)
Target 1 (T1): 4,342.1 (the computed pivot, the first mechanical magnet beneath entry)
Target 2 (T2): 4,293.0 (Monday's session low and the one-month low, coincident with the 38.2 percent retracement from the 13-week low at 4,298.1)
Target 3 (T3, extended): 4,238.3 (the computed second support, converging with the lower edge of the one average-true-range projection at 4,224.1, taken only if momentum extends through T2 on expanding volume)
Risk-to-Reward: Approximately 1:1.6 to T1, 1:3.3 to T2 and 1:5.1 to T3, measured from the 4,391 midpoint of the entry zone against the 4,421 stop
Alternate Setup: Long from 4,290 to 4,300 on evidence of absorption at the shelf, a zone bracketing Monday's low at 4,293.0 and the 38.2 percent retracement from the 13-week low at 4,298.1, and sitting directly above the computed first support at 4,287.3. Stop 4,262 beneath the zone. T1 4,342.1 at the pivot, T2 4,391.1 at the computed first resistance, T3 4,445.9 at the computed second resistance, contingent on the dollar index losing its Monday gains. Approximately 1:1.4 to T1 and 1:2.9 to T2 from the 4,295 midpoint. Reduced size is appropriate on this side, since it trades against the established structure and into an event.
Invalidation: A decisive session close above 4,408.9, Friday's prior close, negates the short thesis by filling the gap that defined Monday. A sustained move above 4,445.9 unlocks 4,494.9 and then the 20-day moving average at 4,514.1.
Macro override: A dollar index reversal back beneath 99.00 paired with the ten-year yield losing 4.95 removes the mechanism driving the decline and should close short exposure regardless of level. In the other direction, a weak twenty-year auction at 1:00 PM ET that lifts the long end materially, or a policy leak pointing to a larger move Wednesday, accelerates the downside and justifies carrying T3. A genuine Gulf escalation that moves crude several dollars higher is the two-sided risk: it can spike gold on the headline, but the session experience on Monday argues the spike fades unless yields fall with it.
Sources and methodology
This outlook is built from our desk's session review of December gold futures, prepared after Monday's session on September 14, 2026. Pivot levels and derived metrics use the post-settlement electronic quote of 4,336.4 as of 4:24 PM ET together with Monday's high of 4,396.8 and low of 4,293.0, in place of the official settlement.
Fund positioning figures come from the gold exchange-traded fund and are translated at the 11.004 multiplier measured on Monday. The fund's modeled volatility thresholds are low-confidence and are not used as levels. Commitment figures are as of September 8 and predate Monday's decline.
China's August activity figures, released by the National Bureau of Statistics at 10:00 PM ET Monday, were added from published reports before publication. Scenario ranges are analyst judgment; they are not statistically derived and carry no calibration.
Outlooks for ES, NQ, GC and CL are collected on the market outlook page, and our forward trading record, recomputed from the record itself, is on the performance statement.
View pricing →


