
At 3:06 PM ET Sunday, a regional meeting due to convene Monday in Salalah, Oman was called off, described as a postponement in the interest of consensus. Within hours the October crude contract had printed 103.31, higher by roughly 3.26 percent against Friday's settlement, after opening the electronic session at 102.25 and working between 101.59 and 103.44. Volume reached 17,168 contracts against open interest of 177,992. A diplomatic track came off the calendar and price took back the bulk of Friday's decline.
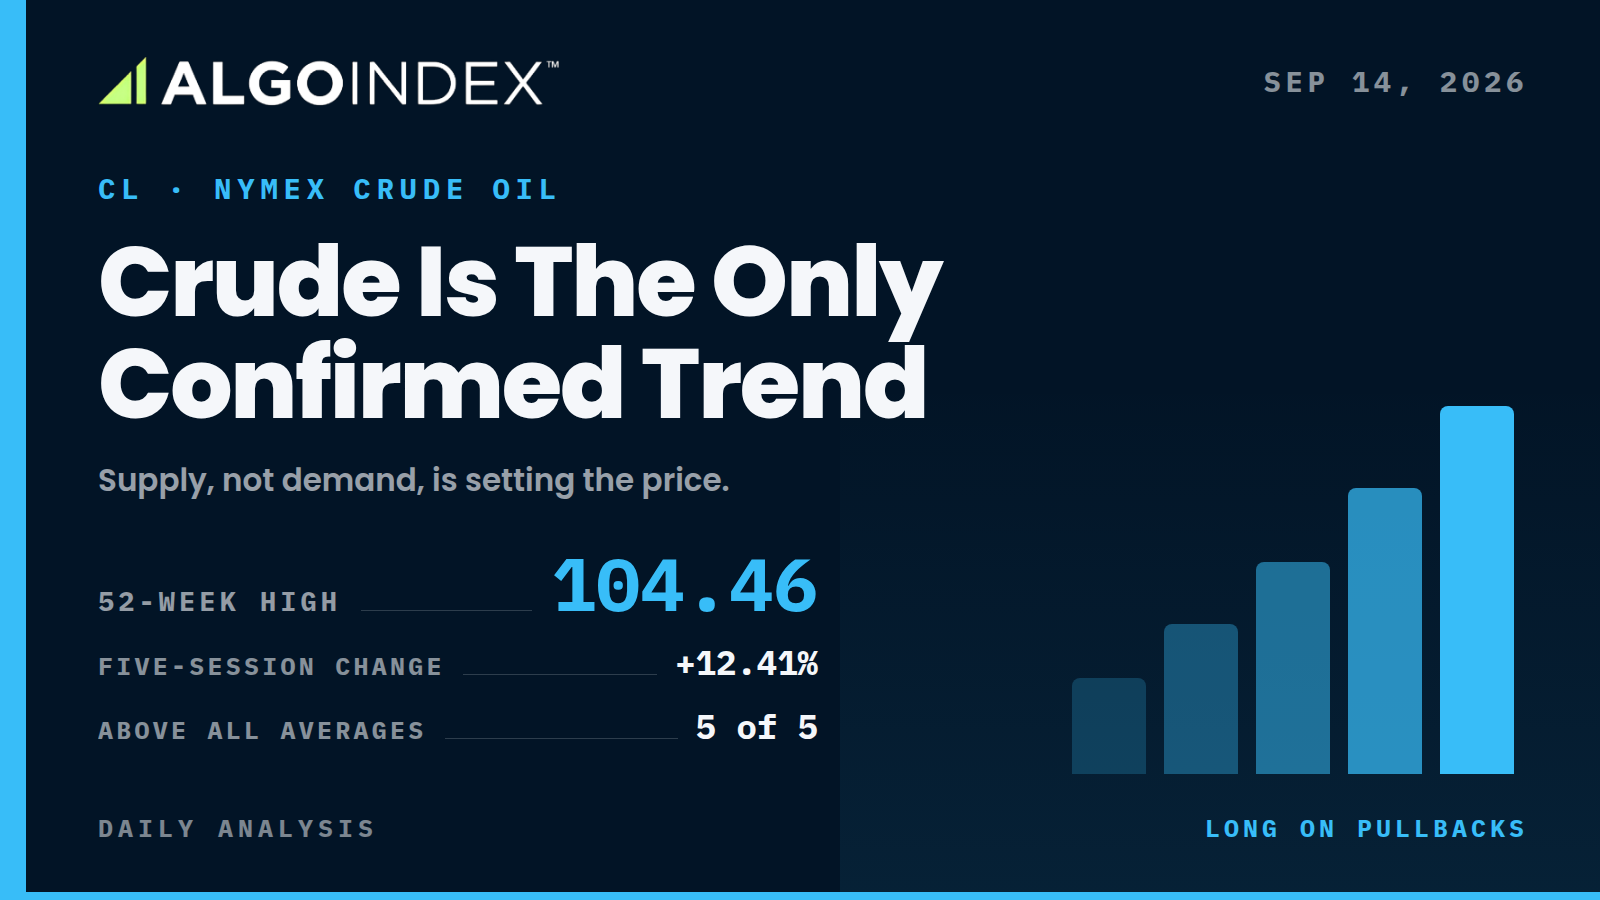
Friday had looked like a top. The October contract ran to a fresh 52-week high at 104.46, then settled at 100.05, lower by 2.43 dollars or 2.37 percent, with the close at 26.13 percent of the session range. A settlement in the lower third on the day of a new annual high is a reversal signature. Sunday deleted it, and deleted it in steps, 102.81 and then 103.31 through the evening. Monday's whole question now fits inside twenty cents of price near the annual high. Beneath that band the trade is a pullback long into the computed pivot. Above it, there is no overhead structure at all.
Updated at 8:15 AM ET Monday. The October contract trades 103.09, higher by 3.04 percent against Friday’s 100.05 settlement, which puts it above the 101.00 to 102.00 entry zone described below and 1.37 dollars beneath the 104.46 annual high. The setup is waiting rather than engaged. The overnight advance has extended into the Monday morning session rather than stalling, which is the progressive character the piece below argues matters more than the size of the gap. Equities are lower across the board and volatility is 17.62, higher by 10.75 percent, which is consistent with crude being the source of the cross-asset impulse this morning rather than a recipient of it.
Three Sessions, Thirteen Dollars
The five-day low at 90.87 was set September 8. The annual high came three sessions later. That is 13.59 dollars, roughly 15 percent, in three days. Widen the lens and the swing lows read the same way: 67.12 on July 2, 79.62 on August 26, 90.87 on September 8, each roughly 12 dollars above the last, with the interval compressing from 55 days to 13. That compression is what a supply shock looks like as it works through the curve.
Price sits above every moving average in the stack, and the averages run in correct ascending order from the 200-day at 73.72 up through 81.86, 82.78 and 89.34 to the 5-day at 98.89. There is no moving-average resistance anywhere above price. The drop back to the 20-day, roughly 14 dollars or 3.5 average true ranges, is the strongest argument for cutting size.
Trend strength is genuine, and it governs how the oscillators read. The 14-day directional index reads 30.69 with the 9-day at 45.17, and positive directional movement of 36.53 against negative of 9.31 gives a ratio near 3.9 to 1. Relative strength reads 76.30 on the 14-day window and the raw stochastic 93.44 percent. Price is pinned at the top of every lookback window at once. In a trend this well confirmed, extended readings run for weeks, and treating them alone as a reversal trigger has been a dependable way to miss the move.
Twenty Cents Decide the Session
Two references sit on top of current price: the overnight high at 103.44 and the first computed resistance at 103.51, seven cents apart. That is the immediate ceiling. This desk's review identified the 104.26 to 104.46 band as the decisive line for this contract, above which no structural resistance remains, because no price above it has traded in the past year. Inside those twenty cents sit the 3-to-10-day crossover reference at 104.26, the first standard-deviation resistance at 104.30 and the annual high itself.
Everything above is mechanical. Computed pivot levels and deviation bands, with no prior trading behind them to supply overhead interest. In open territory the first objectives are 106.06 and the second computed resistance at 106.97, then the relative strength upper band at 108.10 and the third computed resistance at 109.48. A first touch of the band likely gets rejected sharply. An annual high defends itself on psychology alone.
Under 102.63 the references stack up fast, and that density is what a trend-following long wants. The stochastic stall reference sits at that 102.63 mark, the overnight low at 101.59 just under it, then the computed pivot at 101.00. Under that, the Friday settlement at 100.05 sits with the round number, the stochastic 80 percent reference at 99.49 just below, and the Friday session low at 98.49 paired with the relative strength 70 percent reference at 98.68. First computed support is 97.54. A further concentration sits between 94 and 96, including the second computed support at 95.03. The third computed support at 91.57 would mean the structure has broken outright.
The Barrels That Are Not There
The driver is supply, not demand. A Saudi refinery was struck in early September, explosions were reported on Iran's Kharg Island on September 8, and two vessels were hit by unidentified projectiles near Oman on Thursday. Iran stated earlier in the week that it is ready for a more intense conflict and will escalate. Saudi Arabia's foreign ministry said Friday it had chosen not to retaliate at that stage, following a request from Iraq's prime minister, and attributed a pipeline attack to drones originating from Iraq. Reporting Saturday evening indicated producers, traders and refiners are bracing for a prolonged conflict. One item cuts the other way: a Houthi spokesperson stated September 10 that Red Sea navigation remains safe and uninterrupted.
Friday's fall traced to an international energy agency warning that elevated prices and restricted supply would produce the largest drop in global oil demand since the pandemic. The same agency said something else that day. It raised its estimate of this year's global supply deficit to 1.7 million barrels per day from 1.3 million and pushed the expected return to surplus out to 2027 from late 2026. That is the statement that counts, and Sunday's price action agrees.
Crude is now setting the policy path. Commentary published Sunday evening said the week's surge sharply raised the odds of a rate increase at the September 16 meeting, with implied odds in the mid-to-high eighties. August core prices printed 0.3 percent month over month against a 0.2 percent expectation. Across the Sunday reopen the broad equity index contract is down 0.48 percent and the technology contract down 1.27 percent, traceable to the same impulse.
Where the Long Sits and What Kills It
Buy the pullback, do not chase the high. The entry zone is 101.00 to 102.00, into the computed pivot and the overnight low area, with the stop at 99.40, beneath the Friday settlement, the round number and the 99.49 stochastic reference. Targets are 104.46, then 106.97, then 109.48, giving roughly 1:1.41, 1:2.60 and 1:3.80 from the 101.50 midpoint. Invalidation is two consecutive 30-minute closes below 99.40.
Size down, for two separate reasons. Average true range reads 4.18 dollars on the 9-day against 3.92 on the 14-day and 3.45 on the 50-day, and with a 1,000 dollar point value a single average-range session moves about 3,920 dollars per contract. The second reason is evidentiary. No positioning dataset and no commitment-of-traders breakdown were captured for this contract in this run, so these levels rest on price structure and computed values alone. Hold the invalidation without negotiation. The published record for setups like this sits at https://algoindex.com/performance-statement/.
Monday's calendar gives the session nothing to lean on. There are no scheduled United States economic releases and no energy inventory data. The Treasury auctions 13-week and 26-week bills at 11:30 AM ET, routine operations with no bearing on this contract. Regular hours open at 8:00 AM CT and the contract settles at 1:30 PM CT, which is 2:30 PM ET, so the afternoon's last 90 minutes trade after settlement. Mid-range expectation is 101.00 to 105.20, about 1.07 times the 14-day average true range.
Both genuine catalysts land after Monday's bell. Chinese industrial output, retail sales, unemployment and urban investment arrive at 10:00 PM ET Monday, and crude inventories follow Wednesday at 10:30 AM ET, forecast at a 1.35 million barrel draw against a prior draw of 0.391 million. Anything bought Monday gets carried into both. A rescheduled meeting that convenes and produces a concrete agreement, or verified restoration of disrupted export capacity, ends the supply thesis regardless of price. Session reviews across four contracts are described at https://algoindex.com/#pricing.
Twenty cents of computed levels are all that separate this contract from a price nobody has traded in a year.
The complete data picture
Every number behind the session, charted first, then the full level map, then the complete numeric reference underneath.
| Resistance, top down | Support, top down |
|---|---|
| 109.48Pivot R3, extended objective | 102.6314-day stochastic stall reference |
| 108.1014-day relative strength upper band | 101.59overnight session low |
| 107.413 Standard Deviation Resistance | 101.00Pivot Point, anchor of the setup |
| 106.97Pivot R2, first objective in open territory | 100.05Friday settlement, reinforced by the round number |
| 106.062 Standard Deviation Resistance | 99.4914-3 day raw stochastic 80 percent reference |
| 104.4652-week high and Friday session high, decisive line | 98.49Friday session low |
| 104.301 Standard Deviation Resistance | 97.54Pivot S1 |
| 104.263-to-10-day moving average crossover reference | 95.801 Standard Deviation Support |
| 103.51Pivot R1, immediate ceiling | 95.03Pivot S2 |
| 103.44overnight session high | 94.042 Standard Deviation Support |
Full numeric reference, every remaining figure from the session review
Executive Summary
The last completed session was Friday, September 11, where the October contract settled at 100.05, lower by 2.43 dollars or 2.37 percent. That decline followed Thursday's 6.7 percent advance and came after the contract set a fresh 52-week high at 104.46 during Friday's session. The close at 26.13 percent of the session range was weak, placing the settlement in the lower third of the day.
This is the only instrument in tonight's package with a definable trend, and the trend is strongly higher. The 14-day directional index reads 30.69 with positive directional movement at 36.53 against negative at 9.31. Over five sessions the contract is higher by 11.35 dollars, or 12.41 percent. Over one month it is higher by 26.22 percent, over three months by 28.46 percent, and year to date by 45.88 dollars, or 80.56 percent. Price trades above every moving average in the stack.
The driver is supply, not demand. The active conflict between the United States and Iran has removed barrels from the market, and the weekend news flow points to entrenchment rather than resolution: reporting Saturday indicated the oil industry is preparing for a prolonged conflict, Saudi Arabia attributed a pipeline attack to drones originating from Iraq, and a regional meeting scheduled for Monday in Salalah, Oman was postponed Sunday afternoon. Friday's decline was attributable to an International Energy Agency warning that elevated prices and restricted supply would produce the largest drop in global oil demand since the pandemic. That same agency simultaneously raised its estimate of this year's global supply deficit to 1.7 million barrels per day from 1.3 million and pushed the expected return to surplus out to 2027 from late 2026, which is the more consequential of the two statements and cuts against the demand warning that drove prices lower.
The structural contradiction heading into Monday is that Friday's weak close has already been rejected. The Sunday electronic reopen has advanced roughly 2.8 to 3.3 percent to trade between 101.59 and 103.44, recovering the bulk of Friday's decline and returning price to the computed first resistance at 103.51 and within 1.15 dollars of the 52-week high.
The Primary Setup is a long on a pullback into the 101.00 to 102.00 area, targeting the 52-week high and the second computed resistance, with invalidation on acceptance beneath the Friday settlement. The material qualification is that momentum readings are extended, with the 14-day raw stochastic at 93.44 percent.
## 1A. Monday Pre-Market Refresh (8:15 AM ET, 2026-09-14)
This section is an additive update captured at 8:15 AM ET on Monday, September 14, and it supersedes any figure below it that has since gone stale. Nothing in sections 2 through 9 has been rewritten or removed. That material remains the audited record of what was known when this review was prepared on Sunday evening, and where a number here conflicts with a number there, the number here governs.
Verified front month. CL1!, the NYMEX Light Sweet Crude Oil October '26 contract, trades 103.09, higher by 3.04 percent. Friday's settlement was 100.05, so the advance is 3.04 dollars. The arithmetic reconciles exactly: 100.05 multiplied by 1.0304 gives 103.09, and 3.04 divided by 100.05 is 3.04 percent. Price sits at the upper end of the 101.59 to 103.44 Sunday reopen band described in section 1 and 1.37 dollars beneath the 52-week high of 104.46.
Domain caution. The spot reference for the grade is 103.15, higher by 2.39 percent. That is a spot quote, not the October futures contract, and the two differ by 6 cents this morning while differing materially in percent change because they are measured against different prior references. The instrument reviewed in this file is CL1!, the October NYMEX futures contract, at 103.09. The options flow data carries a header labelled "Gold" that is spot metal rather than the December futures contract, and a header quoted as "^SPX" at 7,607.45 that is the cash equity index rather than the future. Neither is a futures quote, and that caution is recorded here so no reader imports a headline number from that dashboard into this file without checking its domain.
Where the published setup actually stands. It is waiting. Section 8 published a long on a pullback into 101.00 to 102.00. CL1! at 103.09 is above that entry zone and below Target 1 at 104.46, so no entry has been made and no target reached. The stop at 99.40 is not in play. The desk narrative describes crude making fresh highs, and against that framing it is worth stating precisely that the October contract at 103.09 remains 1.37 dollars beneath the 52-week high of 104.46 recorded in section 8, so the move is a strong advance rather than a confirmed new extreme on this contract. The setup requires a pullback that has not yet come.
What changed in the macro picture. Two items, neither of which appears in the Sunday analysis. First, the volatility index is 17.62, higher by 1.71 points or 10.75 percent, against Friday's close of 15.84. Any description in this file of a 15 handle on volatility is now stale. Second, a new catalyst: leading artificial intelligence companies are discussing a pause in development, which is the attributed driver of this morning's technology underperformance, with the Nasdaq contract off roughly 150 basis points against 60 for the broad equity market. The consequence for this instrument is indirect but real. The desk attributes technology pressure to those executive calls to slow artificial intelligence development combined with rising crude, which means this contract is now being cited as one of the two named drags on equity risk rather than as an isolated supply story. That also activates, from the other side, the macro override written into the equity reviews in this package, which treats a crude advance through 104.46 as invalidating their mean-reversion thesis. Traders price 86 percent odds of an increase on Wednesday, with the September 16 volatility expiry and policy decision and the September 18 quarterly expiration as the week's key dates.
Positioning data. The dealer-positioning stack published this morning carries columns for the December broad-market future, the cash equity index, the broad-market exchange-traded fund, the Nasdaq cash index and its fund, and the small-cap index and its fund. It carries no column for crude oil or any energy vehicle, and the institutional flow report lists no crude position among its recorded changes. The evidentiary limitation stated in section 5 and repeated in the section 8 sizing note therefore still holds without amendment: this setup rests on price structure and mechanical computation alone, with no positioning dataset to corroborate it. The desk's published levels this morning, pivot 7,590 and support 7,600 and 7,350 with pure negative gamma below cash 7,600, are equity cash levels and have no application to this contract.
Price Action & Technical Structure
2.1 Intraday and Session Review
Friday's October contract traded from 98.49 to 104.46, a range of 5.97 dollars, settling at 100.05. The high was a fresh 52-week high. The close at 26.13 percent of range placed the settlement in the lower third, which on a day that registered a new annual high is a reversal signature worth recording.
This contract settles at 1:30 PM CT, which is 2:30 PM ET, and trades a regular-hours window of 8:00 AM to 1:30 PM CT. Its settlement window does not align with the equity index instruments, so derived metrics are not cross-comparable between them.
The Sunday electronic reopen has substantially reversed Friday's reversal. The contract opened at 102.25 and has traded between 101.59 and 103.44, with successive reads through the evening at 102.81 and then 103.31, an advance of roughly 2.76 to 3.26 percent against the Friday settlement. Volume stands at 17,168 contracts against open interest of 177,992. The direction of travel through the evening has been higher, which is a meaningful detail: this is not a single opening gap that has since stalled but a progressive advance.
2.2 Daily Structure
The daily structure is a strong and accelerating uptrend. The 52-week high of 104.46 was set Friday, September 11. The five-day period low of 90.87 was set September 8, three sessions before the high, so the contract has covered 13.59 dollars, or roughly 15 percent, in three sessions.
Over one month the contract is higher by 21.36 dollars, or 26.22 percent, from a one-month low of 79.62 set August 26. Over three months it is higher by 22.78 dollars, or 28.46 percent, from a three-month low of 67.12 set July 2. The 52-week low of 55.52 was set December 16, 2025, and price now sits 85.21 percent above it.
The sequence of higher highs and higher lows is intact and unusually clean. There is no overhead structure of any kind above 104.46, since that is the highest price in a year, which means resistance above current price is entirely mechanical rather than structural: computed pivots, standard-deviation bands and momentum references, with no prior trading to supply supply.
2.3 4-Hour and Swing Structure
The swing sequence is a series of higher lows in rapid succession: 67.12 on July 2, 79.62 on August 26, and 90.87 on September 8. Each successive low is roughly 12 dollars above the prior, and the intervals are compressing, from 55 days to 13 days. That acceleration is characteristic of a supply-driven repricing rather than an orderly trend.
The operative near-term reference is the Friday session low at 98.49, which coincides closely with the 14-day relative strength 70 percent reference at 98.68 and sits just above the first computed support at 97.54. That confluence marks the first meaningful test of the trend structure.
Retracement structure sits far below current price and is not immediately actionable: the 38.2 percent retracement from the four-week high is at 94.97 and the 50 percent retracement of the four-week range at 92.04.
2.4 Moving Averages
The stack against the current quote near 103:
| 5-day | 98.89, price above by approximately 4 dollars |
| 20-day | 89.34, price above by approximately 14 dollars |
| 50-day | 82.78, price above by approximately 20 dollars |
| 100-day | 81.86, price above by approximately 21 dollars |
| 200-day | 73.72, price above by approximately 29 dollars |
Price sits above every average in the stack and the averages are in correct ascending order from the 200-day upward, which is the canonical description of a fully aligned uptrend. No other instrument in tonight's package shows this configuration; the two equity index contracts sit beneath most of their averages and gold beneath all but one.
The practical consequence is that there is no moving-average resistance anywhere above price. The nearest average is the 5-day at 98.89, roughly 4 dollars beneath, and it would be the first trend reference to break on a decline. The distance from price to the 20-day at 89.34, roughly 14 dollars or 3.5 average true ranges, quantifies how extended this move has become and is the principal argument for reduced size rather than for fading the trend.
2.5 Oscillator and Trend Readings
This is the section that most distinguishes this instrument.
Relative strength is elevated: 80.62 on the 9-day, 76.30 on the 14-day, and 71.91 on the 20-day. The 14-day figure rose 2.56 points on the session. Readings above 70 are conventionally regarded as extended.
Stochastic readings are near the top of their range. The 14-day raw stochastic is 93.44 percent with %K at 89.77 percent and %D at 90.82 percent; the 9-day raw reading is 91.11 percent and the 20-day is 93.44 percent. The 50-day raw reading is 95.56 percent. Price is at the top of every lookback window simultaneously.
Trend strength is genuine and is the reason the extended oscillators should not be read as a reversal signal on their own. The 9-day directional index reads 45.17 and the 14-day reads 30.69, with positive directional movement at 36.53 against negative at 9.31 on the 14-day window. A directional index above 25 confirms a definable trend, and above 40 on the 9-day window indicates a strong one. The ratio of positive to negative directional movement of roughly 3.9 to 1 is decisive. In a confirmed trend of this strength, extended stochastic readings are a characteristic of the trend rather than a warning against it, and they can persist for extended periods.
Historic volatility is the highest in the package at 39.16 percent on the 14-day window, against 36.87 percent on the 9-day and 36.70 percent on the 20-day.
2.6 Volatility and Expected Range
Average true range measurements show clear expansion:
| 9-day | 4.18 dollars, 4.07 percent |
| 14-day | 3.92 dollars, 3.81 percent |
| 20-day | 3.77 dollars, 3.67 percent |
| 50-day | 3.45 dollars, 3.36 percent |
Average daily range: 4.29 on the 9-day, 3.98 on the 14-day, 3.51 on the 20-day.
The ordering is the inverse of a compressing market: the 9-day exceeds the 14-day, which exceeds the 20-day, which exceeds the 50-day. Realized volatility has expanded roughly 21 percent from the 50-day baseline to the 9-day measure. This is consistent with a supply shock repricing and it has direct sizing implications.
At 3.81 percent, the 14-day average true range is roughly 4.10 times the broad equity index contract's 0.93 percent. With a point value of 1,000 dollars per contract, a single average-range session represents approximately 3,920 dollars of movement per contract.
No options-derived implied move was captured for this contract in this run, so the average-range measurements above are the sole basis for the expected ranges in section 6.
Key Levels
Levels are quoted in the October contract domain. This instrument has no cash index against which a basis is measured, so no equivalents are given and none should be inferred.
3.1 Resistance
All resistance above 104.46 is mechanical rather than structural, since no price above that level has traded in the past year and there is therefore no prior activity to supply overhead interest. This is an important qualification: mechanical levels tend to offer less durable resistance than levels where positions were previously established.
The immediate references sit essentially at current price. The overnight session high at 103.44 and the first computed resistance at 103.51 are within seven cents of one another and form the immediate ceiling being tested. Above them, the 3-to-10-day moving-average crossover reference at 104.26, the first standard-deviation resistance at 104.30 and the 52-week high at 104.46 form a tight band of 20 cents width. That 104.26 to 104.46 band is the decisive line for this instrument: acceptance above it leaves no structural resistance whatsoever.
Beyond, the second standard-deviation resistance at 106.06 and the second computed resistance at 106.97 are the first objectives in open territory. The third standard-deviation resistance at 107.41, the 14-day relative strength upper band at 108.10 and the third computed resistance at 109.48 mark the extended range.
3.2 Support
The support structure beneath price is well populated, which is a favourable configuration for a trend-following long.
The 14-day stochastic stall reference at 102.63 and the overnight session low at 101.59 are the immediate references. The computed pivot point at 101.00 is the first significant level and is the anchor of the setup below.
Beneath it, the Friday settlement at 100.05 carries additional weight from the round number at 100.00, and the 14-3 day raw stochastic 80 percent reference at 99.49 sits just below. The Friday session low at 98.49 and the 14-day relative strength 70 percent reference at 98.68 form the next confluence, with the first computed support at 97.54 immediately beneath.
Below that, the first standard-deviation support at 95.80, the second computed support at 95.03, the 38.2 percent retracement from the four-week high at 94.97 and the second standard-deviation support at 94.04 are clustered between 94 and 96. The 9-day moving average sits at 94.45 within that band. The third computed support at 91.57 and the 50 percent retracement of the four-week range at 92.04 mark the lower boundary, and a decline to that area would represent a break of the trend structure rather than a pullback within it.
Macro Drivers
4.1 Dollar, Rates, and Fed Policy
The relationship runs in the opposite direction for this instrument compared with the other three, and the causality is worth stating precisely: crude is currently driving policy expectations rather than responding to them.
Commentary published Sunday at 05:01 PM ET stated that the week's oil price surge sharply raised the odds of a rate increase at the September 16 meeting. Market-implied odds moved into the mid-to-high eighties following Friday's consumer price data, with intraday snapshots at 85, 86 and 88 percent. August core consumer prices printed 0.3 percent month over month against a 0.2 percent expectation, and an energy-driven headline impulse feeds directly into that measure over subsequent months.
The dollar index rose 0.06 percent on Friday. A firmer dollar is conventionally a mild headwind for dollar-denominated commodities, but that channel is presently subordinate to the supply channel by a wide margin. A 26 percent one-month advance is not a currency effect.
The second-order risk is demand destruction transmitted through policy. If the policy response to an energy-driven inflation impulse is sufficiently restrictive, the resulting growth impulse is negative for crude demand. That is the mechanism behind the recession-fear commentary published Sunday, and it is the principal medium-term threat to this trend, though it operates over quarters rather than sessions.
4.2 Large-Cap Leadership and Earnings
Not applicable in the conventional sense. This contract has no earnings channel.
The relevant analogue is refining and downstream capacity. Reporting Friday at 04:31 PM ET indicated the White House is weighing use of the Defense Production Act to add refining capacity, with United States refineries described as maxed out. That is a notable signal: it indicates the constraint is being felt in product markets and not only in crude, and administrative intervention of that kind is typically considered only when the constraint is expected to persist.
No first-order corporate reports fall on Monday.
4.3 Geopolitical Backdrop
This is the first-order driver and it is the substance of this review.
The active conflict between the United States and Iran has been removing supply. Recent developments in sequence: a Saudi Aramco refinery was struck in early September; explosions were reported on Iran's Kharg Island on September 8, which is the principal Iranian export terminal; two vessels were struck by unidentified projectiles near Oman on Thursday, presumed by reporting to be Iranian action; Iran stated earlier in the week it is ready for a more intense conflict and will escalate.
The weekend flow points to entrenchment rather than resolution. Saudi Arabia's foreign ministry stated Friday at 04:09 PM ET that it had chosen not to retaliate at that stage following a request from Iraq's prime minister. Saudi Arabia attributed a pipeline attack to drones originating from Iraq, reported at 04:47 PM ET Friday. The Secretary-General of the Gulf Cooperation Council stated at the same time that Iraq must take firm measures to prevent attacks. Iraq stated it rejects attacks threatening Saudi security and has ordered an investigation. Iran's foreign ministry stated its strikes targeted the source of attacks rather than countries, and indicated that states backing an adverse international atomic agency resolution would face consequences. Reporting Saturday at 07:01 PM ET indicated that producers, traders and refiners are bracing for a prolonged conflict. A regional meeting scheduled for Monday in Salalah, Oman was postponed Sunday at 03:06 PM ET, described as being in the interest of consensus.
The one mitigating data point is that the Houthi spokesperson stated on September 10 that freedom of navigation in the Red Sea and the Bab el-Mandeb Strait remains safe and uninterrupted. That limits the disruption to the Gulf itself rather than extending it to the secondary chokepoint.
The postponement of Monday's regional meeting is the single most relevant weekend item for Monday's session. A diplomatic track that was scheduled to convene will not convene, and the most coherent explanation for the Sunday advance of roughly 3 percent is the removal of that near-term de-escalation possibility.
4.4 Sector Breadth and Rotation
The relevant cross-sectional read is the relationship between crude grades and refined products. October gasoline closed down 2.53 percent on Friday against crude's 2.37 percent decline, a marginally larger fall, which does not indicate product-led strength on that session. Brent was reported trading a touch above 104 dollars on Friday evening.
A full product-crack and grade-spread assessment was not captured in this run and no broader energy-complex breadth reading is offered. That absence is stated rather than filled.
4.5 Cross-Asset and Volatility
Crude is the source of the cross-asset impulse this weekend rather than a recipient of it, which reverses the usual framing in these reviews.
The transmission is visible across the package. Equity index futures are lower across the Sunday reopen, with the broad market contract down 0.48 percent and the technology contract down 1.27 percent, while crude is higher by roughly 3 percent. Friday's equity advance had been explicitly attributed to crude's 2.4 percent decline easing inflation concerns; that support has been withdrawn and equities have repriced accordingly. Gold is lower by 0.79 percent despite the geopolitical escalation, because the same crude impulse raises expected policy rates and therefore the opportunity cost of holding a non-yielding asset.
The coherent single explanation for all four instruments' weekend behavior is the crude reversal and its implication for the policy path. That consistency raises confidence in the read on this instrument specifically, since it is the only one of the four whose move requires no additional explanation.
The equity volatility index closed at 15.84 on Friday, down roughly 11 percent. That reading was established before the crude reversal and should be treated as stale.
4.6 Institutional Positioning
Positioning data for this contract is thinner than for the equity index instruments and is set out with that limitation stated.
Open interest in the October contract stands at 177,992 against overnight volume of 17,168. The overnight volume is substantial relative to the equity index instruments' thin reopens, which lends more weight to the Sunday advance than a comparable move in those contracts would carry.
The weighted alpha reading of positive 81.41 is the highest in the package by a wide margin and quantifies the strength of the one-year risk-adjusted advance. The relative strength reading of 76.30 rose 2.56 points on the session.
Weekly commitment data for the week ended September 8 was published Friday afternoon and included a crude-specific breakdown. The detailed long and short figures for this contract were not captured in this run, so no commitment-of-traders assessment is offered. That is a gap in this edition and is stated rather than estimated. It is a material gap for this instrument specifically, because speculative length in a trending commodity is the primary indicator of crowding risk, and its absence means this review cannot assess how extended positioning has become.
Options Flow Context
This run uses price structure, the computed pivot ladder, standard-deviation bands, the moving-average stack and the trend and volatility matrix as the analytical basis for this contract. That choice is stated affirmatively: these are the datasets captured and confirmed for this instrument in this run, and the level map in section 3 is built entirely from them.
The dealer-positioning stack available for the equity index instruments, comprising modeled gamma-flip levels, modeled volatility thresholds, call side ceilings and put side support bases, has no counterpart captured for this contract in this edition. No positioning level appears anywhere in section 3, and no inference about dealer hedging behavior is drawn for this instrument. Readers accustomed to that section carrying a positioning stack should note its deliberate absence here rather than assume it was omitted in error.
The practical consequence for the setup in section 8 is that its levels rest on price structure and mechanical computation alone. This is a weaker evidentiary base than the equity index setups in tonight's package, which are corroborated by independent positioning data, and it argues for treating the invalidation level with more discipline rather than less, since there is no second dataset to contradict a price-structure signal.
One structural observation can be made without positioning data. Because 104.46 is the highest price in 52 weeks, any options exposure struck above that level was established out of the money and would gain delta rapidly on a break higher. That is a general property of a market at annual highs rather than a measured reading of this market, and it is offered as context rather than as evidence.
Forecast
Scenario weightings below represent discretionary analyst judgment. They are not statistically derived and carry no calibration.
Night Session (6:00 PM ET Sunday, September 13 to 3:00 AM ET Monday, September 14, Globex/Asia)
Bias is positive. The session has advanced progressively rather than gapping and stalling, with successive reads at 102.81 and then 103.31 through the evening. Price is testing the first computed resistance at 103.51 and the overnight high at 103.44.
The principal catalyst is any further Gulf development. Asian trading hours have historically been responsive to Gulf headlines given regional proximity and refining exposure.
Expected range for the remainder of the window: 102.20 to 104.50.
London Session (3:00 AM to 8:00 AM ET Monday, September 14)
Bias is positive to neutral. London carries the bulk of physical crude dealing and Brent price discovery, and this window typically sets the day's directional tone for the grade. The European calendar carries only Swedish inflation at 02:00 AM ET, which is not a driver.
The decisive question for this window is whether the 104.26 to 104.46 band is tested. Given the progressive overnight advance, a test during London hours is likely.
Expected range: 102.00 to 105.20.
Morning Session (9:30 AM to 12:00 PM ET Monday, September 14, RTH Open)
Bias is positive while price holds above the computed pivot at 101.00.
There are no scheduled United States economic releases on Monday and no energy-specific data. This contract's regular-hours window opens at 8:00 AM CT, which is 9:00 AM ET, ahead of the equity cash open at 09:30 AM ET.
The level map is straightforward. Acceptance above 104.46 leaves no structural resistance and opens 106.06 and 106.97. Rejection there sets up the pullback that the setup in section 8 is designed to capture, toward 101.00.
Expected range: 101.50 to 105.50.
Afternoon Session (12:00 PM to 4:00 PM ET Monday, September 14)
Bias is neutral. This contract settles at 1:30 PM CT, which is 2:30 PM ET, so the final 90 minutes of this window, roughly 37 percent of it, fall after settlement with reduced liquidity. Behavior into the settlement is the portion that matters.
A settlement above 103.51 would confirm the first computed resistance has been overcome and would place the 52-week high in play for Tuesday. A settlement beneath 101.00 would indicate the Sunday advance has been rejected and would shift focus to the 98.49 to 99.49 confluence.
Expected range: 101.20 to 104.80.
Night Session Forward (6:00 PM ET Monday, September 14)
Residual bias depends on Monday's settlement relative to the pivot at 101.00. Chinese industrial output, retail sales, unemployment and urban investment arrive at 10:00 PM ET with an accompanying press conference. China is the largest crude importer, so a materially weak activity set carries a direct demand-side implication for this contract, more so than for any other instrument in tonight's package.
Expected Range (Monday, September 14 Full Session)
| Low-range scenario | ** 101.80 to 104.50 |
| Mid-range scenario (most likely) | ** 101.00 to 105.20 |
| High-range scenario | ** 99.50 to 107.00 |
The mid-range scenario spans 4.20 dollars, which is approximately 1.07 times the 14-day average true range of 3.92 dollars. That is a fuller assumption than the ranges assigned to the other instruments in tonight's package, reflecting confirmed trend strength, expanding realized volatility and an active headline driver, none of which the other three carry. The high-range scenario spans 7.50 dollars, approximately 1.91 average true ranges, and would require either a significant escalation or a decisive rejection at the annual high.
Most Likely Path
The most probable sequence sees the 103.44 to 103.51 immediate ceiling overcome during the Asian or London window given the progressive character of the overnight advance, followed by a test of the 104.26 to 104.46 band. That band is the session's decisive event. Given the absence of any structural resistance above it, a first test is more likely to produce a sharp rejection than a clean break, since the level is defended by the psychological weight of an annual high rather than by positioning. Price then pulls back through the United States morning toward the 101.00 to 102.00 area, which is where the setup below engages. A decisive break above the annual high is more likely to require Wednesday's inventory data or a fresh escalation headline as a catalyst than to occur on a Monday without scheduled data.
Monday Economic Calendar
The Monday calendar carries nothing of first-order relevance to this instrument. Direction will be set by Gulf headlines and by the momentum of the Sunday advance.
The overnight Asian window carries no scheduled releases ahead of the London open. Swedish consumer prices arrive at 02:00 AM ET and are not a driver. Canadian consumer prices and manufacturing sales arrive at 08:30 AM ET, with consumer prices year over year forecast at 3.1 percent against a 3.0 percent prior; Canada is a significant crude exporter, so these carry marginal second-order relevance through the Canadian dollar, but they are not a driver of the grade.
There are no scheduled United States economic releases and no energy inventory data on Monday. The Treasury auctions 13-week and 26-week bills at 11:30 AM ET, routine short-dated bill operations with no relevance to this contract.
The single scheduled item of note is the regional meeting in Salalah, Oman that was to convene Monday and has been postponed. Its absence is the relevant fact rather than its content.
The remainder of the week contains the events that matter. Chinese industrial output, retail sales, unemployment and urban investment arrive at 10:00 PM ET Monday, carrying direct demand-side relevance for the largest importer. Tuesday brings New York regional manufacturing at 08:30 AM ET and a 20-year Treasury auction at 01:00 PM ET. Wednesday is the pivotal session for this instrument as well as for the others: United States retail sales and import and export prices at 08:30 AM ET, crude oil inventories at 10:30 AM ET, forecast at a 1.35 million barrel draw against a prior draw of 0.391 million, followed by the policy rate statement and projections at 02:00 PM ET and the press conference at 02:30 PM ET. A draw materially larger than forecast, arriving into a confirmed uptrend with a supply-driven narrative, would be the most likely catalyst for a decisive break of the annual high. Thursday carries the Bank of England decision at 07:00 AM ET and United States jobless claims at 08:30 AM ET.
The implication for Monday is that the week's two genuine catalysts for this contract, the Chinese activity data Monday evening and the inventory report Wednesday morning, both fall after Monday's settlement. A position established Monday will be carried into both.
Primary Trade Setup
Direction: Long
Rationale: This is the only instrument in tonight's package with a confirmed trend, with a 14-day directional index of 30.69 and positive directional movement exceeding negative by roughly 3.9 to 1. Price trades above every moving average in the stack, support beneath is well populated, and the supply-driven narrative was reinforced across the weekend by the postponement of the Monday regional meeting and by reporting that the industry is preparing for a prolonged conflict. The setup is a pullback entry within a confirmed trend rather than a breakout chase at the annual high.
Entry Zone: 101.00 to 102.00, on a pullback into the computed pivot point and the overnight session low area
Stop Loss: 99.40, beneath the Friday settlement at 100.05, beneath the round number at 100.00 and beneath the 14-3 day raw stochastic 80 percent reference at 99.49, so the stop sits below the full band of nearby references rather than inside it
Target 1 (T1): 104.46, the 52-week high and Friday session high
Target 2 (T2): 106.97, the second computed resistance and the first objective in open territory
Target 3 (T3, extended): 109.48, the third computed resistance, requiring a fresh escalation or a materially larger than forecast inventory draw on Wednesday
Risk-to-Reward: Approximately 1:1.41 to T1, 1:2.60 to T2 and 1:3.80 to T3, measured from the 101.50 midpoint of the entry zone against the 99.40 stop
Invalidation: Sustained acceptance beneath 99.40, defined as two consecutive 30-minute closes below that level. That breaks the Friday settlement, the round number and the stochastic reference simultaneously, and would indicate the Sunday advance has been fully rejected, shifting focus to the 97.54 computed support and then the 94 to 96 band.
Macro override: A genuine de-escalation, meaning a rescheduled and convened regional meeting producing a concrete agreement, or a verified restoration of disrupted export capacity, invalidates the supply thesis irrespective of price structure. A second override is a materially weak Chinese activity set at 10:00 PM ET Monday, which would introduce a demand-side counterweight from the largest importer.
Position sizing note: Reduced size, and for two independent reasons. First, volatility: the 14-day average true range is 3.81 percent, roughly 4.10 times the broad equity index contract's 0.93 percent, and with a 1,000 dollar point value a single average-range session represents approximately 3,920 dollars of movement per contract. Second, evidentiary base: as set out in section 5, this setup rests on price structure and mechanical computation alone, with no positioning dataset to corroborate it, which is a weaker foundation than the equity index setups in tonight's package. Momentum readings are also extended, with the 14-day raw stochastic at 93.44 percent, and while extended readings are characteristic of confirmed trends rather than contrary to them, they do reduce the margin for error on entry timing.
Sources and methodology
This piece is built from this desk’s own session review for the contract, prepared on the evening of Sunday September 13, 2026, and refreshed against live pre-market data at 8:15 AM ET on Monday September 14. The last completed regular-hours session was Friday September 11. The computed pivot ladder is reconstructed from that session’s high, low and settlement. The moving-average stack, oscillator matrix and volatility measurements are read from the same session and are labelled as Friday readings wherever they appear against a live price.
Monday figures marked as live were read at 8:15 AM ET and reconciled against Friday’s settlement before use. Contract domains are kept separate throughout: a cash index level is never set against a futures level without the basis being stated, and dashboard headers quoting spot metal or the cash index are not treated as futures quotes. Dealer-positioning figures are taken from the options flow dataset captured this morning and are dated where the provider dates them.
Gaps in this edition, recorded rather than estimated: no options-derived implied move; no dealer-positioning dataset; no commitment-of-traders breakdown, which is material for a trending commodity because it is the primary crowding indicator; and no product-crack or grade-spread breadth assessment. No level in section 3 rests on any of these gaps.
Scenario weightings reflect discretionary analyst judgment. They are not statistically derived and carry no calibration.
Every level above is published before the session, not after it. Our performance statement shows how the graded levels have resolved over time.
Daily reviews for ES, NQ, GC and CL go out before each session. See what is included.



