
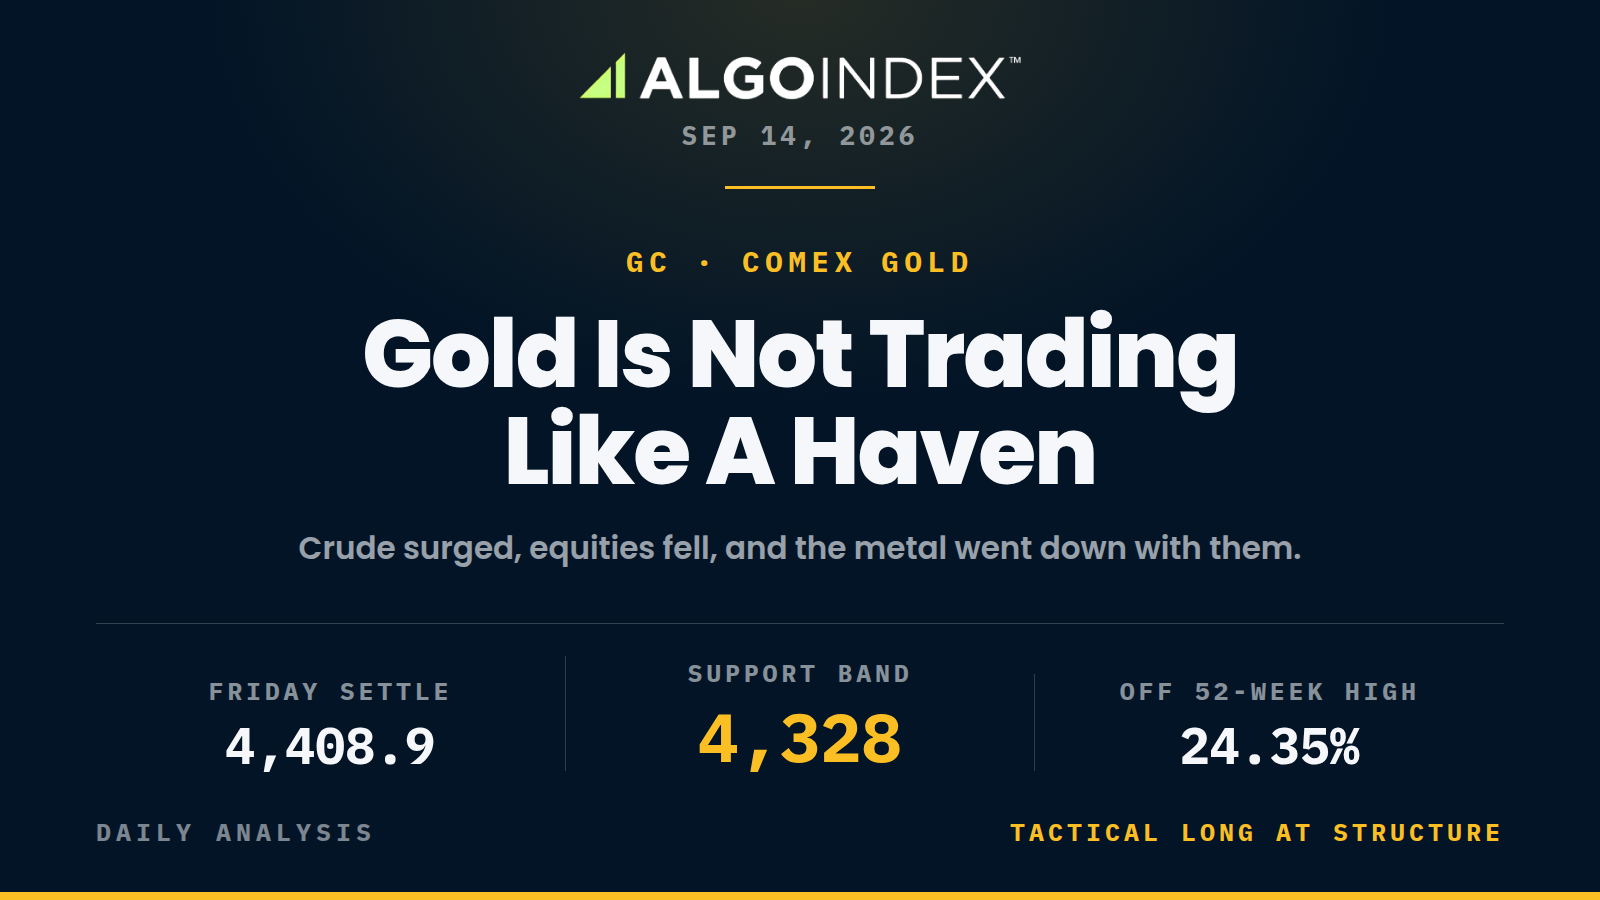
By late Sunday afternoon the setup had already contradicted itself. Crude was higher by roughly 3 percent on an intensifying Gulf conflict, a regional meeting scheduled for Monday in Salalah had been postponed at 03:06 PM ET, and equity index futures were lower. The December gold contract sat near 4,374, down 34.7 dollars, or 0.79 percent, from Friday's 4,408.9 settlement. Every ingredient of a haven bid was on the table. Gold refused it.
That refusal is the most useful thing in the weekend's data, and it describes behavior rather than price. August core consumer prices printed 0.3 percent month over month against a 0.2 percent expectation, and market-implied odds of an increase at the September 16 meeting climbed into the mid-to-high eighties from roughly 69 to 75 percent beforehand. Gold pays no coupon, so a rising real yield charges rent on owning it. The policy channel is overwhelming the haven channel right now, and Gulf headlines should not be assumed to lift this contract into Monday.
So the trade has to come from structure, and only one piece of structure earns the risk. A long scaled from 4,328 to 4,346, stop at 4,315, first objective 4,375.5. It is taken against the prevailing macro, on purpose, with size cut hard. This is not a call that gold has bottomed; it is a tactical mean reversion at defined structure inside a downtrend.
Updated at 8:15 AM ET Monday. The December contract trades 4,336.10, lower by 1.65 percent against Friday’s 4,408.90 settlement. That places it about three dollars above the top of the 4,328 to 4,333 band this piece is built around, so the band is intact, the 4,315 invalidation is untouched, and price has arrived at the zone rather than broken it. One caution worth stating plainly, because it is easy to get wrong: the spot metal quote of 4,293.85 that appears on dealer dashboards is not this contract. Volatility is 17.62, higher by 10.75 percent, and crude is higher by 3.04 percent at 103.09, which is the same combination the piece below describes as pressuring the metal through the policy channel rather than supporting it through the haven channel.
Three references inside 4.7 dollars
The 50-day moving average sits at 4,328.3. The one-month low, printed September 2, sits at 4,329.2. Friday's session low, printed nine sessions later, sits at 4,333.0. This desk's review identified that 4,328 to 4,333 band, where those three references converge within 4.7 dollars, as the last dense support before a 30 dollar gap, and the map behind the call is easy to check. Beneath the band the next reference is the 38.2 percent retracement from the 13-week low at 4,298.1. Then 4,283.7. Then 4,234.4. Nothing occupies the space in between.
Price is also leaning on that 50-day harder than most traders realize. Against the overnight quote near 4,376, the contract trades beneath the 5-day at 4,419.0, the 20-day at 4,516.7, the 100-day at 4,428.6 and the 200-day at 4,648.4. It sits above one average only, and that average happens to coincide with two tested session lows. The 200-day is 272 dollars overhead, which measures how far this metal has fallen from its longer-term mean. Over six months the contract is lower by 831.5 dollars, or 15.96 percent, and it trades 24.35 percent beneath the January 29 high of 5,781.8.
Look at the swing sequence and the compression becomes obvious. Highs step down from 5,195.9 on March 17 to 4,755.0 on August 25 to 4,488.8 on September 8, while lows climb from 4,015.6 on June 30 to 4,329.2 on September 2. The range is compressing. A sustained break beneath 4,328 ends that rising-low sequence outright, which is why the 4,315 stop sits under the whole confluence instead of inside it.
Rates are pricing this metal, and crude is making it worse
Friday's report cut two ways and the market picked the hawkish one. Headline inflation held at 3.4 percent year over year and core eased to 2.4 percent from 2.5 percent, a five and a half year low, but the 0.3 percent monthly core acceleration drove expectations. An increase Wednesday would be the first in three years. The dollar index rose 0.06 percent and the ten-year note yield closed slightly higher.
Now watch what crude is doing to the transmission. October crude settled Friday at 100.05, lower by 2.43 dollars after Thursday's 6.7 percent advance and after tagging a fresh 52-week high at 104.46 intraday. Across the reopen it has pushed back above 103. Commentary published Sunday afternoon tied the week's oil surge directly to the higher odds of a rate increase, and that chain is the whole problem for gold: firmer crude lifts headline inflation expectations, which lifts expected policy rates, which lifts the opportunity cost of holding a non-yielding asset. The inflation hedge is being punished by the inflation impulse. Equity volatility offers no help either, having declined roughly 11 percent Friday to close at 15.84, a level that does not describe the kind of systemic stress that produces a decisive haven bid.
Thin participation, amplifying positioning
Overnight volume stands at 8,784 contracts against open interest of 316,775. That is a whisper of participation, and it means Sunday's 34.7 dollar decline carries far less information than a regular-hours move of the same size would. Monday has not happened yet.
Dealer positioning adds a sharper edge. Options flow data on the principal gold exchange-traded fund shows an options impact of negative 492 million dollars as of the September 12 update, reflecting Friday's close. A negative reading means dealer hedging amplifies whatever direction develops. Pair that with the thin overnight window and any move that starts in low-participation hours has a higher chance of running than stalling.
Momentum readings argue the same direction as the support band. The 14-day and 20-day raw stochastics both read 11.67 percent, meaning price sits at the bottom of both lookback windows at once. Trend strength is modest, with the 14-day directional index at 19.53 and the negative component at 19.94 against a positive component of 15.97. Depressed, tilted lower, not yet turning.
Sizing is where this trade lives or dies. The 14-day average true range is 107.5 dollars, or 2.50 percent, roughly 2.69 times the broad equity index contract's 0.93 percent, and at a 100 dollar point value one average-range session moves about 10,750 dollars per contract. A counter-macro position in front of two rate events deserves a fraction of normal size. Our approach to risk per position and the results it produces are documented in the performance statement.
Monday offers structure and almost nothing else
The United States calendar is empty of scheduled economic releases. The Treasury does auction 13-week and 26-week bills at 11:30 AM ET, but those are short-dated bill operations and carry little weight through the real-yield channel. Canadian consumer prices and manufacturing sales at 08:30 AM ET matter only through the broad dollar complex. Swedish inflation at 02:00 AM ET matters not at all. The dollar sets the session, and the dollar will be set by positioning ahead of Wednesday.
The likely sequence is a drift lower through London toward the first computed support at 4,346.3, then a test of the 4,328 to 4,333 band around or shortly after the equity cash open, then a hold and a recovery toward the 40-day average at 4,375.5 into the 12:30 PM CT settlement. Mid-range expectation for the full session is 4,330 to 4,400, about 0.65 average true ranges, which is deliberately conservative. Targets run 4,375.5, then the computed pivot at 4,395.6, then Friday's 4,408.9 settlement, worth roughly 1:1.63, 1:2.50 and 1:3.08 against the 4,315 stop from the 4,338 entry midpoint.
Invalidation is defined and should be respected without argument: two consecutive 30-minute closes beneath 4,315. There is a second kill switch that has nothing to do with price. A materially firmer dollar, or a decisive rise in long-end yields around Tuesday's 20-year auction at 01:00 PM ET, ends the thesis regardless of where the contract is trading. Wednesday brings retail sales at 08:30 AM ET forecast at 0.9 percent against a negative 0.6 percent prior, then the policy statement and projections at 02:00 PM ET. Any position taken Monday should be sized on the assumption it gets carried into that. Traders who want the daily level maps and setups behind work like this can find subscription details on our pricing page.
Three references, 4.7 dollars apart, holding back a 30 dollar hole with a rate decision two days out.
The complete data picture
Every number behind the session, charted first, then the full level map, then the complete numeric reference underneath.
| Resistance, top down | Support, top down |
|---|---|
| 4,570.1Pivot R3, extended objective | 4,377.91 Standard Deviation Support |
| 4,516.720-day moving average | 4,375.540-day moving average, immediate intraday pivot |
| 4,507.5Pivot R2 | 4,365.12 Standard Deviation Support |
| 4,458.2Pivot R1 | 4,360.5overnight session low |
| 4,444.9Friday session high | 4,355.33 Standard Deviation Support |
| 4,428.6100-day moving average, upper edge of the overhead band | 4,346.3Pivot S1, upper boundary of the approach |
| 4,419.05-day moving average | 4,333.0Friday session low |
| 4,408.9Friday settlement, prior close magnet | 4,329.2one-month low |
| 4,395.6Pivot Point, lower edge of the overhead band | 4,328.350-day moving average, sole average beneath price |
| 4,385.350 percent retracement of the 13-week range | 4,298.138.2 percent retracement from the 13-week low |
Full numeric reference, every remaining figure from the session review
Executive Summary
The last completed session was Friday, September 11, where the December contract settled at 4,408.9, having traded a range of 111.9 dollars from 4,333.0 to 4,444.9. The close sat at 67.83 percent of that range. Over the trailing five sessions the contract is lower by 97.7 dollars, or 2.18 percent.
The dominant driver is monetary policy, and it is working against this metal. August core consumer prices printed 0.3 percent month over month against a 0.2 percent expectation, lifting market-implied odds of a rate increase at the September 16 meeting into the mid-to-high eighties from roughly 69 to 75 percent beforehand. The dollar index rose 0.06 percent on Friday and the ten-year note yield closed slightly higher. A confirmed increase, and more importantly any projection of a continued path beyond it, raises the real yield that constitutes the opportunity cost of holding a non-yielding asset.
The structural contradiction heading into Monday is the most instructive feature of this review, and it concerns behavior rather than price. Gold is not currently trading as a haven. Across the weekend reopen the December contract is lower by 34.7 dollars, or 0.79 percent, to trade near 4,374, while crude oil is higher by roughly 3 percent on an intensifying Gulf conflict and equity index futures are lower. In a conventional risk-off configuration driven by geopolitical escalation, gold would be bid alongside crude. It is not. The rate channel is dominating the haven channel, and until that changes, geopolitical headlines should not be assumed to support this instrument.
The longer-horizon context reinforces the point. The contract set its 52-week high at 5,781.8 on January 29 and trades 24.35 percent beneath it. Year to date it is lower by 118.5 dollars, or 2.63 percent.
The Primary Setup is a long from the 4,328 to 4,346 confluence, where the 50-day moving average, the one-month low and the Friday session low converge within five dollars, targeting a recovery toward the computed pivot and the Friday settlement, with invalidation beneath 4,315 and with the policy backdrop explicitly flagged as a headwind rather than a support.
## 1A. Monday Pre-Market Refresh (8:15 AM ET, 2026-09-14)
This section is an additive update captured at 8:15 AM ET on Monday, September 14, and it supersedes any figure below it that has since gone stale. Nothing in sections 2 through 9 has been rewritten or removed. That material remains the audited record of what was known when this review was prepared on Sunday evening, and where a number here conflicts with a number there, the number here governs.
Verified front month. GC1!, the COMEX Gold December '26 contract, trades 4,336.10, lower by 1.65 percent. Friday's settlement was 4,408.90, so the decline is 72.80 dollars. The arithmetic reconciles: 4,408.90 multiplied by 0.9835 gives 4,336.2, within a dime of the quoted price, and 72.80 divided by 4,408.90 is 1.65 percent. This is materially weaker than the Sunday reopen described in section 1, which had the contract near 4,374 and lower by 34.7 dollars. The decline has roughly doubled since that observation.
Domain caution. The options flow data publishes a header labelled "Gold" at 4,293.85, lower by 1.26 percent. That is spot metal, not the December futures contract, and the two must not be conflated. The instrument reviewed in this file is GC1!, the December COMEX futures contract, at 4,336.10, which is 42.25 dollars above spot this morning. The same dashboard's "^SPX" header at 7,607.45 is the cash equity index rather than the future, which is noted here only to establish that its headers are not futures quotes. Every level below states its domain.
Where the published setup actually stands. The 4,328 to 4,333 band that section 8 identifies as the operative confluence is intact. GC1! at 4,336.10 sits about 3 dollars above it. The stop at 4,315 is untouched. The setup is live and price is arriving at the zone rather than having passed through it, which is the condition the section 8 rationale was written for. The wider 4,330 to 4,346 entry band published in section 8 now contains current price at its upper portion.
What changed in the macro picture. Two items, neither of which appears in the Sunday analysis. First, the volatility index is 17.62, higher by 1.71 points or 10.75 percent, against Friday's close of 15.84. Any description in this file of a 15 handle on volatility is now stale. Second, a new catalyst: leading artificial intelligence companies are discussing a pause in development, and that is the attributed driver of this morning's technology underperformance, with the Nasdaq contract off roughly 150 basis points against 60 for the broad equity market. That is an equity-specific shock rather than a metals one, and it is worth recording precisely because gold is not responding to it. The behavioural point made in section 1 therefore holds and has strengthened: equity indices are lower, crude is higher with the October contract at 103.09 and up 3.04 percent, volatility is up nearly 11 percent, and gold is down 1.65 percent. The rate channel continues to dominate the haven channel. Traders price 86 percent odds of an increase on Wednesday, with the September 16 volatility expiry and policy decision and the September 18 quarterly expiration as the week's key dates.
Positioning data and the desk thesis. The dealer-positioning stack published this morning carries columns for the December broad-market future, the cash equity index, the broad-market exchange-traded fund, the Nasdaq cash index and its fund, and the small-cap index and its fund. It carries no column for gold and none for the metal's proxy vehicle, so there is no refreshed positioning reading for this instrument and the proxy-based observation in section 5 is not updated by this morning's capture. The desk's published thesis is an equity index one and is stated in the cash domain: pivot 7,590, bearish below and bullish above; resistance 7,625 and 7,700; support 7,600 and 7,350; below cash 7,600 the environment is described as pure negative gamma with 7,350 as the downside reference. Equity cash is 7,607.45 this morning. That bears on gold only through the cross-asset channel, and given the behaviour described above it should not be read as a haven bid for this contract.
Price Action & Technical Structure
2.1 Intraday and Session Review
Friday's December contract traded from 4,333.0 to 4,444.9, a range of 111.9 dollars, settling at 4,408.9. The close at 67.83 percent of range indicates buyers held the upper portion into settlement. The session low of 4,333.0 is significant beyond the day: it is also the five-day period low, set on that date.
The Sunday electronic reopen has given back a substantial portion of Friday's positioning. The contract opened at 4,375.0 and has traded between 4,360.5 and 4,388.8, marking roughly 34.7 dollars, or 0.79 percent, beneath the Friday settlement. This is an overnight repricing and not a regular-hours move, and it should not be characterized as Monday's direction, which has not yet occurred. Volume in the overnight window stands at 8,784 contracts against open interest of 316,775, so the move has occurred on thin participation and carries correspondingly less information than a regular-hours move of the same magnitude.
This contract settles at 12:30 PM CT, earlier than the equity index instruments, which means its settlement window and the equity complex's are not directly comparable and derived metrics should not be cross-read between them.
2.2 Daily Structure
The daily picture is a market that has been basing after a severe decline rather than trending. The one-month low of 4,329.2 was set on September 2 and the five-day low of 4,333.0 on September 11. Those two lows sit 3.8 dollars apart and were established nine sessions apart, which describes a tested and so far defended support area rather than a breaking one.
Above, the one-month high of 4,755.0 was set on August 25 and is also the 13-week high. The contract is lower by 58.4 dollars, or 1.32 percent, over one month, and higher by 78.5 dollars, or 1.83 percent, over three months.
The six-month and year-to-date figures supply the context that the shorter windows conceal. Over six months the contract is lower by 831.5 dollars, or 15.96 percent. Year to date it is lower by 118.5 dollars, or 2.63 percent, and it sits 24.35 percent beneath the January 29 high of 5,781.8. This is a market in a substantial correction that has been consolidating for roughly a month near the lower end of that correction.
2.3 4-Hour and Swing Structure
The swing sequence since the January high is a series of lower highs, with 5,195.9 on March 17, 4,755.0 on August 25, and 4,488.8 on September 8. The low sequence is 4,015.6 on June 30 followed by 4,329.2 on September 2, so lows have risen substantially while highs have fallen, describing a compressing structure.
The operative near-term question is whether the 4,328 to 4,333 area holds. It contains the one-month low at 4,329.2, the Friday session low at 4,333.0 and the 50-day moving average at 4,328.3 within five dollars of one another. A sustained break beneath it would end the rising-low sequence and open the 38.2 percent retracement from the 13-week low at 4,298.1 and then the second computed support at 4,283.7.
Retracement structure places the 50 percent level of the 13-week range at 4,385.3, which price is currently testing from beneath, and the 38.2 percent retracement from the 13-week low at 4,298.1.
2.4 Moving Averages
The stack against the current overnight quote near 4,376:
| 5-day | 4,419.0, price below by approximately 43 dollars |
| 20-day | 4,516.7, price below by approximately 141 dollars |
| 50-day | 4,328.3, price above by approximately 48 dollars |
| 100-day | 4,428.6, price below by approximately 53 dollars |
| 200-day | 4,648.4, price below by approximately 272 dollars |
This is a bearish stack with one exception that matters. Price sits beneath the 5-day, 20-day, 100-day and 200-day averages, and above only the 50-day. The 200-day at 4,648.4 is 272 dollars overhead, which quantifies how far this market sits below its longer-term mean.
The 50-day at 4,328.3 is therefore doing a great deal of work. It is the sole average beneath price and it coincides with the one-month low and the Friday session low. That coincidence is the single most important level relationship in this review and is the basis for the Primary Setup.
The 40-day average at 4,375.5 sits essentially at current price and is the immediate pivot for intraday behavior.
2.5 Oscillator and Trend Readings
Relative strength readings are soft: 39.23 on the 9-day, 45.04 on the 14-day, and 47.76 on the 20-day. The 14-day figure declined 2.11 points on the session.
Stochastic readings are deeply depressed. The 14-day raw stochastic is 11.67 percent with %K at 16.24 percent and %D at 21.30 percent; the 20-day readings are identical at 11.67 percent raw, which indicates price is at the bottom of both lookback windows simultaneously. The 9-day raw reading is 21.67 percent. These are levels associated with downside exhaustion rather than continuation, though they can persist and are not a timing instrument alone.
Trend strength is the highest of the four instruments reviewed in this package on the shorter window but still modest. The 9-day directional index reads 24.23 and the 14-day reads 19.53, with positive directional movement at 15.97 and negative at 19.94 on the 14-day. A 14-day reading beneath 20 sits at the boundary of a definable trend. The negative component exceeds the positive, supplying a downward tilt.
Historic volatility on the 14-day window is 20.31 percent, well above the equity index instruments and consistent with this contract's larger percentage ranges.
2.6 Volatility and Expected Range
Average true range measurements are notable for their uniformity:
| 9-day | 107.2 dollars, 2.40 percent |
| 14-day | 107.5 dollars, 2.50 percent |
| 20-day | 107.3 dollars, 2.50 percent |
| 50-day | 111.9 dollars, 2.60 percent |
Average daily range: 109.1 on the 9-day, 108.6 on the 14-day, 110.1 on the 20-day.
The near-identity of the 9-day, 14-day and 20-day measurements, all within 0.3 dollars of one another, indicates a market whose realized volatility has been stable rather than expanding or contracting. That is a different condition from the equity index instruments, where shorter windows sit beneath longer ones and describe compression.
At 2.50 percent, the 14-day average true range is roughly 2.69 times the broad equity index contract's 0.93 percent. Position sizing must reflect that, and the 100 dollar point value means a single average-range session represents approximately 10,750 dollars of movement per contract.
No options-derived implied move is available for this contract in the dataset captured. The exchange-traded fund proxy positioning discussed in section 5 does not publish an implied one-day move in the fields read, so the average-range measurements above are the sole basis for the expected ranges in section 6. That absence is stated rather than filled with an estimate.
Key Levels
Levels are quoted in the December contract domain. This instrument has no cash index against which a basis is measured, so no equivalents are given and none should be inferred.
3.1 Resistance
The immediate overhead structure is dense and begins effectively at current price. The 50 percent retracement of the 13-week range at 4,385.3 and the overnight session high at 4,388.8 are the first two references, both within 15 dollars of the current quote.
Above those, a substantial band runs from 4,395.6 to 4,428.6 and contains four separate references within 33 dollars: the computed pivot point at 4,395.6, the Friday settlement and prior-close magnet at 4,408.9, the 5-day moving average at 4,419.0, and the 100-day moving average at 4,428.6. This band is the principal barrier to recovery and is where a first attempt higher would be expected to stall.
Beyond it, Friday's session high at 4,444.9 and the first computed resistance at 4,458.2 mark the next tier, with the 14-day relative strength midpoint at 4,445.4 falling between them. The second computed resistance at 4,507.5 sits just beneath the 20-day moving average at 4,516.7, pairing a mechanical level with a trend reference. The third computed resistance at 4,570.1 is an extended objective requiring a catalyst, as is the 38.2 percent retracement from the 52-week low at 4,561.1 which sits immediately beneath it.
3.2 Support
The immediate support structure is thin between current price and the critical band, which is the main risk to the setup below.
The 40-day moving average at 4,375.5 sits essentially at current price. Beneath it, the first standard-deviation support at 4,377.9 is actually marginally above the 40-day, reflecting the compressed five-period distribution. The second standard-deviation support at 4,365.1, the overnight session low at 4,360.5 and the third standard-deviation support at 4,355.3 follow in close order.
The first computed support at 4,346.3 marks the upper boundary of the zone that matters. Beneath it lies the critical band: the Friday session low at 4,333.0, the one-month low at 4,329.2 and the 50-day moving average at 4,328.3, all within 4.7 dollars of one another. Three independent references, one of them a major trend average and two of them tested session lows nine days apart, make this the most defensible support on the map.
Below that band the structure deteriorates quickly and there is a substantial gap. The 38.2 percent retracement from the 13-week low at 4,298.1 is the next reference, roughly 30 dollars beneath the band. The second computed support at 4,283.7 and the third at 4,234.4 follow. Further down, the 14-day relative strength lower band at 4,043.3 and the 13-week low at 4,015.6 are distant.
The practical implication is that the 4,328 to 4,333 band is not merely the best support available; it is the last dense support before a 30 dollar gap. A failure there is likely to be disorderly rather than measured.
Macro Drivers
4.1 Dollar, Rates, and Fed Policy
This is the first-order driver and it is a headwind.
The August consumer price report released Friday at 08:30 AM ET delivered core at 0.3 percent month over month against a 0.2 percent expectation. Headline held at 3.4 percent year over year, unchanged from July and in line, while core eased to 2.4 percent year over year from 2.5 percent, a five and a half year low. The monthly core acceleration drove policy expectations; the annual core deceleration limited the damage to risk assets.
Market-implied odds of an increase at the September 16 meeting rose into the mid-to-high eighties, with intraday snapshots through Friday at 85, 86 and 88 percent, against roughly 69 to 75 percent beforehand. An increase would be the first in three years.
The transmission to this instrument is direct and runs through real yields. Gold pays no coupon, so its opportunity cost rises with the real yield. The dollar index rose 0.06 percent Friday on rate-differential grounds and the ten-year note yield closed slightly higher, having initially fallen on the crude decline before the inflation data reasserted itself. The combination of a firmer dollar and higher nominal yields against decelerating annual core inflation implies a rising real yield, which is the least supportive configuration for this asset.
A direct measurement of real yields was not captured in this run. The assessment above is inferred from the nominal yield direction, the dollar move and the reported inflation prints, and should be treated as inference rather than as a measured real-yield reading.
4.2 Large-Cap Leadership and Earnings
Not applicable to this instrument in the conventional sense. Gold has no earnings channel and no leadership cohort.
The relevant analogue is the relationship between this contract and equity risk appetite. Friday saw broad equity strength, with the broad market higher by 0.86 percent, and gold settled higher on the same session, so the two were not inversely related on Friday. Across the weekend reopen both equity index futures and gold are lower together while crude is higher. That joint decline is consistent with a rate-driven repricing affecting both asset classes through the discount-rate channel rather than a risk-on or risk-off rotation between them.
No first-order corporate reports fall on Monday. Mining equity flow, which occasionally leads this contract, was not captured in this run and is not assessed.
4.3 Geopolitical Backdrop
The active conflict between the United States and Iran is escalating in substance while the diplomatic wording has softened, and the striking feature of this review is how little support that has provided to gold.
Weekend developments. Saudi Arabia's foreign ministry stated Friday afternoon that it had chosen not to retaliate at that stage, following a request from Iraq's prime minister. Saudi Arabia attributed a pipeline attack to drones originating from Iraq. The Secretary-General of the Gulf Cooperation Council stated that Iraq must take firm measures to prevent attacks. Iraq stated it rejects attacks threatening Saudi security and has ordered an investigation. A regional meeting scheduled for Monday in Salalah, Oman was postponed Sunday afternoon at 03:06 PM ET, described as being in the interest of consensus. Iran's foreign ministry stated that its strikes targeted the source of attacks rather than countries, and indicated that several states backing an adverse international atomic agency resolution would face consequences. Reporting Saturday evening indicated the oil industry is preparing for a prolonged conflict.
This is an escalating conflict with a postponed diplomatic track. In a conventional configuration that combination is supportive of gold. Gold is nonetheless lower by 0.79 percent across the reopen while crude is higher by roughly 3 percent. The conclusion is that the policy channel is currently dominating the haven channel for this instrument, and that geopolitical headlines should not be assumed to provide support into Monday.
4.4 Sector Breadth and Rotation
Not directly applicable. The relevant cross-sectional read for this instrument would be the behavior of silver, platinum and the mining complex relative to gold, none of which was captured in this run. No breadth assessment is offered, and the absence is stated rather than filled.
4.5 Cross-Asset and Volatility
Crude oil is the dominant cross-asset story of the weekend and its relationship to gold is currently the informative one.
October crude settled Friday at 100.05, lower by 2.43 dollars or 2.37 percent, after Thursday's 6.7 percent advance and after setting a fresh 52-week high at 104.46 during Friday's session. Across the weekend reopen crude has advanced roughly 3 percent to trade above 103. Commentary published Sunday afternoon explicitly linked the week's oil surge to the increased odds of a rate increase, which describes the mechanism by which an energy shock is currently transmitting into a headwind for gold rather than a support: higher crude raises headline inflation expectations, which raises expected policy rates, which raises the opportunity cost of holding this metal.
That transmission is the opposite of the conventional inflation-hedge relationship and is worth stating plainly. In an environment where the central bank is expected to respond to an energy-driven inflation impulse by tightening, the metal trades off the policy response rather than off the inflation itself.
The equity volatility index declined roughly 11 percent Friday to close at 15.84. The dollar index rose 0.06 percent. Neither reading suggests the kind of systemic stress that historically produces a decisive haven bid.
4.6 Institutional Positioning
Positioning data for this instrument is thinner than for the equity index contracts and is set out with that limitation stated.
Open interest in the December contract stands at 316,775 against overnight volume of 8,784, the latter being a thin reopen figure that carries limited information.
The exchange-traded fund proxy discussed in section 5 shows a negative options impact figure of 492 million dollars as of the September 12 update, which reflects Friday's close. The sign indicates net dealer positioning that amplifies rather than dampens directional movement in that vehicle.
Futures positioning from the weekly commitment data was published Friday afternoon for the week ended September 8, and a gold-specific breakdown appeared in that release. The detailed long and short figures for this contract were not captured in this run, so no commitment-of-traders assessment is offered here. That is a gap in this edition and is stated rather than estimated.
Options Flow Context
This run uses the principal gold exchange-traded fund as the positioning dataset for this contract. That choice is stated affirmatively: it is the vehicle for which the options-flow source publishes a dealer-positioning dataset relevant to this metal, and it is the instrument through which much retail and institutional gold options exposure is expressed.
Readings are dated September 12, 2026 by the source and reflect Friday's close.
| Current price | 398.75 |
| Previous close | 398.77 |
| Daily change | negative 0.01 percent |
| Session volume | 10,733,039 shares |
| 52-week high | 509.70 |
| 52-week low | 332.97 |
| Options impact | negative 492 million dollars |
| Next-expiry gamma | 1.71 percent |
The 52-week range confirms the picture from the futures contract. The fund trades 21.8 percent beneath its 52-week high of 509.70 and 19.8 percent above its low of 332.97, placing it slightly nearer the low end of its annual range, consistent with the December contract sitting 24.35 percent beneath its own 52-week high.
A significant data-quality exclusion applies. The source publishes a high volatility point of 411 and a low volatility point of 451 for this fund. Those values are inverted, since the level labelled low sits 40 dollars above the level labelled high. This is a known rendering fault in this field. Both values are therefore excluded from the level map in section 3 and no inference is drawn from either. They are recorded here solely to document that they were read and deliberately discarded rather than overlooked.
The options impact figure of negative 492 million dollars is the usable positioning reading. A negative value indicates dealer hedging that amplifies directional movement rather than dampening it, which raises the expected magnitude of any move that develops in the underlying metal. Combined with the thin overnight futures volume noted in section 4.6, the practical implication for Monday is that moves initiated in low-participation windows carry a higher risk of extending than the same move would in a dampening environment.
No modeled gamma-flip level, modeled volatility threshold, call side ceiling or put side support base was captured for this vehicle in this run beyond the excluded volatility points. The dealer-positioning stack available for the equity index instruments has no complete counterpart here, and that asymmetry is stated rather than papered over. Section 3's level map is accordingly built from price structure, computed pivots, moving averages and standard-deviation bands alone, with no positioning levels incorporated.
Forecast
Scenario weightings below represent discretionary analyst judgment. They are not statistically derived and carry no calibration.
Night Session (6:00 PM ET Sunday, September 13 to 3:00 AM ET Monday, September 14, Globex/Asia)
Bias is negative, with the qualification that the session is well advanced on thin volume. The contract has traded 4,360.5 to 4,388.8 and sits near 4,376, beneath the 50 percent retracement of the 13-week range at 4,385.3.
Asian physical demand is a periodic support for this metal in this window but was not measured in this run. The principal catalyst is any incremental Gulf development, though as established in section 4.3 the haven channel is not currently transmitting.
Expected range for the remainder of the window: 4,355 to 4,392.
London Session (3:00 AM to 8:00 AM ET Monday, September 14)
Bias is neutral to negative. London is the centre of physical gold dealing and this window typically carries the session's most meaningful price discovery for this instrument. The European calendar carries only Swedish inflation at 02:00 AM ET, which is not a driver.
The dollar is the operative channel. A firmer dollar on rate-differential grounds applies direct pressure. Absent a dollar reversal, the window is likely to test the 4,355 to 4,365 area where the third standard-deviation support and the overnight low sit.
Expected range: 4,348 to 4,390.
Morning Session (9:30 AM to 12:00 PM ET Monday, September 14, RTH Open)
Bias is negative toward the critical band, constructive from it.
There are no scheduled United States economic releases on Monday. Canadian consumer prices and manufacturing sales arrive at 08:30 AM ET, which affect the Canadian dollar and marginally the broad dollar complex, so they carry second-order relevance here through that channel. The equity cash open at 09:30 AM ET sets the broader risk tone.
The level map for this window is clear. The first computed support at 4,346.3 is the upper boundary of the approach, and the critical band at 4,328 to 4,333 is the objective of any decline. A test of that band during this window is the most likely single event of the session, and the reaction to it determines the remainder.
Expected range: 4,330 to 4,388.
Afternoon Session (12:00 PM to 4:00 PM ET Monday, September 14)
Bias is neutral. This contract settles at 12:30 PM CT, which is 01:30 PM ET, so the majority of this window falls after settlement and carries reduced liquidity and reduced informational value. Behavior into the settlement is the portion that matters.
A settlement above 4,375.5, the 40-day moving average, would indicate the overnight decline has been rejected. A settlement beneath 4,346.3 would place the critical band directly in play for Tuesday, with the policy decision approaching.
Expected range: 4,332 to 4,382.
Night Session Forward (6:00 PM ET Monday, September 14)
Residual bias depends on Monday's settlement relative to the 4,346.3 computed support. Chinese industrial output, retail sales, unemployment and urban investment arrive at 10:00 PM ET with an accompanying press conference. Chinese physical demand is a material component of global gold consumption, so a materially weak Chinese activity set carries a second-order negative implication for this contract beyond its general risk-sentiment effect.
Expected Range (Monday, September 14 Full Session)
| Low-range scenario | ** 4,350 to 4,400 |
| Mid-range scenario (most likely) | ** 4,330 to 4,400 |
| High-range scenario | ** 4,290 to 4,430 |
The mid-range scenario spans 70 dollars, which is approximately 0.65 times the 14-day average true range of 107.5 dollars. That is a deliberately conservative assumption reflecting the absence of any scheduled catalyst for this instrument on Monday and the thin pre-decision conditions. The high-range scenario spans 140 dollars, approximately 1.30 average true ranges, and would require a dollar reversal or a decisive break of the critical band.
Most Likely Path
The most probable sequence sees continued drift lower through the London window as the dollar holds its Friday gain, carrying price toward the 4,346.3 computed support during the European morning or shortly after the equity cash open at 09:30 AM ET. The critical band at 4,328 to 4,333 is then tested. Given three independent references within 4.7 dollars, including the 50-day moving average and two session lows established nine days apart, that test holds on a first attempt, and price recovers toward the 40-day average at 4,375.5 into the 01:30 PM ET settlement. A decisive break of the band is more likely to require the Wednesday policy decision as a catalyst than to occur on a data-light Monday.
Monday Economic Calendar
The Monday calendar carries nothing of first-order relevance to this instrument, and the session's direction will be set by the dollar and by positioning ahead of Wednesday.
The overnight Asian window carries no scheduled releases ahead of the London open. Swedish consumer prices arrive at 02:00 AM ET, with a prior monthly reading of negative 0.3 percent and a prior annual reading of 0.3 percent. These are not a driver for this instrument.
Canadian consumer prices and manufacturing sales arrive at 08:30 AM ET, with consumer prices year over year forecast at 3.1 percent against a 3.0 percent prior, consumer prices month over month forecast flat against a 0.5 percent prior, core consumer prices with a 2.3 percent prior annual reading, and manufacturing sales forecast at negative 0.2 percent against a 0.1 percent prior. These carry second-order relevance through the broad dollar complex only.
There are no scheduled United States economic releases on Monday. The Treasury auctions 13-week and 26-week bills at 11:30 AM ET, and because those are short-dated bill operations rather than a long-duration event they carry little relevance through the real-yield channel.
The single first-order variable for this instrument on Monday is the dollar's behavior in the absence of data, which will be driven by positioning ahead of Wednesday.
The remainder of the week is what governs appropriate size. Chinese industrial output, retail sales, unemployment and urban investment arrive at 10:00 PM ET Monday, carrying physical-demand relevance. Tuesday brings German economic sentiment at 05:00 AM ET forecast at 40.2 against a 34.2 prior, New York regional manufacturing at 08:30 AM ET forecast at 14 against a 20.60 prior, and a 20-year Treasury auction at 01:00 PM ET. That auction is a direct long-duration rate event and is therefore materially relevant to this instrument through the real-yield channel. Wednesday is pivotal: United States retail sales at 08:30 AM ET forecast at 0.9 percent against a negative 0.6 percent prior, import and export prices in the same 08:30 AM ET slot, then the policy rate statement and projections at 02:00 PM ET followed by the press conference at 02:30 PM ET. Thursday carries the Bank of England decision at 07:00 AM ET forecast unchanged at 3.75 percent and United States jobless claims at 08:30 AM ET forecast at 205,000.
The implication is direct. The two events that matter most for this instrument, the 20-year auction on Tuesday and the policy projections on Wednesday, both fall after Monday. A data-light Monday ahead of two consecutive long-duration rate events does not warrant full commitment, and any position established Monday should be sized on the assumption that it will be carried into a high-variance Wednesday.
Primary Trade Setup
Direction: Long
Rationale: The 4,328 to 4,333 band contains three independent references within 4.7 dollars: the 50-day moving average at 4,328.3, the one-month low at 4,329.2 and the Friday session low at 4,333.0. Two of those are tested session lows set nine sessions apart, and the 50-day is the sole moving average currently beneath price. Stochastic readings at 11.67 percent on both the 14-day and 20-day raw measures indicate price sits at the bottom of both lookback windows simultaneously. This is the last dense support before a 30 dollar gap to the next reference.
Entry Zone: 4,330 to 4,346, scaled across the band rather than at a single price
Stop Loss: 4,315, beneath the 50-day moving average at 4,328.3 and beneath the one-month low at 4,329.2, so the stop sits below the entire confluence rather than inside it
Target 1 (T1): 4,375.5, the 40-day moving average and the immediate intraday pivot
Target 2 (T2): 4,395.6, the computed pivot point and the lower edge of the overhead band
Target 3 (T3, extended): 4,408.9, the Friday settlement and prior-close magnet, requiring the 4,395.6 pivot to be cleared on expanding volume
Risk-to-Reward: Approximately 1:1.63 to T1, 1:2.50 to T2 and 1:3.08 to T3, measured from the 4,338 midpoint of the entry zone against the 4,315 stop
Invalidation: Sustained acceptance beneath 4,315, defined as two consecutive 30-minute closes below that level. That breaks the 50-day moving average and both tested session lows simultaneously and opens the 30 dollar gap toward 4,298.1 and then 4,283.7. Because the support beneath the band is sparse, a failure is likely to extend rather than stall.
Macro override: This setup is taken against the prevailing macro rather than with it, and that is stated explicitly. A policy path that implies continued increases beyond Wednesday raises real yields and is directly adverse to this position. Any material further strengthening of the dollar index, or a decisive rise in long-end yields around Tuesday's 20-year auction, invalidates the thesis irrespective of price structure. The setup is a tactical mean reversion at defined structure within a downtrend, not a directional view that gold has bottomed.
Position sizing note: Reduced size, and materially so. The 14-day average true range is 2.50 percent, roughly 2.69 times the broad equity index contract's 0.93 percent, and the 100 dollar point value means one average-range session represents approximately 10,750 dollars of movement per contract. The position is counter-macro, ahead of two long-duration rate events, with amplifying dealer positioning in the proxy vehicle.
Sources and methodology
This piece is built from this desk’s own session review for the contract, prepared on the evening of Sunday September 13, 2026, and refreshed against live pre-market data at 8:15 AM ET on Monday September 14. The last completed regular-hours session was Friday September 11. The computed pivot ladder is reconstructed from that session’s high, low and settlement. The moving-average stack, oscillator matrix and volatility measurements are read from the same session and are labelled as Friday readings wherever they appear against a live price.
Monday figures marked as live were read at 8:15 AM ET and reconciled against Friday’s settlement before use. Contract domains are kept separate throughout: a cash index level is never set against a futures level without the basis being stated, and dashboard headers quoting spot metal or the cash index are not treated as futures quotes. Dealer-positioning figures are taken from the options flow dataset captured this morning and are dated where the provider dates them.
Gaps in this edition, recorded rather than estimated: no options-derived implied move is available for this instrument; no real-yield measurement was captured, so section 4.1's real-yield assessment is labelled as inference; no commitment-of-traders breakdown for this contract was captured; no metals-complex breadth was captured; and the source's volatility-point fields were excluded as inverted. No level in section 3 rests on any of these gaps.
Scenario weightings reflect discretionary analyst judgment. They are not statistically derived and carry no calibration.
Every level above is published before the session, not after it. Our performance statement shows how the graded levels have resolved over time.
Daily reviews for ES, NQ, GC and CL go out before each session. See what is included.



