
By Sunday evening the September Nasdaq-100 contract had reopened at 28,997.75, a gap of 1.32 percent measured against Friday's settlement, and it spent the hours after that working a band between 28,981.00 and 29,111.00. Friday's session settled at 29,387.00, higher by 0.86 percent, and finished at 75.37 percent of its range. That reading is already worthless.
Roughly 372 points came out of this contract across the weekend reopen, 1.27 percent. The broad-market contract gave up 0.48 percent over the same window. Beta accounts for about 0.77 percent of the technology move, using the 1.6 ratio the average-true-range comparison supports. The remainder is the duration channel opening two days ahead of Wednesday's policy decision, now carrying 85 to 88 percent implied odds of an increase against 69 to 75 percent before Friday's inflation print. Monday decides whether regular-hours trade ratifies it.
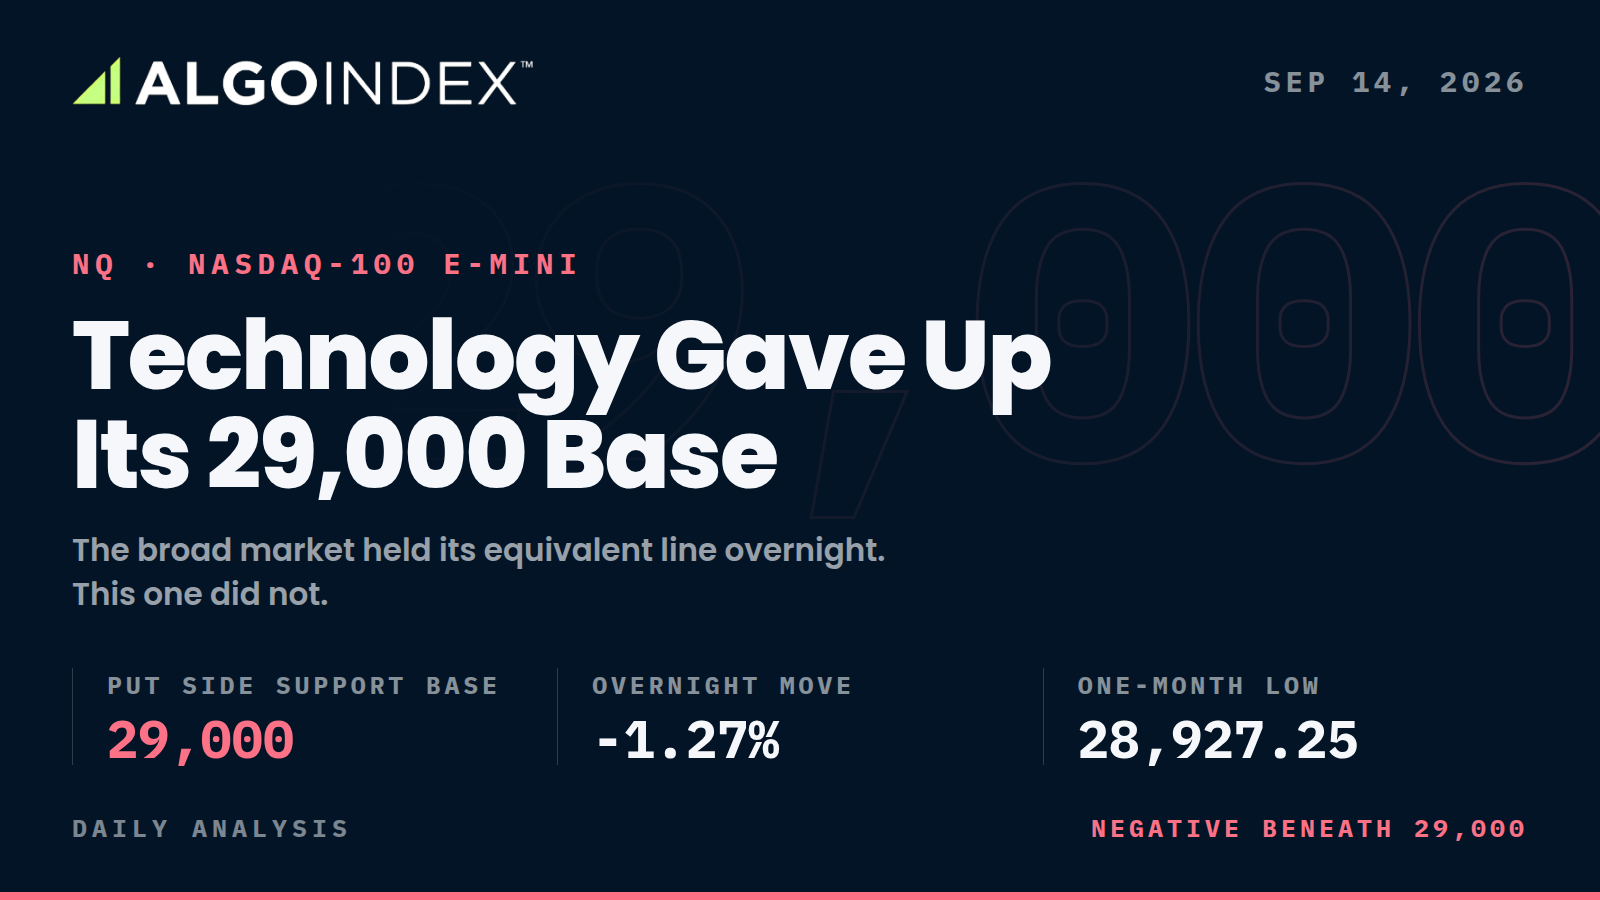
In our prior review we named the cash 29,000 put side support base as the operative line for this index. Overnight trade carried price beneath it.
Updated at 8:15 AM ET Monday. The September contract trades 28,912.75, lower by 1.61 percent, with cash at 28,891.97. Be precise about what that means for the setup below: price gapped straight through the 29,118 to 29,166 entry band at the Sunday reopen and has not returned to it, so the trade as published never triggered, even though the first target at 28,927.25 has since been reached. There is now a named driver for the underperformance that Sunday’s analysis could not have carried. Leading artificial intelligence companies are discussing a pause in development, and that, alongside crude at fresh highs, is what the institutional flow report attributes this morning’s technology selling to. Volatility is 17.62, higher by 10.75 percent. The dealer stack now publishes against the December contract at roughly a 71.55 point offset to cash; September stays the active options contract this week and expires Friday.
Four averages stacked into one wall
Price near 29,015 sits under the 5-day at 29,304.95, the 50-day at 29,308.51, the 100-day at 29,398.61 and the 20-day at 29,409.10. Those four compress into 104 points. They overlap the Friday settlement magnet at 29,387.00 and the computed pivot at 29,309.25, which turns the whole 29,300 to 29,410 area into one dense supply band holding five separate references. A recovery attempt has to chew through all of it in a single pass. Only the 200-day at 27,534.30 sits beneath price, by roughly 1,481 points.
The 40-day at 29,248.25 is the first reclaim that would mean anything. Price is close to 240 points below it.
Look at the swing highs and the direction settles itself: 31,100.00 on June 3, 30,343.00 on August 17, then 29,764.75 on September 8. Lows have held higher, 27,201.50 in July and 28,927.25 on September 2, so the structure has been compressing for a quarter and resolving down. Overnight trade came within 54 points of that September low. Price also sits beneath the 50 percent retracement of the 13-week range at 29,088.50.
One number settles it. Over three months this contract is lower by 939.75 points, 3.14 percent, while the broad-market contract remains positive across the same window. The long-horizon component of the composite trend read runs 67 percent sell here and 67 percent buy there. Relative strength on the 14-day window dropped 5.76 points Friday against 3.28 in the broad market.
The strike that stopped paying support
The dealer positioning stack for this index publishes in the cash domain only, anchored to the September 10 reference at 29,103. It puts the primary call side ceiling and the primary gamma concentration at the same value, 29,275, both listed strikes. The modeled volatility threshold sits at 29,250. The put side support base sits at 29,000.
That last one carries the session. Friday's cash close of 29,368.44 finished 368 points clear of it. The overnight low of 28,981.00 converts to roughly 28,962 in the cash domain on this session's measured basis, and the quote near 29,015 converts to about 28,996. Both print under the strike. Concentrated open interest at a listed strike supplies genuine dealer hedging support, and trading beneath it withdraws that support. The broad market held its equivalent structural line overnight. Technology did not.
Beneath price, the modeled gamma-flip level for this index sits at cash 28,811. Call it 185 points from the current cash equivalent, comfortably inside one 14-day average true range of 439.49 points. An ordinary session covers that distance.
Positioning underneath is mixed. Gamma notional for market makers reads positive 3.879 million dollars in the cash index and negative 758.979 million in the principal tracking fund, with gamma tilt at 1.143 against 0.674. Dealer hedging runs close to neutral at the index level and amplifies through the fund. Friday's index options volume ran 7,165 calls against 7,412 puts, near balance, while open interest stands at 88,342 calls against 111,872 puts. The 25-delta risk reversal reads negative 0.062, the firmest bid for downside protection across the indices we reviewed. This contract is cash-settled, with final settlement Friday, September 18, alongside a quarterly expiration that clears roughly 35 percent of total United States options exposure.
Crude took back what it handed over on Friday
Friday's equity advance was bought with a crude decline. October crude settled at 100.05, down 2.43 dollars or 2.37 percent, after running 6.7 percent higher Thursday and printing a 52-week high at 104.46 during Friday's session. The reversal followed an energy agency warning that elevated prices and restricted supply would drive the largest drop in global oil demand since the pandemic.
Across the weekend crude added 2.76 dollars, 2.76 percent, to trade near 102.81. Friday's decline is gone. The disinflationary impulse equities paid up for went with it.
Single-stock flow argued the other way on Friday. Total delta ran about positive 1.3 billion dollars, concentrated in the largest technology names, most of which closed higher. Two advanced roughly 2 percent each on substantial opening call purchases in October-dated contracts, and those options gained 27 and 22 percent on the session. Whatever got accumulated in that window is being marked down now.
The volatility reset went stale for the same reason. The volatility index fell about 11 percent Friday to 15.84, and fixed-strike volatility collapsed 3 to 4 points across tenors of two days or less. All of it happened before crude turned.
Monday's calendar offers nothing to change the subject. No United States releases are scheduled. Canadian consumer prices and manufacturing sales arrive at 08:30 AM ET, the Treasury sells 13-week and 26-week bills at 11:30 AM ET, and Chinese activity data lands at 10:00 PM ET, after the close. The cash open is the only first-order event on the day.
Where we are short, and what takes us out
This is a sell into strength. The entry zone runs 29,118 to 29,166, where the first computed support and the first standard-deviation support flip to resistance on a rally from beneath. Stop at 29,275. The placement is deliberate: it clears the 40-day average at 29,248.25, and it clears the futures equivalent of the cash 29,250 modeled volatility threshold, which converts to roughly 29,268.56 on this session's measured basis of plus 18.56 points.
First target is the one-month low at 28,927.25. Second is the second computed support at 28,849.50. Third, taken only if the modeled gamma-flip level gets traversed on expanding volume, is 28,658.50. Measured from the 29,142 midpoint against the 29,275 stop, risk to reward runs 1:1.61, 1:2.20 and 1:3.64. How we measure and report those figures is set out in our performance statement.
Three things kill the idea. A reclaim of cash 29,000, roughly 29,019 in this contract's domain, held through two consecutive 30-minute closes in regular-hours trade, marks the overnight break false and restores the dealer support sitting at that strike. A crude reversal back beneath 100.05 restores Friday's disinflationary impulse and undercuts the duration pressure the whole structure leans on. A pre-decision policy signal implying one move and no continued path does the same, and it would lift this index harder than any other.
Size down, further than a broad-market equivalent. The 14-day average true range here is 1.51 percent against 0.93 percent for the broad market, a ratio near 1.62, so equal dollar risk buys proportionally fewer contracts. We expect Monday to hold 28,880 to 29,180, and we expect an early recovery attempt into the 29,074 to 29,166 concentration to fail, because the supply band at 29,300 to 29,410 sits above it with no catalyst on the calendar to resolve it. Subscription details for traders following this desk are at algoindex.com.
That September low sits 54 points away, and nothing on Monday's calendar was built to defend it.
The complete data picture
Every number behind the session, charted first, then the full level map, then the complete numeric reference underneath.
| Resistance, top down | Support, top down |
|---|---|
| 30,037.75Pivot R3, extended objective | 29,304.955-day moving average |
| 29,769.00Pivot R2 | 29,248.2540-day moving average, first reclaim objective |
| 29,607.761 Standard Deviation Resistance | 29,166.241 Standard Deviation Support |
| 29,578.00Pivot R1 | 29,118.25Pivot S1 |
| 29,500.25Friday session high | 29,088.5050 percent retracement of the 13-week range |
| 29,409.1020-day moving average, upper edge of the compression band | 29,074.802 Standard Deviation Support |
| 29,387.00Friday settlement, prior close magnet | 29,004.633 Standard Deviation Support |
| 29,309.25Pivot Point, lower edge of the compression band | 28,981.00overnight session low |
| 28,927.25one-month low, operative structural line | |
| 28,849.50Pivot S2, downside objective on acceptance |
Full numeric reference, every remaining figure from the session review
Executive Summary
The last completed regular-hours session was Friday, September 11. The Nasdaq-100 cash index settled at 29,368.44, higher by 264.93 points or 0.91 percent, and the September E-mini contract settled at 29,387.00, an advance of 0.86 percent. Technology participated fully in Friday's broad relief move, which was driven by a 2.4 percent decline in crude oil rather than by a constructive inflation surprise. August core consumer prices rose 0.3 percent month over month against a 0.2 percent expectation, while core at 2.4 percent year over year eased to a five and a half year low.
The dominant driver for the week is the September 16 policy decision, where market-implied odds of a rate increase sit in the mid-to-high eighties following Friday's inflation data. Technology carries greater duration sensitivity than the broad market, so a confirmed move higher in policy rates and, more importantly, any projection of a continued path beyond Wednesday bears disproportionately on this index.
The structural contradiction heading into Monday is sharper here than in the broad market, and it is the defining feature of this review. Friday's contract settled at 75.37 percent of its session range, a firm close. The Sunday electronic reopen has erased that entirely: the contract opened at 28,997.75 and has traded between 28,981.00 and 29,111.00, marking roughly 372 points, or 1.27 percent, beneath the Friday settlement. That decline is roughly two and a half times the equivalent move in the broad-market contract over the same window, which is a genuine divergence rather than a proportional one. More consequentially, the overnight low of 28,981.00 corresponds to approximately 28,962 in the cash domain on this session's measured basis, which places it beneath the primary put side support base the options-flow source publishes at cash 29,000. The broad market held its equivalent structural line overnight; technology did not.
The Primary Setup is therefore a short into rallies toward the 29,118 to 29,166 band, targeting the one-month low and the second computed support, with invalidation on a reclaim of the cash 29,000 area in regular-hours trade.
## 1A. Monday Pre-Market Refresh (8:15 AM ET, 2026-09-14)
This section is an additive update captured at 8:15 AM ET on Monday, September 14, and it supersedes any figure below it that has since gone stale. Nothing in sections 2 through 9 has been rewritten or removed. That material remains the audited record of what was known when this review was prepared on Sunday evening, and where a number here conflicts with a number there, the number here governs.
Verified front month. NQ1!, the CME Nasdaq-100 E-mini September '26 contract, trades 28,912.75, lower by 1.61 percent. Friday's settlement was 29,387.00, so the decline is 474.25 points. The arithmetic reconciles: 474.25 divided by 29,387.00 is 1.614 percent, which rounds to the quoted 1.61 percent. The overnight low of 28,981.00 cited in section 1 has been broken, and price now trades beneath the full Sunday range of 28,981.00 to 29,111.00.
Domain caution. The options flow data publishes a header quoted as "^SPX" at 7,607.45, which is the cash index rather than the broad-market future, and a header labelled "Gold" at 4,293.85, which is spot metal rather than the December futures contract. Neither is a futures quote, and the same discipline applies to every technology reference in this section. The instrument reviewed in this file is NQ1!, the September Nasdaq-100 E-mini future, at 28,912.75. The cash index is at 28,891.97, lower by 478.23 points or 1.63 percent, so the contract trades 20.78 points above cash this morning against the plus 18.56 basis measured on Sunday. Conversions below are computed on the observed 20.78 and stated as such.
Where the published setup actually stands. It did not trigger. Section 8 published a short into rallies toward 29,118 to 29,166. That entry zone was never touched, because price gapped straight through it on the reopen and has traded beneath it since. Target 1 at 28,927.25 has been reached, but the trade as published never entered, so the target was reached without a position. This must be recorded as an untriggered setup and not as a winning one. The published invalidation, a reclaim of cash 29,000 held through two consecutive 30-minute closes in regular-hours trade, has not occurred: cash sits at 28,891.97, beneath that line. The stop at 29,275 was never in play.
What changed in the macro picture. Two items, neither of which appears in the Sunday analysis. First, the volatility index is 17.62, higher by 1.71 points or 10.75 percent, against Friday's close of 15.84. Any description in this file of a 15 handle on volatility is now stale. Second, and directly consequential for this instrument, a new catalyst: leading artificial intelligence companies are discussing a pause in development. The desk attributes this morning's technology pressure to those executive calls to slow artificial intelligence development combined with rising crude, and the flow report records volume spikes in three of the largest technology names. This is the reason the Nasdaq contract is off roughly 150 basis points against 60 basis points for the broad market, a divergence consistent with, but larger than, the one section 1 identified overnight. The October crude contract at 103.09 is higher by 3.04 percent. Key dates remain the September 16 volatility expiry and policy decision and the September 18 quarterly expiration, with traders pricing 86 percent odds of an increase on Wednesday.
Contract basis for the positioning data. The dealer-positioning stack for the broad market is now published against the December contract at a reference of 7,727.55, set against the cash index at 7,656, an offset of roughly plus 71.55. This review is written on September. September remains the active options contract by volume this week: the options flow data shows the September futures option at 132M of volume against 7.7M for December. September expires this Friday, September 18. The Nasdaq columns in that table are published on the cash index and on the exchange-traded fund, not on a futures contract, so they are converted here using the observed plus 20.78 cash-to-September basis stated above.
Updated positioning stack and the desk thesis. On the Nasdaq cash index the reference is 29,368, the modeled volatility threshold 29,270, the primary gamma concentration 29,500, the call wall 29,275, the put wall 29,000 and modeled gamma-flip level 28,856, with gamma tilt 1.401, gamma notional $12.534M and a 25 delta risk reversal of minus 0.051. Call volume is 5.999K against put volume 11.063K, and call open interest 86.761K against put open interest 112.516K. Converted on the plus 20.78 basis, the cash put wall of 29,000 is approximately 29,020.8 in this contract's domain, cash modeled gamma-flip level of 28,856 approximately 28,876.8, and the cash call wall of 29,275 approximately 29,295.8. Cash at 28,891.97 therefore sits roughly 36 points above the cash modeled gamma-flip level reference and 108 points beneath the cash put wall, which is the operative tension this morning. Key cash strikes are 29,500, 29,275, 29,000 and 30,000, with published combination levels at 29,280, 28,752, 28,341 and 29,985. On the principal tracking fund the reference is 714, modeled volatility threshold 716, primary gamma concentration 720, call wall 720, put wall 700 and modeled gamma-flip level 718, with gamma tilt 0.750 and gamma notional of minus $585.125M. The desk's published thesis is stated on the broad-market cash index rather than on technology: pivot 7,590, bearish below and bullish above; resistance 7,625 and 7,700; support 7,600 and 7,350. Below cash 7,600 the environment is described as pure negative gamma, with 7,350 the downside reference if 7,600 gives way, and the desk states it is looking to add short exposure if cash breaks 7,590. Broad-market cash is 7,607.45 this morning, so that pivot is 17.45 points beneath spot and the 7,600 support 7.45 points beneath it. Those are cash levels on the broad index and are not directly comparable to any Nasdaq figure above.
Institutional flow. Index protection demand is the organising feature of this morning's flow report, which is headlined on escalating hedging demand in the broad-market tracking fund as technology pressures futures. Net delta in the broad-market tracking fund is minus $1,483.4M, at the 5th percentile, with gamma of $1,426.0M at the 92nd percentile. Index ETF net short delta overall is minus $7,748.7M, driven by put unwind and protection buying, with the Nasdaq tracking fund carrying moderate short delta and the small-cap fund showing positive gamma of $95.43M. The pre-market prints listed this morning are: a cash-index 7,350 put expiring February 2027 bought for $513K, which aligns with the desk's 7,350 downside reference; cash-index 7,615 puts for September 15 sold twice, at $533K and $580K; cash-index 7,625 puts for September 18 sold at $1.1M; and a cash-index 7,680 put and call for December 18 bought and sold as a spread at $3.9M and $3.7M. On the single-stock side, and relevant to this index, the largest opening purchase listed is 22,819 calls for September 18 struck at 232.50 in one of the largest technology names.
Price Action & Technical Structure
2.1 Intraday and Session Review
Friday's September contract traded a session range of 459.75 points, from 29,040.50 to 29,500.25, settling at 29,387.00. The close sat at 75.37 percent of that range. The cash index traded a regular-hours band of 159.61 points, from 29,313.51 to 29,473.12, opening at 29,331.48 and closing at 29,368.44. Within the cash window the index closed at 34.42 percent of its range.
As with the broad market, the two closing-range figures describe different windows and are not comparable: the futures figure spans the full electronic session including the pre-dawn reaction to the consumer price release, while the cash figure covers only 09:30 AM to 04:00 PM ET. The divergence between a firm 75.37 percent futures close and a middling 34.42 percent cash close indicates the session's strength was concentrated in the overnight and opening reaction rather than sustained through the afternoon, which is a materially less constructive reading than the futures close alone suggests.
The Sunday electronic reopen is the more important event. The contract opened at 28,997.75 against the Friday settlement of 29,387.00, a gap of 1.32 percent measured open to previous. It has traded between 28,981.00 and 29,111.00. This is an overnight repricing and not a regular-hours move; it should not be characterized as Monday's direction, which has not yet occurred.
2.2 Daily Structure
The daily picture is a corrective phase that has progressed further than the broad market's. The September contract registered its 52-week high at 31,100.00 on June 3 and a one-month high of 30,343.00 on August 17. The one-month low of 28,927.25 was set on September 2, and the overnight session has traded to within 54 points of it.
Over the trailing five sessions the contract is lower by 550.25 points, or 1.86 percent, having opened that window at 29,565.25 and printed a period high of 29,764.75 on September 8. Over one month it is lower by 1,126.75 points, or 3.74 percent. Over three months it is lower by 939.75 points, or 3.14 percent, a negative reading the broad-market contract does not share, since that instrument remains positive over the same window. Year to date the contract holds a gain of 3,123.00 points, or 12.06 percent.
The distinction that matters is the three-month comparison. Technology has given back its quarter while the broad market has not, which establishes that the current corrective phase is led by this index rather than merely shared by it.
2.3 4-Hour and Swing Structure
The swing sequence is a clear series of lower highs: 31,100.00 on June 3, 30,975.50 on June 16, 30,343.00 on August 17, then 29,764.75 on September 8. The low sequence is 27,201.50 on July 29 followed by 28,927.25 on September 2, so lows remain higher while highs fall, describing a compressing structure that has been resolving downward.
The operative near-term question is whether 28,927.25 holds. A sustained break beneath it would convert the compressing structure into a confirmed lower-low sequence and open the second and third computed supports at 28,849.50 and 28,658.50.
Retracement structure places the 50 percent level of the 13-week range at 29,088.50 and the 38.2 percent retracement from the 13-week high at 29,533.83. Price is currently beneath the 50 percent level, which is a weaker location than the broad market occupies within its own equivalent range.
2.4 Moving Averages
The stack against the current overnight quote near 29,015:
| 5-day | 29,304.95, price below by approximately 290 points |
| 20-day | 29,409.10, price below by approximately 394 points |
| 50-day | 29,308.51, price below by approximately 294 points |
| 100-day | 29,398.61, price below by approximately 384 points |
| 200-day | 27,534.30, price above by approximately 1,481 points |
This configuration is more uniformly negative than the broad market's. Price sits beneath the 5-day, 20-day, 50-day and 100-day averages, holding only above the 200-day. The broad-market contract, by contrast, remains above its 100-day. The four shorter averages are compressed within a 104-point band between 29,304.95 and 29,409.10, which creates a single dense supply zone rather than a series of separate hurdles, and any recovery attempt will meet all four at effectively the same place.
The 40-day average at 29,248.25 sits beneath that compression zone and is the first meaningful reclaim objective.
2.5 Oscillator and Trend Readings
Relative strength readings are soft: 39.92 on the 9-day, 43.93 on the 14-day, and 46.26 on the 20-day. The 14-day figure declined 5.76 points on the session, a larger deterioration than the broad market's 3.28-point decline.
Stochastic readings are deeply depressed on the raw measure and less so on the smoothed. The 14-day raw stochastic is 9.92 percent with %K at 28.48 percent and %D at 41.29 percent; the 20-day raw reading is 6.20 percent. The wide gap between the raw reading near 10 percent and %D above 41 percent indicates the decline is recent and rapid rather than established, since the smoothed series has not yet caught down to the raw.
Trend strength again argues against directional extension. The 14-day directional index reads 12.55, with positive directional movement at 16.11 and negative at 21.99. A reading beneath 20 indicates no definable trend, and the negative component exceeding the positive supplies a downward tilt without trend confirmation.
Historic volatility on the 14-day window is 13.05 percent against 8.88 percent for the broad market, confirming this index as the higher-variance expression of the same macro view.
The composite trend indicator registers a hold. The aggregated multi-indicator opinion stands at 40 percent sell with strength described as weak and direction strengthening. The long-term component is 67 percent sell, which differs materially from the broad market, where the long-term component remains 67 percent buy. That divergence in the long-horizon component is the clearest single expression of technology's relative deterioration.
2.6 Volatility and Expected Range
Average true range measurements:
| 9-day | 408.30 points, 1.41 percent |
| 14-day | 439.49 points, 1.51 percent |
| 20-day | 475.04 points, 1.64 percent |
| 50-day | 532.42 points, 1.83 percent |
Average daily range: 366.25 on the 9-day, 357.21 on the 14-day, 380.90 on the 20-day.
At 1.51 percent, the 14-day average true range is roughly 1.62 times the broad market's 0.93 percent, which is the quantitative statement of this index's higher beta and the reason position sizing must be scaled down relative to a broad-market equivalent.
The options-flow source does not publish an implied one-day move for this index in the dataset captured, so no options-derived range expectation is available here. That absence is stated rather than filled with an estimate. The average-range measurements above are the basis for the expected ranges in section 6.
Key Levels
Levels are quoted in the September E-mini domain. Cash-index equivalents, where given, use the basis measured for this session, namely the Friday settlement of 29,387.00 against the cash close of 29,368.44, or plus 18.56 points.
A provenance rule applies throughout. The options-flow source publishes paired futures and cash values only for the broad-market complex, not for this index. Its technology-index levels are therefore published in the cash domain only, and are quoted here in that domain and labelled as such. No futures equivalent for those levels is presented as source-published, and the basis measured here is not used to move any source-published cash value.
3.1 Resistance
The immediate overhead reference is the computed pivot point at 29,309.25, which price is currently well beneath. Above it sits the compression zone described in section 2.4, where the 5-day at 29,304.95, the 50-day at 29,308.51, the 20-day at 29,409.10 and the 100-day at 29,398.61 converge within roughly 104 points, overlapping the Friday settlement magnet at 29,387.00. That 29,300 to 29,410 band is the principal barrier to recovery and contains five separate references.
Above the band, the 38.2 percent retracement from the 13-week high at 29,533.83 and Friday's session high at 29,500.25 mark the next tier. The first computed resistance at 29,578.00 and the first standard-deviation resistance at 29,607.76 sit just above, with the 9-to-18-day moving-average crossover reference at 29,662.00 completing that band of interest.
The second standard-deviation resistance at 29,699.20, the second computed resistance at 29,769.00 and the third standard-deviation resistance at 29,769.37 mark the upper boundary of the statistically ordinary range, with the latter two effectively coincident. The third computed resistance at 30,037.75 is an extended objective requiring a catalyst.
In the cash domain, the options-flow source publishes its primary call side ceiling and its primary gamma concentration at the same value of 29,275, with further key strikes identified at 29,500 and 30,000. Those levels sit on listed strikes. That the call side ceiling and the primary gamma concentration coincide at 29,275 is notable: it concentrates dealer hedging interest at a single price that currently sits above the market and beneath the moving-average compression zone.
3.2 Support
The immediate support structure is thinner than the broad market's and has already been breached in part.
The 40-day moving average at 29,248.25 is the first reference beneath the compression zone. Below it, the first standard-deviation support at 29,166.24 and the first computed support at 29,118.25 form the upper boundary of the zone that matters for Monday. The 50 percent retracement of the 13-week range at 29,088.50 and the second standard-deviation support at 29,074.80 follow closely.
The third standard-deviation support at 29,004.63 and the overnight low at 28,981.00 mark the area where price currently sits. In the cash domain, the options-flow source publishes its primary put side support base at 29,000, a listed strike. The overnight low of 28,981.00 corresponds to approximately 28,962.44 in the cash domain on this session's measured basis, which is beneath that published base. Technology has traded through its put side support base in overnight dealing while the broad market held its equivalent line, and this is the single most important observation in this review.
Beneath current price, the one-month low at 28,927.25 is the operative structural line. Below it, the second computed support at 28,849.50 and the third at 28,658.50 are the downside objectives. The options-flow source publishes its modeled gamma-flip level for this index at cash 28,811, anchored to the September 10 reference. That is a modeled underlying-price threshold produced by the provider's model rather than a listed option strike, no contract need exist at that price, and it moves as positioning changes. It sits between the second and third computed supports and would be traversed on a decline of that extent.
Macro Drivers
4.1 Dollar, Rates, and Fed Policy
The policy path is the first-order driver and bears more heavily on this index than on the broad market because of duration sensitivity. The August consumer price report released Friday at 08:30 AM ET delivered core at 0.3 percent month over month against a 0.2 percent expectation, with headline at 3.4 percent year over year unchanged from July and core at 2.4 percent year over year easing from 2.5 percent to a five and a half year low.
Market-implied odds of an increase at the September 16 meeting rose through Friday, with intraday snapshots placing the figure between 85 and 88 percent against roughly 69 to 75 percent before the release. An increase would be the first in three years. Press commentary published Friday noted that policy cycles of this character rarely consist of a single move, which is the substantive risk for long-duration equity: the projections accompanying Wednesday's decision carry more forward information than the decision itself.
The dollar index rose 0.06 percent on Friday and the ten-year note yield closed slightly higher. Producer prices on September 10 printed 5.4 percent year over year against a 5.3 percent expectation with the prior revised up to 4.8 percent, and the August employment report on September 4 delivered 162,000 against a 55,000 expectation with the prior revised to positive 21,000. The consistent direction of surprise across activity and prices over the past two weeks is the coherent explanation for the repricing and for technology's relative underperformance within it.
4.2 Large-Cap Leadership and Earnings
This is the section where Friday's constructive evidence and the overnight evidence conflict most directly.
The options-flow source recorded approximately positive 1.3 billion dollars of total delta in single stocks on Friday, heavily concentrated in the largest technology names, most of which traded higher. Two names advanced roughly 2 percent each, with substantial opening call purchases recorded in October-dated contracts on both, and those options appreciated 27 and 22 percent on the session. On Friday's evidence alone, large-cap technology leadership was being accumulated rather than distributed.
The overnight session contradicts that. This contract is lower by 1.27 percent against the broad market's 0.48 percent, a ratio of roughly two and a half to one. Whatever was accumulated Friday is being repriced now, and the divergence is too large to attribute to beta alone: a simple beta relationship of approximately 1.6, consistent with the average-true-range ratio in section 2.6, would imply a decline near 0.77 percent rather than 1.27 percent.
The Monday earnings calendar carries no first-order reports. That absence removes a potential source of idiosyncratic support and leaves the index dependent on positioning and policy anticipation.
4.3 Geopolitical Backdrop
The active conflict between the United States and Iran transmits to this index primarily through crude oil, the inflation impulse and the rate path, rather than through direct operational exposure.
Weekend developments were de-escalatory in wording. Saudi Arabia's foreign ministry stated Friday afternoon it had chosen not to retaliate at that stage following a request from Iraq's prime minister. Iraq stated it rejects attacks threatening Saudi security and has ordered an investigation. A regional meeting scheduled for Monday in Oman was postponed Sunday afternoon, described as being in the interest of consensus. Iran's foreign ministry stated its strikes have targeted the source of attacks rather than countries, and indicated that several states backing an adverse international atomic agency resolution would face consequences.
Crude's weekend behavior contradicts the de-escalatory wording, as discussed in section 4.5, and that contradiction is the mechanism by which this backdrop is currently pressuring long-duration equity.
4.4 Sector Breadth and Rotation
Friday's advance was broad and near-uniform across capitalization: the broad market rose 0.86 percent, the industrial average 0.98 percent, and this index 0.91 percent. The absence of meaningful dispersion indicates an index-level relief move driven by the crude decline rather than a rotation into technology.
This characterization rests on index-level aggregates rather than on a direct measurement of advancing versus declining issues or sector-level attribution, neither of which was captured in this run, and should be treated as inference rather than as a measured breadth reading.
The overnight session shows the rotation that Friday lacked, and it runs against technology. A 1.27 percent decline here against 0.48 percent in the broad market is a decisive relative move. If it persists into regular-hours trade it establishes that the market is discounting the policy decision specifically through the duration channel, which is the transmission mechanism that damages this index most.
4.5 Cross-Asset and Volatility
Crude oil is the critical cross-asset signal and it has reversed hard.
October crude settled Friday at 100.05, lower by 2.43 dollars or 2.37 percent, after Thursday's 6.7 percent advance to a three and a half month high, and after setting a fresh 52-week high at 104.46 during Friday's session. The decline followed an International Energy Agency warning that elevated prices and restricted supply would produce the largest drop in global oil demand since the pandemic. The same agency raised its estimate of this year's global supply deficit to 1.7 million barrels per day from 1.3 million and delayed the expected return to surplus until 2027.
Across the weekend reopen crude has advanced 2.76 dollars, or 2.76 percent, to trade near 102.81, recovering the entirety of Friday's decline. Friday's equity advance was explicitly attributed to the crude decline easing inflation concerns; that support has been withdrawn. The coincidence of crude reversing higher and this contract gapping 1.27 percent lower is internally consistent and is the most coherent explanation available for the overnight move.
The volatility index declined roughly 11 percent Friday to close at 15.84, and the volatility-of-volatility index fell 11 points to 91. Fixed-strike volatility collapsed across tenors of two days or less, falling 3 to 4 volatility points. That reset occurred before the crude reversal and should be treated as stale relative to current conditions.
4.6 Institutional Positioning
Positioning in this index is mixed in a way the broad market's is not, and the distinction is worth stating precisely.
Gamma notional for market makers in the cash index reads positive 3.879 million dollars, while the principal tracking fund reads negative 758.979 million. The cash-index figure is marginally positive and very small in absolute terms; the tracking-fund figure is substantially negative. Gamma tilt reads 1.143 for the cash index, the highest reading in the complex captured, against 0.674 for the tracking fund. The practical reading is that dealer hedging in this index is close to neutral at the index level and amplifying through the tracking fund, which is a less clearly stabilizing configuration than a single positive number would suggest and a less clearly amplifying one than the broad market's.
Options activity on Friday ran 7,165 calls against 7,412 puts in the cash index, a put-to-call volume ratio of 1.034, which is close to balanced. Open interest stands at 88,342 calls against 111,872 puts, a ratio of 1.266. In the tracking fund, volume ran 869,959 calls against 1.426 million puts, a ratio of 1.639, with open interest at 5.416 million calls against 7.42 million puts, a ratio of 1.370. The tracking fund carries the more defensive configuration on both measures, which is consistent with it being the retail and institutional hedging vehicle of choice.
The 25-delta risk reversal reads negative 0.062 in the cash index, the most negative in the complex captured, indicating the firmest relative bid for downside protection across the indices reviewed.
Futures positioning as of September 8 shows commercial participants long 154,226 against short 195,244, with the short side reduced by 5,942 contracts and the long side by 1,540. Non-commercial participants are long 85,927 against short 65,032, having cut longs by 3,507 and added 1,488 to shorts. Dealer and intermediary positions are long 58,541 against short 125,253, with the short side cut sharply by 11,760 contracts. The consistent pattern is short covering by commercials and dealers alongside long liquidation by non-commercials, which describes a market where conviction on both sides was being reduced ahead of the policy decision.
The September contract is cash-settled, so it carries no delivery obligation and no first-notice date; its final settlement falls on September 18, five sessions from Monday, coinciding with the quarterly expiration. Roughly 35 percent of total United States options exposure is scheduled to expire between now and that date. Position rolling into the December contract will be an active feature of the week and adds mechanical flow unrelated to directional conviction.
Options Flow Context
This run uses the Nasdaq-100 cash index and its principal tracking fund as the positioning dataset for this contract. That choice is stated affirmatively: these are the surfaces for which the options-flow source publishes a complete dealer-positioning stack, and they are the instruments against which exposure in this contract is most directly hedged.
The dealer positioning stack, published in the cash domain and anchored to the September 10 reference of 29,103, which corresponds to that index's September 10 close of 29,103.51 rather than to Friday's close of 29,368.44:
| Primary call side ceiling | 29,275, listed strike |
| Primary gamma concentration | 29,275, listed strike |
| Modeled volatility threshold | 29,250, modeled level |
| Primary put side support base | 29,000, listed strike |
| Modeled gamma-flip level | 28,811, modeled level |
For the principal tracking fund, the corresponding stack is a call side ceiling at 730, a primary gamma concentration and put side support base both at 700, a modeled volatility threshold at 712 and a modeled gamma-flip level at 718, against a reference of 708.
The tracking fund's configuration contains an inversion worth flagging: its modeled gamma-flip level at 718 sits above its modeled volatility threshold at 712, and both sit above the 708 reference. Taken at face value this would place the reference beneath both modeled thresholds, a more defensive configuration than the cash index's stack implies. This inversion is reported as published and is not reconciled here.
The immediately actionable reading concerns the put side support base at cash 29,000. Friday's cash close of 29,368.44 finished 368 points above it. The current overnight futures quote near 29,015 corresponds to approximately 28,996 in the cash domain on this session's measured basis, which is marginally beneath that base. Price has moved from comfortably above the put side support base to marginally below it across the weekend reopen. Because that level sits on a listed strike carrying concentrated open interest, trading beneath it removes a source of dealer-supplied support rather than merely breaching a chart level.
The distance to the modeled gamma-flip level at cash 28,811 is approximately 185 points from the current cash equivalent. That is well inside a single 14-day average true range of 439.49 points, meaning an ordinary session is sufficient to traverse it. This is the principal downside risk for the week and the reason the Primary Setup below is positioned short rather than mirroring the broad market's long-from-support structure.
Forecast
Scenario weightings below represent discretionary analyst judgment. They are not statistically derived and carry no calibration.
Night Session (6:00 PM ET Sunday, September 13 to 3:00 AM ET Monday, September 14, Globex/Asia)
Bias is negative, with the qualification that the session is well advanced and has established its character. The contract has traded 28,981.00 to 29,111.00 and sits near the lower half of that band, beneath the cash-domain put side support base.
The principal remaining catalyst in this window is any incremental Gulf development, with crude the transmission channel. Chinese activity data at 10:00 PM ET Monday falls outside this window.
Expected range for the remainder of the window: 28,940 to 29,090.
London Session (3:00 AM to 8:00 AM ET Monday, September 14)
Bias is neutral to negative. The European calendar carries only Swedish inflation at 02:00 AM ET, which is not a driver for this instrument. European participants will position for Wednesday rather than respond to domestic data.
The relevant channel is the dollar and the rate differential. A firmer dollar on rate-differential grounds applies pressure to long-duration equity specifically. Absent a crude escalation the window is likely to consolidate within the overnight band.
Expected range: 28,930 to 29,120.
Morning Session (9:30 AM to 12:00 PM ET Monday, September 14, RTH Open)
Bias is negative while price remains beneath cash 29,000.
There are no scheduled United States economic releases on Monday. The only North American data is Canadian consumer prices and manufacturing sales at 08:30 AM ET, which is not a first-order driver here. The cash open at 09:30 AM ET sets the session's first directional test without a data catalyst, and price discovery will be driven by positioning into Wednesday.
The decisive question for this window is whether regular-hours trade accepts or rejects the loss of the cash 29,000 put side support base. Rejection, meaning a reclaim and hold above it, would invalidate the short thesis and open the 29,118 to 29,166 band and then the 29,248 40-day average. Acceptance opens the one-month low at 28,927.25 and then 28,849.50.
Expected range: 28,900 to 29,160.
Afternoon Session (12:00 PM to 4:00 PM ET Monday, September 14)
Bias is neutral with a downward drift while beneath the compression zone. There are no auctions, no scheduled policy speakers of consequence and no first-order releases in this window. Participation typically declines on the Monday preceding a policy decision.
The close relative to cash 29,000 carries the information for Tuesday. A close back above it would mark the overnight break as a false one. A close beneath the one-month low at 28,927.25 would confirm a lower-low sequence with the expiration approaching.
Expected range: 28,880 to 29,140.
Night Session Forward (6:00 PM ET Monday, September 14)
Residual bias depends on Monday's close relative to 29,000 in the cash domain. Chinese industrial output, retail sales, unemployment and urban investment arrive at 10:00 PM ET with an accompanying press conference from the Chinese statistics bureau. That set is the first scheduled catalyst of substance after Monday's close and carries particular relevance for semiconductor and hardware supply-chain exposure within this index.
Expected Range (Monday, September 14 Full Session)
| Low-range scenario | ** 28,930 to 29,150 |
| Mid-range scenario (most likely) | ** 28,880 to 29,180 |
| High-range scenario | ** 28,700 to 29,320 |
The mid-range scenario spans 300 points, which is approximately 0.68 times the 14-day average true range of 439.49 points, a deliberately conservative assumption reflecting the absence of a Monday catalyst. The high-range scenario spans 620 points, approximately 1.41 average true ranges, and would require either a crude escalation or a pre-decision policy signal.
Most Likely Path
The most probable sequence begins with the cash open at 09:30 AM ET testing whether the loss of the cash 29,000 support base is accepted. Given the density of references between 29,074 and 29,166 immediately above, an early recovery attempt toward that band is likely and is expected to fail, since the moving-average compression zone at 29,300 to 29,410 sits above it and no catalyst exists to resolve that barrier. Price then works back toward the one-month low at 28,927.25 through the afternoon on declining participation. A decisive break of that low is more likely to occur Tuesday or Wednesday, when the policy decision supplies the catalyst, than on a data-light Monday.
Monday Economic Calendar
The Monday calendar is light for United States index futures, and that absence defines the session.
The overnight Asian window carries no first-order releases ahead of the cash open. Swedish consumer prices arrive at 02:00 AM ET during the European window, with a prior monthly reading of negative 0.3 percent and a prior annual reading of 0.3 percent, and are not a driver for this instrument.
The North American morning carries Canadian data at 08:30 AM ET: consumer prices year over year forecast at 3.1 percent against a 3.0 percent prior, consumer prices month over month forecast flat against a 0.5 percent prior, core consumer prices with a 2.3 percent prior annual reading, and manufacturing sales forecast at negative 0.2 percent against a 0.1 percent prior. These are not first-order for this index.
There are no scheduled United States economic releases and no first-order corporate reports on Monday. The Treasury auctions 13-week and 26-week bills at 11:30 AM ET, routine short-dated bill operations that are not a duration event and are not a driver for this index. The single first-order event is therefore the cash open at 09:30 AM ET and whether the overnight loss of the cash 29,000 support base is accepted in regular-hours trade.
The remainder of the week governs appropriate size on Monday. Chinese industrial output, retail sales, unemployment and urban investment arrive at 10:00 PM ET Monday. Tuesday brings United Kingdom employment at 02:00 AM ET, German economic sentiment at 05:00 AM ET forecast at 40.2 against a 34.2 prior, New York regional manufacturing at 08:30 AM ET forecast at 14 against a 20.60 prior, and a 20-year Treasury auction at 01:00 PM ET, which is a duration event and therefore relevant to this index specifically. Wednesday is pivotal: United States retail sales at 08:30 AM ET forecast at 0.9 percent against a negative 0.6 percent prior, import and export prices in the same 08:30 AM ET slot, crude oil inventories at 10:30 AM ET forecast at a 1.35 million barrel draw, then the policy rate statement and projections at 02:00 PM ET followed by the press conference at 02:30 PM ET. Thursday carries the Bank of England decision at 07:00 AM ET forecast unchanged at 3.75 percent and United States jobless claims at 08:30 AM ET forecast at 205,000 against 206,000 prior. Friday is the quarterly expiration and this contract's expiration date.
The implication is direct. A data-light Monday preceding a policy decision that is roughly 86 percent priced, with this contract expiring Friday alongside a quarterly expiration removing approximately 35 percent of United States options exposure, does not warrant full commitment. Monday is a session for establishing position at defined structure.
Primary Trade Setup
Direction: Short
Rationale: Overnight trade has carried price beneath the cash 29,000 put side support base that the options-flow source publishes on a listed strike, while the broad market held its equivalent structural line. Four moving averages are compressed into a single supply zone above, the long-horizon composite reads sell where the broad market reads buy, and the modeled gamma-flip level sits within one average true range beneath current price.
Entry Zone: 29,118 to 29,166, on a rally into the first computed support and first standard-deviation support from beneath, where both become resistance
Stop Loss: 29,275, above the 40-day moving average at 29,248.25 and above the cash-domain modeled volatility threshold published at 29,250, which converts to approximately 29,268.56 in this contract's domain on the measured basis of plus 18.56, so the stop sits above both the price-structure and positioning references rather than between them
Target 1 (T1): 28,927.25, the one-month low and the operative structural line
Target 2 (T2): 28,849.50, the second computed support
Target 3 (T3, extended): 28,658.50, the third computed support, reached only if the modeled gamma-flip level at cash 28,811 is traversed on expanding volume
Risk-to-Reward: Approximately 1:1.61 to T1, 1:2.20 to T2 and 1:3.64 to T3, measured from the 29,142 midpoint of the entry zone against the 29,275 stop
Invalidation: A reclaim of cash 29,000, approximately 29,019 in this contract's domain, held through two consecutive 30-minute closes in regular-hours trade. That would mark the overnight break as false, restore the dealer-supplied support at that strike, and shift the structure back toward the 29,300 to 29,410 compression zone.
Macro override: A crude reversal back beneath the Friday settlement of 100.05 would restore the disinflationary impulse that drove Friday's equity advance and would undercut the duration-pressure thesis this setup rests on. A second override is any pre-decision policy signal implying a single move rather than a continued path, which would disproportionately benefit long-duration equity and this index specifically.
Position sizing note: Reduced size, and reduced further than a broad-market equivalent. The 14-day average true range here is 1.51 percent against 0.93 percent for the broad market, a ratio of roughly 1.62, so an equivalent dollar risk requires proportionally fewer contracts. The setup is positioned two sessions ahead of the policy decision and into this contract's own expiration week.
Sources and methodology
This piece is built from this desk’s own session review for the contract, prepared on the evening of Sunday September 13, 2026, and refreshed against live pre-market data at 8:15 AM ET on Monday September 14. The last completed regular-hours session was Friday September 11. The computed pivot ladder is reconstructed from that session’s high, low and settlement. The moving-average stack, oscillator matrix and volatility measurements are read from the same session and are labelled as Friday readings wherever they appear against a live price.
Monday figures marked as live were read at 8:15 AM ET and reconciled against Friday’s settlement before use. Contract domains are kept separate throughout: a cash index level is never set against a futures level without the basis being stated, and dashboard headers quoting spot metal or the cash index are not treated as futures quotes. Dealer-positioning figures are taken from the options flow dataset captured this morning and are dated where the provider dates them.
Scenario weightings reflect discretionary analyst judgment. They are not statistically derived and carry no calibration.
Every level above is published before the session, not after it. Our performance statement shows how the graded levels have resolved over time.
Daily reviews for ES, NQ, GC and CL go out before each session. See what is included.



