
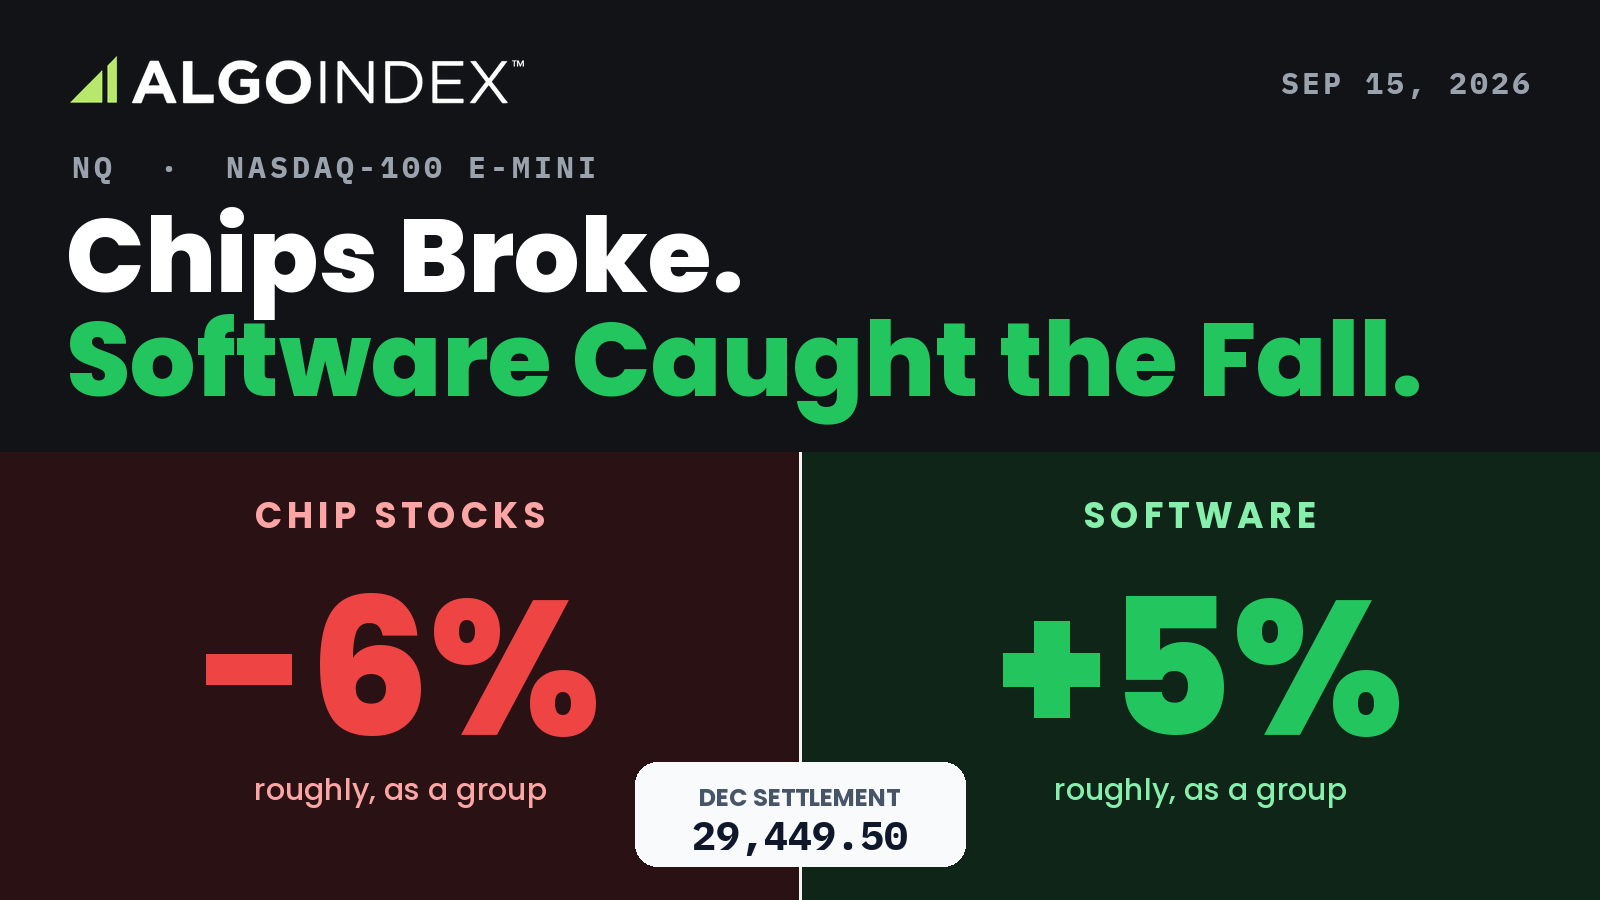
Between Friday's settlement and Monday's low, the December Nasdaq-100 contract gave up 577 points, and more than half of that was gone at the Sunday reopen. Teradyne fell 13.30 percent. Corning fell 13.70 percent. ASML and Applied Materials each lost more than 7 percent after reported comments from leaders of the largest artificial-intelligence developers backed a slower pace of advanced-model development, which the market read as a threat to the data-centre spending that has carried the chip trade.
Software took the other side. SentinelOne jumped 14.48 percent, Fortinet 9.04 percent, Autodesk 7.78 percent and Intuit 5.47 percent, on the reasoning that a slower build-out leaves incumbent software revenue less exposed to disruption. The semiconductor complex lost roughly 6 percent. The software complex gained roughly 5 percent. Between them, the cash index gave up only 0.82 percent to close at 29,127.16, its lowest close in about six weeks.
December took over from September as the volume leader on Monday, 526,843 contracts to 497,189. It settled at 29,449.50, down 234.75 points. The contract enters Tuesday 62.42 points above the computed pivot at 29,387.08 and beneath every short and intermediate moving average on the chart, with a 20-year bond auction at 1:00 PM ET and a rate decision on Wednesday.
December Nasdaq-100 futures settled at 29,449.50, down 0.79 percent, after chipmakers fell about 6 percent and software rose about 5 percent on reports that AI developers back a slower pace of development. The key Tuesday levels are the 29,600 to 29,670 supply shelf overhead and the 29,387 pivot beneath. The primary setup is a short from 29,600 to 29,660, stop 29,715, targets 29,387, 29,323 and 29,178, with the 1:00 PM ET 20-year bond auction the main US event.
Lean bearish beneath the moving-average shelf, with a crowded leveraged-fund short book as the squeeze risk.
The low that buyers defended
December opened the Sunday session at 29,381.00, already 303.25 points under Friday's 29,684.25 settlement, and sold into 29,107.25. That print is also the one-month low, and it was set on the day. Then the session turned. Price climbed 342.25 points off the bottom, reclaimed the pivot and settled 68.8 percent of the way up a 497.25-point range, 68.50 points above its open.
The rally stopped at 29,604.50. On the measured basis of plus 322 points that high converts to about 29,282 on the cash index, a few points over the 29,275 upper hedging boundary published for the session, and the boundary turned price back. Monday's range was 110.5 percent of the 14-day average true range of 450.10 points. Wide, but not an outlier.
We set Monday's short into strength at 29,118 to 29,166 on the September contract and named a reclaim of 29,000 on the cash index as the line that retires it. The cash index closed at 29,127.16. That idea is finished, and the September contract, which settled at 29,152.25, expires Friday, so Tuesday's work moves to December.
Beneath the settlement, two unrelated calculations land on almost the same number. Pivot arithmetic on Monday's bar gives 29,387.08, and the 50 percent retracement of the 13-week range gives 29,387.75. That shelf, about 29,065 on the cash index, is the first line Tuesday has to hold. Below it the derived lower hedging boundary at cash 29,000 lines up with the computed target price of 29,322.97. The first and second standard deviation supports follow at 29,268 and 29,193, then pivot S1 at 29,169.67 sits next to the derived modeled gamma-flip level at 29,178. Lose that pair and the dampening that has kept ranges contained goes with it. The third standard deviation sits at 29,136, and Monday's 29,107.25 low is the line between a pullback and a break, with the 38.2 percent retracement from the 13-week low at 28,938, pivot S2 at 28,890 and pivot S3 at 28,672 beneath it.
Seven averages packed into 158 points
Every average from the 5-day to the 100-day now sits overhead. They span 158.07 points, from the 40-day at 29,550.65 to the 20-day at 29,708.72, and six of them fit inside 103 points between the 50-day at 29,605.96 and the 20-day. The 5-day is 29,627.10, the 9-day 29,661.47, the 18-day 29,653.09 and the 100-day 29,686.15. Stacked that tightly, most of the resistance flips in the last third of a rally, all at once. The 200-day average at 27,794.41, 1,655.09 points below the settlement, has not been touched.
The first test is the 40-day at 29,550, just 101.15 points above. The band from 29,592 to 29,605 holds the derived volatility threshold, cash 29,270, and Monday's rejected high. Then comes the shelf itself: the 5-day average, the first standard deviation resistance at 29,630.75, the 18-day and 9-day averages and pivot R1 at 29,666.92, five references inside 40 points. Friday's settlement at 29,684.25, the 38.2 percent retracement from the four-week low at 29,689.61, the second standard deviation at 29,705.83 and the 20-day average crowd in right above it. Acceptance over that band is what turns a bounce into a base.
Higher up, the third standard deviation sits at 29,763, the derived primary gamma concentration at 29,822 (cash 29,500), pivot R2 at 29,884 and pivot R3 at 30,164. The 30,000 strike on the cash index converts to 30,322, and the one-month high that started this four-week retreat is 30,631.75. The five-day change is minus 410.75 points and the 20-day change minus 987.75, or 3.25 percent.
The oscillators lean lower without a trend behind them. On the 14-day, negative direction at 24.42 sits well above positive direction at 15.90, yet the average directional index reads 13.06, far under the 20 mark that usually signals a trend, and 12.30 on the 20-day. The 9-day version, 16.40 and rising, is the one firming. Relative strength runs 43.13, 45.99 and 47.63 on the 9, 14 and 20-day windows and 50.97 and 52.53 on the 50 and 100-day. The 14-day stochastic %K of 36.56 is still under its %D of 43.89, and the 20-day raw reading of 22.45 is the closest thing to a stretched condition. The multi-indicator composite reads 24 percent sell, with 67 percent sell in the long-term group.
Hedges that outlast the session
Roughly minus 3 billion dollars of delta moved through Nasdaq hedging flow on Monday. About minus 2.4 billion of it came from longer-dated put buying. The S&P 500's minus 9 billion came mostly from same-day expiries that decay within hours, while longer-dated protection persists into later sessions and keeps dealers short delta against a falling market. The technology hedges bought on Monday are still on the books Tuesday.
The Nasdaq-100 tracking fund closed at 709.18, down 0.80 percent, and its options traded 1,279,000 puts against 725,584 calls, a ratio of 1.76. Open interest stands at 7.445 million puts against 5.311 million calls, a ratio of 1.40. With volume running more put-heavy than open interest, Monday added to a book that was already defensive. The 25-delta risk reversal reads minus 0.041 on the fund and minus 0.051 on the cash index.
The two positioning datasets disagree. The cash index closed 271 points above its modeled gamma-flip level of 28,856, with gamma tilt at 1.401 and gamma notional of positive 12.534 million dollars. The fund closed below its own flip level of 718, with tilt at 0.750 and gamma notional of negative 585.125 million dollars, on model data dated September 12. One reading has dealers cushioning moves. The other has them amplifying moves, which leaves the index in a transition band that small moves in either direction will resolve.
The futures positioning report adds fuel. Leveraged funds were net short 31,872 September contracts as of September 8, after cutting longs by 7,687 and adding 10,093 shorts in a single week. Asset managers held 111,052 long against 35,526 short, and dealers ran 58,541 long against 125,253 short. A short book that size, built into the decline, is fuel for a squeeze on any headline that reverses Monday's story.
A bond auction with the 10-year near 5 percent
Ten-year yields hovered near 5 percent all session, and no major US index is more sensitive to the long end than this one. Last week's data put yields there. Core consumer prices rose 0.3 percent against a 0.2 percent forecast on September 11, producer prices ran 5.4 percent year over year against 5.3 percent on September 10, and payrolls printed 162,000 against 55,000 expected on September 4. Personal consumption prices held at 3.7 percent. The calendar carries a 4 percent forecast for Wednesday's decision against a previous 3.75 percent, a 25 basis point increase, with projections at 2:00 PM ET and the press conference at 2:30 PM ET.
Tuesday's own test arrives at 1:00 PM ET, when the Treasury sells 20-year bonds. The last sale cleared a 5.204 percent high yield on a 2.530 bid-to-cover. A tail would push long yields higher the day before a decision the market already expects to tighten, a direct hit for the longest-duration major index. Earlier, at 8:30 AM ET, the New York manufacturing survey carries a 15 forecast against a 20.60 prior, and a Senate cloture vote on the Clarity Act is set for 2:15 PM ET.
The AI-policy stream has no time slot. The House Speaker said the President will convene AI executives this week or early next, and the House Minority Leader said his party would prioritise AI regulation if it won the chamber. Chinese data released at 10:00 PM ET Monday came in mixed. Industrial output grew 5.2 percent from a year earlier against a 4.8 percent forecast, retail sales rose just 0.4 percent against 0.8 percent, and fixed-asset investment fell 7.2 percent over the first eight months. How chip names trade outside US hours is the cleanest early read on whether the scare is a US governance story or a global spending story. Crude matters too. It traded above 101 in Monday's evening reopen after Iran's naval command said the Strait of Hormuz is closed, feeding the inflation channel that runs straight into the long end.
The trade map for Tuesday
The primary setup is a short from 29,600 to 29,660, sold into the shelf where Monday's rally already failed. The stop sits at 29,715, above the second standard deviation at 29,705.83 and the 20-day average at 29,708.72.
| Setup | Primary: short | Alternate: long |
|---|---|---|
| Condition | Rejection at the 29,600 to 29,670 shelf | Acceptance above 29,715 with a 20-day reclaim |
| Entry zone | 29,600 to 29,660 | Above 29,715 |
| Stop | 29,715 | 29,640 |
| Target 1 | 29,387 (pivot pairing) | 29,763 |
| Target 2 | 29,323 (target price, cash 29,000) | 29,822 |
| Target 3 | 29,178 (gamma-flip area) | 29,884 |
| Reward to risk | 2.9, 3.6, 5.3 from 29,630, 85 points of risk | Reduced size |
| Invalidation | Sustained session above 29,715 | Back beneath the 5-day average |
From a 29,630 midpoint the risk is 85 points. Reward runs about 2.9 times risk to the first target at the 29,387 pivot pairing, 3.6 times to 29,323 and 5.3 times to 29,178. That last target needs the auction to tail and selling to expand on volume. A sustained session above 29,715, and above all a settle over the 20-day average, ends the idea and opens 29,763, 29,822 and 29,884. Headlines can end it sooner. A much softer New York survey that shifts the policy path, a well-covered auction that pulls the long end back from 5 percent, or an AI-policy headline that reverses Monday's development-slowdown read would each squeeze the heavily short leveraged-fund book and retire the short at any price.
The alternate is a long only on acceptance above 29,715. It needs a reclaim of the 20-day average and broadening chip participation, with a stop at 29,640 beneath the 5-day average and targets at 29,763, 29,822 and 29,884, at reduced size ahead of Wednesday.
Scenario ranges are analyst judgment. The low-range case runs 29,300 to 29,620, 320 points. The mid-range case, the most likely, runs 29,230 to 29,670, 440 points, roughly one average true range. The high-range case runs 29,020 to 29,880, 860 points, and needs a headline to get there. Options price about 315 points of one-standard-deviation movement for the session, a useful figure for sizing. The most likely path probes the 29,387 pivot or the 29,323 pairing early, recovers into 29,550 to 29,605 and fails there on first approach. The auction then decides the afternoon: a clean result permits a grind toward 29,620, and a tail sends the contract back through the pivot toward 29,268. Absent a headline, the settlement lands between 29,380 and 29,520.
Leveraged funds added 10,093 short contracts in the week to September 8, and the next AI-policy headline will not come with a release time.
The complete data picture
Every figure behind the session for the December E-mini Nasdaq-100: the key readings, the remaining charts, the full level map, then the complete numeric reference.
Complete level map, split at the December settlement 29,449.50. December contract prices. Cash equivalents use the measured plus 322 point basis and are derived, not published pairs.
| Resistance, top down | Support, top down |
|---|---|
| 31,754.48Level for a 70 reading on 14-day relative strength | 29,387.08Pivot, 13-week midpoint 29,387.75 |
| 31,385.5052-week high | 29,322.97Target price; boundary cash 29,000 |
| 31,293.5013-week high | 29,268First SD support, cash 28,946 |
| 30,631.75One-month high, cash 30,310 | 29,193Second SD support, cash 28,871 |
| 30,322Derived 30,000 strike concentration | 29,178Derived gamma-flip level, cash 28,856 |
| 30,164Third pivot resistance, cash 29,842 | 29,169.67First pivot support, cash 28,848 |
| 30,049.3938.2% from 4-week high | 29,136Third SD support, cash 28,814 |
| 29,884.33Second pivot resistance, cash 29,562 | 29,107.25Monday low and one-month low |
| 29,869.5050% of 4-week range | 29,07340-day average stall level, cash 28,751 |
| 29,822Derived primary gamma concentration | 28,93838.2% from 13-week low, cash 28,616 |
| 29,763Third SD resistance, cash 29,441 | 28,889.83Second pivot support, cash 28,568 |
| 29,708.7220-day average | 28,672.42Third pivot support, cash 28,350 |
| 29,705.83Second SD resistance | 27,914.17Level for a 30 reading on 14-day relative strength |
| 29,689.6138.2% from 4-week low | 27,794.41200-day average |
| 29,684.25Friday settle | 27,482.0013-week low |
| 29,666.92First pivot resistance | 23,429.0052-week low |
| 29,661.479-day average | |
| 29,653.0918-day average | |
| 29,630.75First SD resistance | |
| 29,627.105-day average | |
| 29,605.9650-day average | |
| 29,604.50Monday high, cash 29,282 | |
| 29,592Derived vol threshold, cash 29,270 | |
| 29,550.6540-day average, cash 29,228 |
Full numeric reference: every figure from the session review
1. Executive Summary
The December Nasdaq-100 E-mini contract settled Monday at 29,449.50, down 234.75 points or 0.79 percent, after carving a 497.25-point session range between 29,107.25 and 29,604.50. The cash index closed at 29,127.16, down 0.82 percent, its lowest close in roughly six weeks. Today marks the front-month transition: the September contract settled at 29,152.25 and expires Friday, September 18, while December volume of 526,843 overtook September's 497,189, making December the contract that matters for tomorrow. All levels here are stated in the December domain with cash-index equivalents in parentheses, computed from the measured session basis of plus 322 points (December settle 29,449.50 less cash close 29,127.16).
One driver dominated the session. Reported comments from leaders of the largest artificial-intelligence developers backing a slower pace of advanced-model development were read by the market as a threat to the capital-expenditure cycle that has underwritten the semiconductor complex. Chip and AI-infrastructure names absorbed the damage: TER fell 13.30 percent, GLW fell 13.70 percent, ASML fell 7.25 percent, AMAT fell 7.07 percent, SNDK fell 4.98 percent, AVGO fell 4.77 percent, ADI fell 4.69 percent and AMD fell 4.40 percent. The semiconductor exchange-traded complex lost roughly 6 percent. Capital did not leave the index so much as rotate inside it: software rallied hard, with S up 14.48 percent, FTNT up 9.04 percent, ADSK up 7.78 percent, INTU up 5.47 percent and DDOG up 4.00 percent, on the reasoning that a slower AI build-out reduces the disruption risk to incumbent software revenue. The software exchange-traded complex gained roughly 5 percent, healthcare roughly 2 percent and staples roughly 1 percent. Ten-year Treasury yields sat near 5 percent through the session, which compounds the pressure on the index's long-duration constituents.
The structural contradiction heading into Tuesday is sharp. Every short and intermediate moving average now sits above spot, the negative directional index exceeds the positive one, the multi-indicator composite reads a 24 percent sell, and the cash index printed a six-week closing low. Against that, buyers defended the session low aggressively: the settle landed 68.8 percent of the way up the daily range, 68.5 points above the session open, and 62.42 points above the freshly computed pivot at 29,387.08. The market sold the AI-policy headline, found a bid under 29,150, and closed back inside the prior day's lower half rather than at the lows. That is a market absorbing a supply shock, not one in liquidation.
Tuesday's own calendar is thin and its role is positional. The Federal Open Market Committee decision lands Wednesday at 2:00 PM ET with consensus looking for 4 percent against a previous 3.75 percent, alongside an updated projection set, and the quarterly expiration follows Friday. Tuesday therefore functions as the positioning bridge into that stack, with the 1:00 PM ET twenty-year bond auction the single first-order US event for a duration-sensitive index. The primary setup is a short from the dense 29,600 to 29,670 supply shelf where the derived upper hedging boundary at 29,597, the five-day average at 29,627.10, the first standard deviation at 29,630.75 and pivot R1 at 29,666.92 all converge.
2. Price Action & Technical Structure
2.1 Intraday and Session Review
December opened at 29,381.00, already 303.25 points beneath Friday's 29,684.25 settle, which tells the story: the damage was done before the cash open, in the overnight reaction to the AI-development headline. The contract sold immediately from the open into the session low of 29,107.25, a decline of 273.75 points from the open and 577.00 points from the prior settle. That low is also the one-month low for the December contract, and it was set today rather than inherited.
From that low the session inverted. Price recovered 342.25 points off the bottom to settle at 29,449.50, reclaiming the pivot at 29,387.08 and closing 68.8 percent of the way up the daily range. The session high of 29,604.50 translates to a cash equivalent of 29,282, which sits fractionally above the published upper hedging boundary at 29,275 in cash terms, and that level rejected the advance. The cash boundary at 29,275 was tested and rejected during the session.
Two features deserve emphasis. First, the 497.25-point range is 110.5 percent of the fourteen-day average true range of 450.10, so today was a wide day but not an outlier day. Second, December traded 526,843 contracts against September's 497,189, the crossover that confirms the roll. September's open interest of 242,492 against December's 53,650 shows open interest has not yet followed volume, which is normal in the first roll session and means tomorrow's December book will thicken further.
2.2 Daily Structure
The five-day change of minus 410.75 points places the close five sessions ago at 29,860.25, so the index has given back 1.38 percent over the week. The twenty-day change of minus 987.75 points, or 3.25 percent, frames the larger drift: this is the fourth week of a grinding retreat from the 30,631.75 one-month high. The thirteen-week high stands at 31,293.50 and the fifty-two-week high at 31,385.50, leaving spot 6.17 percent below the annual peak. On the other side, the thirteen-week low is 27,482.00 and the fifty-two-week low 23,429.00, so the contract remains 25.70 percent above its annual trough.
Today's settle sits 259.22 points below the twenty-day average at 29,708.72. The fifty percent retracement of the thirteen-week range comes in at 29,387.75, essentially on top of the session pivot at 29,387.08, and price closed 61.75 points above that pair. That confluence at roughly 29,387 (cash 29,065) is the most important near-term shelf on the chart, because two unrelated methods, standard pivot arithmetic on today's bar and a thirteen-week range retracement, produce the same number.
Weekly-bar detail is not part of this edition, so prior-week and prior-quarter extremes are not asserted here. The one-month, thirteen-week and fifty-two-week bounds above are read directly from the performance set and are sufficient for tomorrow's level map.
2.3 4-Hour and Swing Structure
The swing sequence is a lower-high, lower-low progression from the one-month high at 30,631.75 through the prior settle at 29,684.25 to today's 29,107.25 low. Today did not extend that sequence in the ordinary way; it printed a new swing low and then closed back above the midpoint of its own range, which is a change-of-character candidate rather than a confirmed reversal. Confirmation requires a higher low tomorrow above 29,300 and acceptance back above the twenty-day average.
The retracement grid from the four-week high places 38.2 percent at 30,049.39 and the fifty percent mark at 29,869.50, both far above spot, so the bounce has retraced almost nothing of the four-week decline. Measured from the four-week low, 38.2 percent sits at 29,689.61, which is 5.36 points above Friday's 29,684.25 settle and 19.11 points BELOW the twenty-day average at 29,708.72. The retracement and the twenty-day average therefore bracket the 29,690 to 29,710 band from either side, which is what makes it the first genuine test of whether this is a base or a pause.
2.4 Moving Averages
- 5-day average 29,627.10, spot 177.60 below
- 9-day average 29,661.47, spot 211.97 below
- 18-day average 29,653.09, spot 203.59 below
- 20-day average 29,708.72, spot 259.22 below
- 40-day average 29,550.65, spot 101.15 below
- 50-day average 29,605.96, spot 156.46 below
- 100-day average 29,686.15, spot 236.65 below
- 200-day average 27,794.41, spot 1,655.09 above
The stack is compressed and adverse. The seven averages from the five-day through the hundred-day span 158.07 points, from the forty-day at 29,550.65 to the twenty-day at 29,708.72, and spot sits below every one of them. Six of those seven are packed tighter still, into a 103-point band between the fifty-day at 29,605.96 and the twenty-day at 29,708.72. The two-hundred-day is excluded from both figures because it sits 1,655.09 points below spot; including it would make the eight-average span 1,914.31 points and describe nothing useful. That compression is the defining technical fact of the session: reclaiming the highest of them requires a 259.22-point advance from the settlement, and because they are stacked so closely, most of that structure flips in the last third of the move rather than progressively. The two-hundred-day average at 27,794.41 remains 1,655.09 points below spot, so the multi-month uptrend is untouched by this pullback. The nearest of the group is the forty-day at 29,550.65, only 101.15 points overhead, making it the first reclaim test.
2.5 Oscillator and Trend Readings
Relative strength reads 43.13 on the nine-day, 45.99 on the fourteen-day, 47.63 on the twenty-day, 50.97 on the fifty-day and 52.53 on the hundred-day. The term structure is the informative part: short-horizon strength is weak, long-horizon strength is neutral. Nothing here is oversold. The fourteen-day reading would need 27,914.17 to reach 30 percent and 31,754.48 to reach 70 percent, so the oscillator has wide room in both directions and offers no edge on its own.
Raw stochastics read 35.88 percent on the nine-day, 34.16 percent on the fourteen-day and 22.45 percent on the twenty-day. The fourteen-day percent K at 36.56 sits below its percent D at 43.89, a bearish cross still in force. The twenty-day reading near 22 percent is the closest thing to a stretched condition in the set.
The directional system is unambiguous about trend quality and ambiguous about trend strength. The fourteen-day negative directional index at 24.42 exceeds the positive at 15.90, a clear downward bias, but the fourteen-day average directional index at 13.06 and the twenty-day at 12.30 are both far below the 20 threshold that marks a trending environment. This is a directionally negative, weakly trending environment, which historically favours range resolution at levels over momentum continuation. The nine-day average directional index at 16.40 is the highest of the set and rising, so the trend is firming rather than fading. Historic volatility sits at 12.36 percent on the fourteen-day and 12.51 percent on the twenty-day.
The multi-indicator composite prints an overall 24 percent sell with weak current strength and strengthening direction. The breakdown is instructive: 20 percent sell on the short-term group, 25 percent sell on the medium-term group and 67 percent sell on the long-term group, while the trend signal component still reads buy. The long-term group is where the damage is concentrated, driven by the hundred-day average and the fifty-to-hundred-day crossover, both of which flipped negative.
2.6 Volatility and Expected Range
The fourteen-day average true range is 450.10 points, or 1.53 percent, and the fourteen-day average daily range is 381.14 points, or 1.29 percent. The nine-day true range at 426.40 and the twenty-day at 480.48 bracket the fourteen-day figure, so realised volatility is neither expanding nor contracting sharply. The nine-day average daily range of 407.69 is above the fourteen-day figure, which says recent sessions have been travelling more ground than the two-week norm.
Front options price a 16.99 percent implied volatility on the three-day expiration. Applied to the December settle, that implies a one-day move of approximately 315 points, or 1.07 percent. The comparison, stated for scale rather than as a valuation claim: 315 points is 82.7 percent of the fourteen-day average daily range of 381.14 and 70.0 percent of the fourteen-day average true range of 450.10. These are not like-for-like measures and the comparison establishes nothing about pricing. The 315-point figure is a ONE-SIDED standard deviation of the terminal return, so the band it describes is the settlement plus or minus 315 points, and the familiar two-thirds coverage attaches to that two-sided band only under a normal-return assumption. The average daily and true ranges are something else again: mean realised high-to-low distances. A terminal-return deviation and a realised range are different objects, so no under-pricing conclusion should be drawn in either direction, and today's 497.25-point range is not evidence against the band. What the figure is useful for is sizing: the surface is pricing roughly 315 points of one-sided terminal movement for a single session.
NQ is materially higher-beta than ES. The point ranges above are far larger than the S&P contract's in absolute terms, so percentage figures are the fair basis for comparison: the Nasdaq-100 cash index fell 0.82 percent against the S&P 500 cash index at 0.48 percent.
3. Key Levels
All levels are December contract prices. Cash-index equivalents in parentheses use the measured session basis of plus 322 points and are derived here, not published by any source in that pair.
3.1 Resistance
29,550 (cash 29,228), forty-day average. The nearest piece of the moving-average stack and the first mechanical reclaim test. Failure here keeps the entire short-term structure adverse.
29,592 to 29,605 (cash 29,270 to 29,283), derived modeled volatility threshold and today's high. The cash volatility threshold published for the session is 29,270 and the upper hedging boundary 29,275; both translate into this band. Today's high of 29,604.50 printed a cash equivalent of 29,282 and was rejected there, which is independent confirmation that the band is live rather than theoretical.
29,627 to 29,667 (cash 29,305 to 29,345), the supply shelf. Four unrelated levels converge inside forty points: the five-day average at 29,627.10, the first standard deviation resistance at 29,630.75, the eighteen-day average at 29,653.09, the nine-day average at 29,661.47 and pivot R1 at 29,666.92. This is the densest overhead confluence on the chart and the anchor for tomorrow's primary setup.
29,684 to 29,709 (cash 29,362 to 29,387), prior settle and twenty-day average. Friday's settle at 29,684.25, the 38.2 percent retracement from the four-week low at 29,689.61, the second standard deviation resistance at 29,705.83 and the twenty-day average at 29,708.72. Acceptance above this band is what turns a bounce into a base; it is also the stop zone for a short.
29,763 (cash 29,441), third standard deviation resistance. The statistical ceiling of the five-period distribution. Trading above it implies a distribution shift, not an ordinary bounce.
29,822 (cash 29,500), derived primary gamma concentration. The heaviest published open-interest concentration in the cash domain sits at 29,500, translating here. Through Friday's quarterly expiration this acts as a magnet on approach rather than a hard ceiling.
29,884 (cash 29,562), pivot R2. Second-order pivot resistance and the practical upper bound of a strong-trend day from today's bar.
30,164 (cash 29,842), pivot R3. Third-order pivot resistance, reachable only on a decisive policy or policy-adjacent repricing.
30,322 (cash 30,000), derived round-number strike concentration. The 30,000 cash strike carries published open-interest weight and marks the extended upside objective for the week.
30,632 (cash 30,310), one-month high. The origin of the current retreat and the level whose reclaim would end the lower-high sequence.
3.2 Support
29,387 (cash 29,065), pivot point and thirteen-week midpoint. Standard pivot arithmetic on today's bar gives 29,387.08 and the fifty percent retracement of the thirteen-week range gives 29,387.75. Two unrelated methods, one number. Spot closed 62.42 points above it. This is the first level tomorrow's session must hold to keep today's recovery intact.
29,323 (cash 29,001), derived lower hedging boundary and computed target price. The published lower hedging boundary sits at 29,000 in cash terms, translating here, and the computed target price from today's bar is 29,322.97. A second two-method confluence.
29,268 (cash 28,946), first standard deviation support. The statistical first stop beneath the pivot.
29,193 (cash 28,871), second standard deviation support.
29,170 to 29,178 (cash 28,848 to 28,856), pivot S1 and derived modeled gamma-flip level. Pivot S1 computes to 29,169.67. The modeled gamma-flip level published in the cash domain is 28,856, dated this evening's note, translating to 29,178. This is a modeled underlying-price threshold, not an option strike, and it moves as positioning changes. It matters because losing it removes the mechanical dampening that has kept ranges contained.
29,136 (cash 28,814), third standard deviation support.
29,107 (cash 28,785), session low and one-month low. Set today. The defended level and the line between a pullback and a break.
29,073 (cash 28,751), forty-day average stall reference.
28,938 (cash 28,616), 38.2 percent retracement from the thirteen-week low.
28,890 (cash 28,568), pivot S2. The practical downside bound of a strong-trend down day from today's bar.
28,672 (cash 28,350), pivot S3. Third-order pivot support, the objective on a full risk unwind.
4. Macro Drivers
4.1 Mag7 Earnings and AI Capex Cycle
No Nasdaq-100 mega-cap reported today, so the AI capex input arrived as policy rather than earnings, and it arrived with more force than most earnings do. The market's read on reported comments from leading AI developers endorsing a slower pace of advanced-model development is direct: slower development means slower data-centre build-out, and slower build-out means the capital-expenditure guidance underwriting semiconductor and infrastructure valuations is exposed. This is the mechanism by which a governance story became a valuation story in a single session.
The political layer thickened through the day. Reported accounts placed a call from the President to NVDA's chief executive during a conference appearance, criticising calls for tighter AI constraints, and a private meeting with OpenAI's chief executive at the party convention. The House Speaker indicated the President will convene AI executives this week or early next. The House Minority Leader said Democrats would prioritise AI regulation given a chamber majority. Senate staff and lobbyists were described as debating a requirement that AI developers commit to catastrophe prevention, and OpenAI's senior lobbyist met lawmakers today. Separately AAPL released a context-aware Siri assistant, noting it is unavailable in China on regulatory grounds, and new child-protection tooling across its operating systems.
For tomorrow the relevant point is that this is an unscheduled catalyst stream. No calendar entry governs when the next AI-policy headline lands, and the convening of executives this week means the stream is likely to continue. That argues for treating upside squeezes and downside extensions as equally available and for sizing accordingly.
4.2 Semiconductor Cycle and Tech Sector Rotation
The dispersion inside the index today was extraordinary and is the single most useful piece of information in the session. Semiconductors lost roughly 6 percent as a complex while software gained roughly 5 percent. TER at minus 13.30 percent and GLW at minus 13.70 percent are capitulation-magnitude single-day moves in large capitalisations. Equipment names, ASML at minus 7.25 percent and AMAT at minus 7.07 percent, led the decline, which is the correct signature for a capital-expenditure fear rather than an end-demand fear: equipment orders are the first line item cut when build-out slows.
On the other side, S at plus 14.48 percent, FTNT at plus 9.04 percent, ADSK at plus 7.78 percent, INTU at plus 5.47 percent and DDOG at plus 4.00 percent describe a coherent thesis, that a slower AI build-out reduces the probability of incumbent software being displaced. Healthcare added roughly 2 percent and staples roughly 1 percent, so defensive sleeves also caught flow.
The index-level consequence is that the Nasdaq-100's 0.82 percent cash decline understates what happened underneath it. Rotation absorbed roughly half the semiconductor damage. That is a constructive observation for the index and a cautionary one for anyone reading the headline decline as broad-based weakness. It also means the index is now carrying an internal positioning imbalance: if the AI-policy scare reverses, the software-versus-semiconductor trade unwinds violently and the index gains from both legs.
4.3 Fed Policy and Real Yields (Duration Sensitivity)
Ten-year yields sat near 5 percent through the session, an environment that penalises long-duration equity mechanically, and the Nasdaq-100 is the longest-duration major US index. The recent data set explains the level. Core consumer prices rose 0.3 percent month-over-month against a 0.2 percent consensus on September 11. Producer prices rose 5.4 percent year-over-year against a 5.3 percent consensus on September 10, with the prior revised up. Non-farm payrolls printed 162,000 against a 55,000 consensus on September 4. Personal consumption prices held at 3.7 percent year-over-year. That is a sequence of upside inflation surprises against a labour market that refused to weaken.
The committee decides Wednesday at 2:00 PM ET. The economic calendar read at 6:00 PM ET Monday carries a forecast of 4 percent against a previous 3.75 percent, so the scheduled consensus is a 25 basis point increase, with an updated projection set at the same time and the press conference at 2:30 PM ET. Investment-bank scenario commentary timestamped 9:03 AM ET Monday treats a no-move outcome as a very low-probability event on institutional-credibility grounds. No numerical market-implied probability is asserted here. Dollar commentary in the same set attributed the currency's firm start to the week directly to the hotter-than-expected consumer price print.
For NQ the read is straightforward. The index is priced off the long end, the long end is at 5 percent, and the projection set on Wednesday is the document that decides whether 5 percent is the ceiling or the waypoint. Tuesday's twenty-year auction at 1:00 PM ET is the first live read on long-end appetite ahead of that, with the prior auction clearing at a 5.204 percent high yield on a 2.530 bid-to-cover.
4.4 Geopolitical Backdrop
The energy and security backdrop escalated materially through the session and is not being priced in equities with the same intensity as in crude. The Revolutionary Guard naval command stated the Strait of Hormuz is closed and under its control, following a supertanker reportedly engulfed in flames after striking a naval mine south of the strait. A Saudi pipeline struck in earlier action will be mostly out of service for three to five weeks. Drone strikes hit Iranian fishing vessels in southern waters, a warning was issued and then lifted in Saudi Arabia's Najran province, and Houthi forces claimed interceptions of Saudi aircraft. The Iranian president stated no intention of war with Saudi Arabia while declining to soften negotiating demands. The US President said the decision on American engagement remains open. The Treasury sanctioned a Russian bank over Iranian sanctions evasion. Separately, Ukraine and Russia were described as having agreed not to strike each other's energy infrastructure.
The transmission to NQ runs through two channels rather than direct risk aversion. First, crude strength feeds headline inflation, which feeds the long end, which prices the index. Second, a genuine strait closure would be an inflation shock of a magnitude that changes the policy path, which is exactly the variable Wednesday's projection set addresses. The elevated crude complex, with the front contract trading above 101 in the evening reopen, is the live expression of this.
4.5 Cross-Asset and Volatility
The volatility index closed at 17.10, up roughly 8 percent on a 0.5 percent S&P decline. The relationship is worth stating precisely: index volatility is typically several times more volatile than the index itself, and an 8 percent volatility move on a half-percent index move is within that normal relationship rather than evidence of panic. The volatility-of-volatility measure rose 4 percent to close at 95.
Fixed-strike volatilities rose across the board, with expirations spanning Wednesday's decision through Friday's quarterly expiration gaining roughly 3 to 4 volatility points. S&P at-the-money implied volatility for the decision expiry stands at 15.6 percent and for the expiration at 16.0 percent, implying intraday moves of approximately 98 and 100 basis points respectively. The cash skew steepened on the put side relative to at-the-money, which is consistent with institutional positioning for tail outcomes rather than directional conviction.
Cross-instrument, the S&P 500 cash index fell 0.48 percent against the Nasdaq-100 cash index at 0.82 percent, so technology underperformed the broad index by 34 basis points on a matched cash basis. Pairing one index's cash return with the other's futures return produces a spurious 37 basis points, so the matched pair is the one quoted. Gold fell 1.29 percent intraday before stabilising in the evening reopen, an unusual combination with an escalating security backdrop and consistent with the higher real-yield environment doing the work. Crude rose.
4.6 Institutional Positioning
Positioning data as of September 8 on the September contract shows leveraged funds long 47,674 against short 79,546, a net short of 31,872, with the long leg reduced by 7,687 and the short leg increased by 10,093 in the week. That is an aggressive one-week swing toward the short side and it preceded today's decline. Asset managers held the other side, long 111,052 against short 35,526, with the long leg increased by 2,655. Dealers ran long 58,541 against short 125,253, reducing the short leg by 11,760.
The asymmetry matters for tomorrow. A leveraged-fund short of that size, built into the decline, is fuel for a squeeze on any reversal headline, and the AI-policy stream is precisely the sort of unscheduled catalyst that produces one. It is also a reason today's close finished 68.8 percent up the range rather than at the lows.
5. QQQ Options Flow Context (Proxy)
This section uses the Nasdaq-100 exchange-traded fund as the positioning dataset, because it carries the deepest listed options book tracking this index and correlates above 95 percent with the futures contract. It is a proxy read, secondary to technical structure and to the sector flow described above, and it is cited here alongside the cash-index positioning table rather than in place of it.
The fund closed at 709.18, down 0.80 percent. The positioning model data available for it is dated September 12 and reads: call gamma of 243 million against put gamma of minus 2.6 billion, next-expiration gamma of 8.95 percent, and a high volatility point at 709. The put-to-call gamma ratio of roughly eleven to one is the salient figure. Estimated gamma notional for the fund is negative 585.125 million and the gamma tilt reads 0.750, both consistent with a put-dominant book.
This evening's positioning table for the fund lists the published levels as follows: modeled volatility threshold 716, primary gamma concentration 720, upper hedging boundary 720, lower hedging boundary 700, and modeled gamma-flip level 718. The key strike set is 720, 715, 710 and 700. With the fund at 709.18, price is below its modeled gamma-flip level of 718 and below the 710 strike, sitting between the 700 lower boundary and the 715 strike.
The cash-index table in the same note reads differently and the divergence is worth naming. Cash levels are: upper hedging boundary 29,275, modeled volatility threshold 29,270, primary gamma concentration 29,500, lower hedging boundary 29,000, and modeled gamma-flip level 28,856. Cash closed at 29,127.16, which is ABOVE its modeled gamma-flip level of 28,856 by 271 points, while the fund closed BELOW its own modeled flip. Cash gamma tilt reads 1.401 with estimated gamma notional of positive 12.534 million, against the fund's negative 585.125 million. The two datasets disagree on whether dealer positioning is currently dampening or amplifying moves. That disagreement is itself the finding: the index sits in the transition band, and small moves in either direction resolve it.
Flow for the session recorded roughly negative 3 billion of delta on the Nasdaq complex, of which approximately negative 2.4 billion came from longer-dated put buying rather than same-day activity. That composition is the important detail. Same-day put buying decays and reverses within hours; longer-dated put buying is hedging that persists into subsequent sessions and keeps dealers short delta against a falling market. By contrast the S&P's negative 9 billion of delta was driven predominantly by same-day expiries. Hedging demand was therefore concentrated in tech, and it was structural rather than tactical.
Fund option volumes ran 725,584 calls against 1,279,000 puts, a put-to-call volume ratio of 1.76. Open interest stands at 5.311 million calls against 7.445 million puts, a ratio of 1.40. Both ratios are put-heavy, and volume is more put-heavy than open interest, meaning today added to an already defensive book. The 25-delta risk reversal reads minus 0.041 on the fund and minus 0.051 on the cash index, confirming put demand at the wings.
Proxy caveat: the fund's model data is two days old and its reference prices in the positioning table were struck against Friday's closes. Treat the strike locations as reliable and the modeled thresholds as indicative and moving.
6. Forecast
Scenario weightings below are analyst judgment applied to the level structure and catalyst calendar. They are not statistically derived and carry no calibration.
Night Session (6:00 PM ET Monday to 3:00 AM ET Tuesday, Globex/Asia)
Bias: mildly constructive with a hard cap. The December contract reopened near 29,462 and has traded a narrow 29,461 to 29,490 band in the first evening hour, holding the recovery rather than giving it back. The dominant scheduled catalyst is the Chinese data block at 10:00 PM ET covering industrial output with a 4.8 percent consensus against 4.5 percent prior, retail sales at 0.8 percent against 0.6 percent, urban investment at minus 7.1 percent against minus 6.7 percent and the unemployment rate at 5.2 percent, followed by the statistics bureau press conference. Asian semiconductor names will open into today's US chip decline, and their reaction is the cleanest available read on whether the AI-policy scare is being treated as a US governance story or a global capital-expenditure story. Expected Globex range 29,350 to 29,600, with the risk skewed to a test of the lower bound if Asian chip names extend the US move. A weak Chinese investment number would compound that.
London Session (3:00 AM to 8:00 AM ET Tuesday)
Bias: neutral, range-respecting. UK labour data at 2:00 AM ET, French final consumer prices at 2:45 AM ET and German investor sentiment at 5:00 AM ET with a 40 consensus against 34.2 prior populate the window. European technology is thinly represented relative to the US complex and the equipment names that led today's decline trade primarily on their home listings, so a second leg lower in European semiconductors would be a meaningful confirmation signal. Watch the dollar: a firm currency on the back of last week's consumer price print pressures the long end and therefore the index. Expected range 29,380 to 29,590.
Morning Session (9:30 AM to 12:00 PM ET Tuesday, RTH Open)
Bias: mildly negative into the supply shelf, mildly positive beneath it. The cash open at 9:30 AM ET sets the session's first directional test, and the level that defines the morning is the pivot at 29,387. Holding above it keeps the recovery structure alive and permits a probe toward the 29,550 forty-day average and the 29,592 to 29,605 rejection band. Losing it puts 29,323 and then 29,268 in play quickly, because there is very little structure between the pivot and the first standard deviation. The New York regional manufacturing survey at 8:30 AM ET carries a 15 consensus against a 20.60 prior, a sizeable expected deceleration; a print materially below consensus would reinforce the growth-scare interpretation of today's AI story rather than offsetting it. Pre-market moves in the large semiconductor names are the single best early tell. Expected first-hour range 250 to 320 points absent a headline shock.
Afternoon Session (12:00 PM to 4:00 PM ET Tuesday)
Bias: compression with auction risk. The twenty-year bond auction at 1:00 PM ET is the first-order US event for this index tomorrow. The prior auction cleared at a 5.204 percent high yield on a 2.530 bid-to-cover, and with the ten-year already near 5 percent, a tail would push long-end yields higher into a decision the market expects to be a tightening. That combination is directly adverse for the longest-duration major index. A well-covered auction removes the immediate pressure and frees the index to drift toward the 29,500 to 29,550 area. A procedural Senate cloture vote is scheduled at 2:15 PM ET. Past 2:30 PM ET, positioning ahead of Wednesday's decision should dominate, and the practical expectation is compression rather than trend, with the 29,387 pivot as the axis. Expected range 29,300 to 29,620.
Night Session Forward (6:00 PM ET Tuesday)
Residual bias: flat to defensive. No Nasdaq-100 mega-cap is scheduled to report after Tuesday's close. Japanese trade data arrives at 7:50 PM ET with exports expected at 18.4 percent year-over-year against 23.2 percent prior. The overnight into Wednesday should be narrow, because the decision at 2:00 PM ET Wednesday dominates everything and pre-decision Globex sessions rarely commit. The live variable remains the unscheduled AI-policy stream, given the reported plan to convene AI executives this week.
Expected Range (Tuesday, September 15, Full Session)
- Low-range scenario: 29,300 to 29,620 (320 points, roughly 0.84 times the fourteen-day average daily range)
- Mid-range scenario (most likely): 29,230 to 29,670 (440 points, roughly 0.98 times the fourteen-day average true range)
- High-range scenario: 29,020 to 29,880 (860 points, roughly 1.91 times the fourteen-day average true range)
The option surface implies approximately 315 points of one-standard-deviation movement for a single session. That is a narrower measure than the mean-range scenarios above and is not directly comparable to them, so it is offered as a sizing reference rather than as evidence that the scenarios are too wide.
Most Likely Path
The most probable shape is an early probe lower toward the 29,387 pivot or the 29,323 confluence during the first hour, followed by a recovery attempt into the 29,550 to 29,605 band where the forty-day average and the derived volatility threshold sit. That band should reject on first approach given today's rejection at the same cash level and the density of averages just above it. The afternoon auction at 1:00 PM ET is the pivot of the day: a clean auction permits a grind toward 29,620, a tail sends the contract back through the pivot toward 29,268. Absent a headline, the settle most likely lands between 29,380 and 29,520, inside today's range and beneath the moving-average stack, with the market unwilling to commit before Wednesday.
7. Tuesday Economic Calendar
The overnight block opens with the Chinese data set at 10:00 PM ET Monday: industrial output with a 4.8 percent consensus against a 4.5 percent prior, retail sales at 0.8 percent against 0.6 percent, urban fixed investment at minus 7.1 percent against minus 6.7 percent, the unemployment rate at 5.2 percent, and the statistics bureau press conference alongside. London hours bring UK labour statistics at 2:00 AM ET, with the unemployment rate expected unchanged at 4.9 percent and average weekly earnings decelerating to 3.9 percent from 4.1 percent, French final consumer prices at 2:45 AM ET, German investor sentiment at 5:00 AM ET with a 40 consensus against 34.2 prior, and the eurozone trade balance at the same hour. A European central bank official speaks at 10:00 AM ET.
The US morning is light. Canadian wholesale sales and the New York regional manufacturing survey both print at 8:30 AM ET, the latter carrying a 15 consensus against a 20.60 prior. There is no US inflation, labour or consumption release tomorrow.
The US afternoon carries the session's decisive item. The twenty-year bond auction results at 1:00 PM ET, with the prior operation clearing at a 5.204 percent high yield on a 2.530 bid-to-cover. That is the single first-order event for NQ tomorrow, because the index is the longest-duration major US benchmark, the ten-year already sits near 5 percent, and the auction is the last live read on long-end appetite before Wednesday's decision. A Senate cloture vote on the Clarity Act is scheduled for 2:15 PM ET. New Zealand current account data follows at 6:45 PM ET and Japanese trade figures at 7:50 PM ET.
The forward stack is what governs positioning. The Federal Open Market Committee decides Wednesday at 2:00 PM ET, consensus 4 percent against a previous 3.75 percent, with the updated projection set released simultaneously and the press conference at 2:30 PM ET; volatility-index expiration falls the same day. US retail sales print Wednesday at 8:30 AM ET with a 0.8 percent consensus against minus 0.6 percent prior. Thursday brings the Bank of England at 7:00 AM ET, US jobless claims, housing starts and the Philadelphia regional survey at 8:30 AM ET, a ten-year inflation-protected auction at 1:00 PM ET, and the Bank of Japan at 11:30 PM ET where a move to 1.25 percent from 1 percent is expected. Friday is quarterly expiration and the last trading day of the September contract. The first-order concentration of event risk is therefore Wednesday afternoon through Friday's expiration, and there is no case for committing full size on Tuesday ahead of it.
8. Primary Trade Setup
Direction: Short
Rationale: The 29,600 to 29,670 band stacks the derived volatility threshold, today's rejected high, the five-day average, the first standard deviation, the eighteen-day and nine-day averages and pivot R1 inside seventy points, while the directional system, the composite read and the six-week cash closing low all argue the index is not yet positioned to absorb that supply on a data-light day before a policy decision.
Entry Zone: 29,600 to 29,660
Stop Loss: 29,715 (above the second standard deviation resistance at 29,705.83 and the twenty-day average at 29,708.72; acceptance there reclaims the entire short-term average stack)
Target 1 (T1): 29,387 (pivot point at 29,387.08 and the thirteen-week fifty percent retracement at 29,387.75, a two-method confluence)
Target 2 (T2): 29,323 (derived lower hedging boundary at cash 29,000 and the computed target price at 29,322.97)
Target 3 (T3, extended): 29,178 (derived modeled gamma-flip level and pivot S1 at 29,169.67; only if the auction tails and momentum extends on expanding volume)
Risk-to-Reward: From a 29,630 midpoint entry, risk is 85 points. Approximately 1:2.9 to T1, 1:3.6 to T2, 1:5.3 to T3.
Invalidation: A sustained session above 29,715, particularly a settle above the twenty-day average at 29,708.72, negates the short thesis and unlocks 29,763, then the derived gamma concentration at 29,822 and pivot R2 at 29,884.
Macro override: A materially softer New York regional survey that shifts the policy path dovish, a well-covered twenty-year auction that pulls the long end back from 5 percent, or any AI-policy headline reversing today's development-slowdown interpretation would each squeeze the heavily short leveraged-fund book and invalidate the setup intraday regardless of level.
Alternate Setup: Long on acceptance above 29,715 confirmed by a reclaim of the twenty-day average and expanding semiconductor breadth, stop 29,640 beneath the five-day average, T1 29,763, T2 29,822, T3 29,884. Reduced size only, given the Wednesday decision.
Sources and methodology
This outlook is built from our desk's session review of the December E-mini Nasdaq-100 contract, prepared after Monday's close on September 14, 2026. Computed pivot, standard-deviation and retracement levels are calculated from Monday's session high, low and settlement, and every moving-average, oscillator and range reading is Monday's.
Cash-index equivalents use the measured basis of plus 322 points, the December settlement less the cash close, and are derived rather than published pairs. The tracking-fund positioning data is dated September 12 and serves as a proxy; the cash-index positioning table is dated Monday evening. Futures positioning figures are as of September 8.
China's August activity figures, released by the National Bureau of Statistics at 10:00 PM ET Monday, were added from published reports before publication. Prices are otherwise as of Monday evening. Scenario ranges are analyst judgment; they are not statistically derived and carry no calibration.
Outlooks for ES, NQ, GC and CL are collected on the market outlook page, and our forward trading record, recomputed from the record itself, is on the performance statement.
View pricing →


