
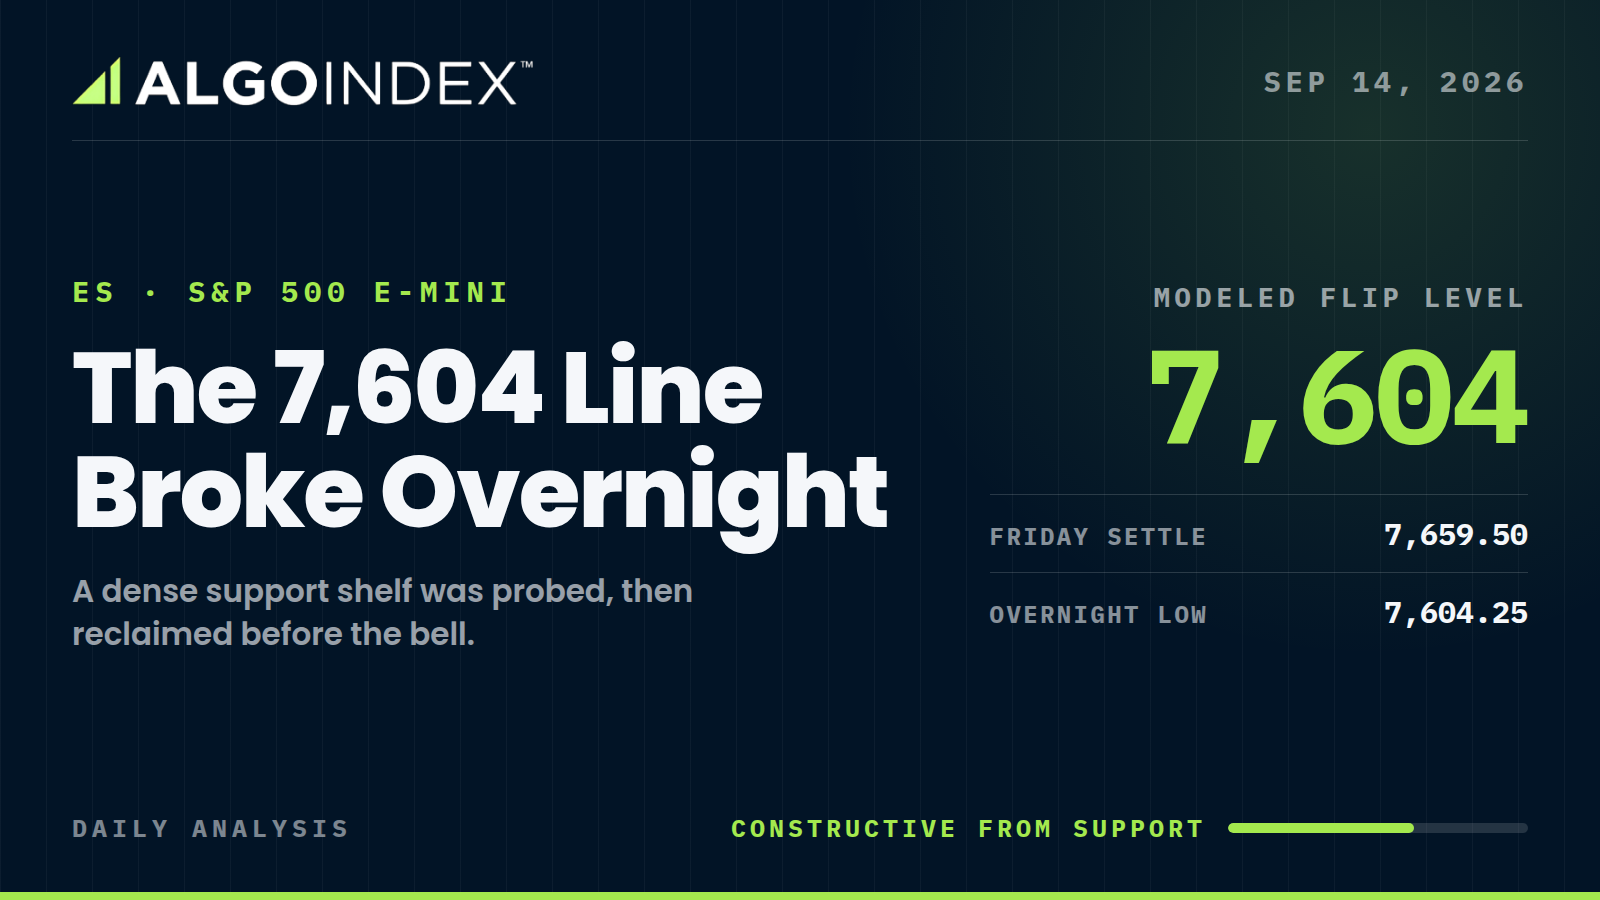
On the Sunday electronic reopen, the September E-mini opened at 7,609.25 and went straight to 7,604.25. That low printed beneath both conversions of the modeled flip level, 7,606.52 on this session's measured basis and 7,609.30 on the paired futures value published with the options flow data. Price crawled back above it into the evening. The level was breached, then bought.
Friday's contract settled at 7,659.50, a 0.83 percent advance that ended a four-day losing streak in the cash index. The reopen has handed roughly 37 points of that back, 0.48 percent beneath settlement, and parked price inside the densest support concentration on the map. My read for Monday is constructive from here. The 7,604 to 7,614 band survives its first regular-hours test, price works back toward the computed pivot at 7,645.75, and the Friday settlement pulls as a magnet above it. Small size, though. Dealer hedging amplifies movement right now, the decision lands Wednesday, and the quarterly expiration is four sessions out.
Updated at 8:15 AM ET Monday. The September contract trades 7,612.00, lower by 0.62 percent against Friday’s 7,659.50 settlement, which puts it inside the 7,604 to 7,614 band this piece was written around. Cash sits at 7,607.45. The desk’s published cash pivot of 7,590 and the 7,596 invalidation quoted below are the same line in two domains, not two separate references. Volatility has repriced: the index is 17.62, higher by 10.75 percent, so the 15 handle described later in this piece belongs to Friday and not to this morning. Two things have changed underneath. Leading artificial intelligence companies are discussing a pause in development, which is the attributed driver of the technology contract’s 1.61 percent decline against 0.62 percent here. And the dealer-positioning stack now publishes against the December contract at an offset of roughly 71.55 points to cash, while September remains the active options contract by volume and expires Friday.
Friday’s strength was built before the bell
The cash index added 65.28 points, 0.86 percent, and closed at 7,656.98. Look at where inside the day. Regular hours ran 7,636.75 to 7,677.02 and the close landed at 50.24 percent of that range, squarely mid-range. The futures close printed 73.11 percent of the 7,594.25 to 7,683.50 electronic range. The firmer part of Friday's positioning was established in the electronic session around the inflation release, not accumulated through regular-hours trade.
August core consumer prices rose 0.3 percent on the month against a 0.2 percent expectation. Headline held at 3.4 percent year over year, unchanged from July. Core eased to 2.4 percent from 2.5 percent, a five and a half year low, and equities absorbed the monthly acceleration because crude fell 2.4 percent and dragged the forward inflation impulse with it. That is the entire mechanism of Friday's advance. Remember it.
Overhead there was a lid. A roughly 12,000 lot zero-day structure at 7,680 and 7,685 capped the session and was closed near 1:00 PM ET, consistent with the cash high of 7,677.02 stalling just under it. Monday inherits the absence of that ceiling and nothing supportive in its place.
The map beneath price is thicker than the map above
We flagged the 7,604 to 7,614 confluence in the prior session's review, and overnight dealing probed it to 7,604.25 and recovered. Four independent references sit inside those ten points: the second standard-deviation support at 7,614.03, the modeled flip level published at cash 7,604 with a paired futures value of 7,609.3, the first computed support at 7,608.00, and the third standard-deviation support at 7,603.81. The overnight low slid under the flip conversions and stopped above that lower boundary.
Above the overnight quote near 7,622, the nearest references are resistance until price reclaims them: the first standard-deviation support at 7,627.35, the 50-day average at 7,636.08 and the 5-day at 7,640.55. Then the pivot at 7,645.75, then the settlement at 7,659.50. Supply thickens hard between 7,684 and 7,697, where Friday's session high at 7,683.50, the 20-day average at 7,688.98, the first standard-deviation resistance at 7,691.65 and the first computed resistance at 7,697.25 stack inside fourteen points. A first attempt higher stalls there. I would not pay for anything above that band on a data-light Monday.
The indicator set argues for range behavior over extension. The 14-day directional index reads 13.36, with negative directional movement at 23.13 against positive at 16.71, so the tilt points lower while neither side owns a trend. Relative strength runs 42.09 on the 9-day and 45.46 on the 14-day. Stochastics are the stretched piece, 17.77 percent on the 14-day raw reading and 14.64 percent on the 20-day. Both are depressed. Neither times anything on its own, but the combination rewards traders who work defined structure.
Zoom out and the correction still sits inside a longer advance. The contract is lower by 101.50 points over five sessions and 184.50 over one month, yet higher by 123.00 over three. The one-month low of 7,585.50 came on September 10, and the overnight low has surrendered most of Friday's rebound.
Everyone bought protection into a green day
Negative 17 billion dollars of total delta in the cash index, on a session that rose 0.86 percent. Participants bought puts and sold zero-day calls into strength. That is the most informative number in the positioning set, because it records what the accounts with size did with a rally handed to them.
Hedging flow works against stability from here. The gamma index reads negative 1.615 in the cash index and negative 0.793 in the principal tracking fund, with market-maker gamma notional at negative 472.471 million dollars and negative 1.954 billion, and gamma tilt at 0.902. Dealer flows amplify direction in that configuration. The asymmetry around 7,604 to 7,614 follows directly: a hold permits an orderly grind back toward the pivot, while a decisive loss invites acceleration through the positioning concentrations from 7,614 down to 7,554.
This is an established position. Friday's options volume ran 755,010 calls against 980,642 puts, a ratio of 1.299, while open interest stands at 10.32 million calls against 14.499 million puts, a ratio of 1.405. An open-interest ratio above the volume ratio says the put-heavy configuration has been carried a while, and the 25-delta risk reversal at negative 0.054 agrees. Futures data through September 8 shows speculators adding 29,085 contracts of net short to 336,643, while fund managers cut net length by 19,683 to 907,770. Both sides trimmed into the decision. Roughly 35 percent of total United States options exposure rolls off by Friday's expiration.
Crude took back the reason Friday worked
October crude settled Friday at 100.05, lower by 2.43 dollars or 2.37 percent, after Thursday's 6.7 percent surge to a three and a half month high. A demand warning drove the decline. The same report raised this year's estimated global supply deficit to 1.7 million barrels per day from 1.3 million and pushed the return to surplus out to 2027. Across the weekend crude has added 2.76 dollars, 2.76 percent, to trade near 102.81, pressing back toward Friday's high of 104.46, a fresh 52-week high.
Now read that against the headlines. Saudi Arabia's foreign ministry said Friday afternoon it had chosen not to retaliate at that stage following a request from Iraq's prime minister, and a regional meeting scheduled for Monday in Oman was postponed Sunday afternoon. Crude rose anyway. Tactically the conflict has paused, and the oil price says the energy market is not treating that pause as durable. A continuation through 104.46 re-establishes the inflation impulse Friday's advance was predicated on being relieved, and it kills the mean-reversion case irrespective of the level map.
Volatility is priced off the wrong weekend. Friday's volatility index closed at 15.84, down roughly 11 percent and back to a 15 handle, with the volatility-of-volatility index falling 11 points to 91 and short-dated fixed-strike volatility off 3 to 4 points. That reset happened before crude reversed. Treat it as stale.
Wednesday is the event. Implied odds of a rate increase at the September 16 meeting ran between 85 and 88 percent through Friday, up from roughly 69 to 75 percent before the inflation print, and it would be the first increase in three years. The projections that accompany it carry more information than the move. Monday has no United States releases, only Canadian consumer prices and manufacturing sales at 8:30 AM ET and routine 13-week and 26-week bill auctions at 11:30 AM ET, leaving the 9:30 AM ET open as the day's only first-order event. Watch the spread. The technology contract is lower by 1.27 percent overnight against 0.48 percent for the broad index, and if that gap survives into cash trade, the large-cap names that carried Friday are rotating out from under the index.
Four references inside ten points, and one of them already gave way once.
The complete data picture
Every number behind the session, charted first, then the full level map, then the complete numeric reference underneath.
| Resistance, top down | Support, top down |
|---|---|
| 7,786.50SPX 7,783.98 - third computed resistance, extended objective | 7,614.03SPX 7,611.51 - 2 Standard Deviation Support, upper edge of the confluence |
| 7,735.00SPX 7,732.48 - second computed resistance | 7,609.30SPX 7,604.00 - modeled gamma-flip level, source published pair, anchored to the September 10 reference |
| 7,715.19SPX 7,712.67 - 3 Standard Deviation Resistance | 7,608.00SPX 7,605.48 - Pivot S1 |
| 7,697.25SPX 7,694.73 - Pivot R1, upper edge of the supply band | 7,603.81SPX 7,601.29 - 3 Standard Deviation Support, overnight low tested here |
| 7,688.98SPX 7,686.46 - 20-day moving average, primary overhead reference | 7,594.25SPX 7,591.73 - Friday session low, last line before conditions deteriorate |
| 7,683.50SPX 7,680.98 - Friday session high | 7,556.50SPX 7,553.98 - Pivot S2, downside objective on failure |
| 7,659.50SPX 7,656.98 - Friday settlement, prior close magnet | |
| 7,645.75SPX 7,643.23 - Pivot Point, first objective on recovery | |
| 7,640.55SPX 7,638.03 - 5-day moving average, overhead until reclaimed | |
| 7,636.08SPX 7,633.56 - 50-day moving average, first reclaim objective | |
| 7,627.35SPX 7,624.83 - 1 Standard Deviation band, sits above the overnight quote and acts as resistance until reclaimed |
Full numeric reference, every remaining figure from the session review
Executive Summary
The last completed regular-hours session was Friday, September 11. The S&P 500 cash index settled at 7,656.98, higher by 65.28 points or 0.86 percent, reversing a four-day losing streak. The September E-mini contract settled at 7,659.50, an advance of 0.83 percent. The move was not driven by an inflation surprise in the constructive direction. August core consumer prices rose 0.3 percent month over month against expectations of 0.2 percent, a firmer print, while the headline rate of 3.4 percent year over year was unchanged from July and matched expectations. Core at 2.4 percent year over year eased from 2.5 percent and marked a five and a half year low. Equities advanced anyway, supported principally by a 2.4 percent decline in crude oil that relieved the forward inflation impulse.
The dominant driver into the coming week is monetary policy. Market-implied odds of a Federal Reserve rate increase at the September 16 meeting rose through Friday's session, with intraday snapshots placing the figure between 85 and 88 percent depending on the timestamp. This would be the first increase in three years. The distribution of outcomes is therefore unusually two-sided for an event that is nominally well telegraphed, because the question that matters to forward pricing is not whether the Committee moves on Wednesday but what the accompanying projections imply about the path beyond it.
The structural contradiction heading into Monday is the divergence between Friday's closing strength and the overnight repricing. Friday's contract settled at 73.11 percent of its session range, a firm close. The Sunday electronic reopen has undone a substantial portion of that: the contract opened at 7,609.25 and has traded a 7,604.25 to 7,625.75 band, marking roughly 37 points, or 0.48 percent, below the Friday settlement. That places price directly into a dense confluence of support running from approximately 7,604 to 7,614, and has already traded marginally beneath the modeled level below which dealer hedging conditions shift from stabilizing to amplifying, recovering above it into the evening.
The Primary Setup is a long from the 7,604 to 7,614 confluence shelf, targeting a recovery toward the computed pivot at 7,645.75 and the Friday settlement magnet at 7,659.50, with invalidation on sustained acceptance below 7,596.
## 1A. Monday Pre-Market Refresh (8:15 AM ET, 2026-09-14)
This section is an additive update captured at 8:15 AM ET on Monday, September 14, and it supersedes any figure below it that has since gone stale. Nothing in sections 2 through 9 has been rewritten or removed. That material remains the audited record of what was known when this review was prepared on Sunday evening, and where a number here conflicts with a number there, the number here governs.
Verified front month. ES1!, the CME S&P 500 E-mini September '26 contract, trades 7,612.00, lower by 0.62 percent. Friday's settlement was 7,659.50, so the decline is 47.50 points. The arithmetic reconciles in both directions: 7,659.50 multiplied by 0.9938 gives 7,612.0, and 47.50 divided by 7,659.50 is 0.62 percent. The Sunday overnight band of 7,604.25 to 7,625.75 described in section 1 has held through the pre-market, with price now sitting in the middle of it.
Domain caution. The options flow data publishes a header quoted as "^SPX" at 7,607.45, lower by 49.20 points or 0.64 percent. That is the cash index, not this contract. The instrument reviewed in this file is ES1!, the September E-mini future, and it trades 4.55 points above cash this morning. The same dashboard carries a header labelled "Gold" that is spot metal rather than the December futures contract, which is noted here only to establish that its headers are not futures quotes. Every level stated below carries its domain explicitly, and no cash reference is set against a futures reference without the basis being given.
Where the published setup actually stands. Section 8 published a long from 7,604 to 7,614, stop 7,589, invalidation 7,596. ES1! at 7,612.00 is inside that entry zone. The desk's published cash pivot of 7,590 converts to roughly 7,592.5 on the September basis of plus 2.52 used throughout this review, which means the published invalidation and the desk pivot are the same line expressed in two domains rather than two separate references. The setup is live and price has arrived at it. Note for completeness that the observed spread between ES1! at 7,612.00 and cash at 7,607.45 is 4.55 points this morning, wider than the plus 2.52 measured on Sunday, so conversions computed on the Sunday basis are approximate to within roughly two points.
What changed in the macro picture. Two items, neither of which appears in the Sunday analysis. First, the volatility index is 17.62, higher by 1.71 points or 10.75 percent, against Friday's close of 15.84. Any description in this file of a 15 handle on volatility is now stale. Second, a new catalyst: leading artificial intelligence companies are discussing a pause in development, and that is the attributed driver of this morning's technology underperformance, with the Nasdaq contract off roughly 150 basis points against 60 for the broad market. Rising crude is the accompanying pressure, which is the same macro override section 8 identified, and the October crude contract at 103.09 is higher by 3.04 percent. The key dates remain the September 16 volatility expiry and policy decision and the September 18 quarterly expiration, with traders pricing 86 percent odds of an increase on Wednesday.
Contract basis for the positioning data. The dealer-positioning stack is now published against the December contract at a reference of 7,727.55, set against the cash index at 7,656, an offset of roughly plus 71.55. This review is written on September. September remains the active options contract by volume this week: the options flow data shows the September futures option at 132M of volume against 7.7M for December. September expires this Friday, September 18. Every December level quoted below is therefore converted to cash by subtracting 71.55 before any comparison is drawn.
Updated positioning stack and the desk thesis. On the December contract, the modeled volatility threshold is 7,736.55 (cash 7,665), modeled gamma-flip level 7,683.55 (cash 7,612), the call wall 7,871.55 (cash 7,800), the put wall 7,571.55 (cash 7,500) and the primary gamma concentration 8,071.55 (cash 8,000). On the cash index the gamma index reads 0.707, gamma tilt 1.043, gamma notional $113.458M and the 25 delta risk reversal minus 0.044, with an implied one-day move of 0.52 percent and an implied five-day move of 1.26 percent. Put volume of 1.132M runs against call volume of 728.823K, and put open interest of 14.447M against call open interest of 10.31M. The desk's published thesis is stated in the cash domain: pivot 7,590, bearish below and bullish above; resistance 7,625 and 7,700; support 7,600 and 7,350. Below cash 7,600 the environment is described as pure negative gamma, with 7,350 the downside reference if 7,600 gives way, and the desk states it is looking to add short exposure if cash breaks 7,590. Converting on this review's September basis of plus 2.52, cash 7,600 is approximately 7,602.5 and cash 7,350 approximately 7,352.5 in this contract's domain. Cash at 7,607.45 sits 4.55 points beneath the cash modeled gamma-flip level reference of 7,612 and 7.45 points above the desk's 7,600 support, so the market is trading in the narrow band between the two. Key cash strikes are 8,000, 7,700, 7,600 and 7,000.
Institutional flow. Index protection demand is the organising feature of this morning's flow report, which is headlined on escalating hedging demand in the broad-market tracking fund as technology pressures futures. Net delta in the broad-market tracking fund is minus $1,483.4M, at the 5th percentile, with gamma of $1,426.0M at the 92nd percentile. Index ETF net short delta overall is minus $7,748.7M, driven by put unwind and protection buying, with the Nasdaq tracking fund carrying moderate short delta and the small-cap fund showing positive gamma of $95.43M. The pre-market prints listed this morning are: a cash-index 7,350 put expiring February 2027 bought for $513K, which aligns directly with the desk's 7,350 downside reference; cash-index 7,615 puts for September 15 sold twice, at $533K and $580K; cash-index 7,625 puts for September 18 sold at $1.1M; and a cash-index 7,680 put and call for December 18 bought and sold as a spread at $3.9M and $3.7M. Among the largest index position changes recorded for September 11 are 730 puts on the broad-market tracking fund for September 18 bought to close at 64,897, its 743 puts for September 18 sold to close at 22,180, its 760 puts for September 25 bought to open at 17,318, cash-index 7,850 calls for September 14 bought to open at 17,566, and 275 puts on the small-cap fund for October 16 bought to open at 35,869 against its 274 puts sold to close at 30,023.
Price Action & Technical Structure
2.1 Intraday and Session Review
Friday's September contract traded a session range of 89.25 points, from 7,594.25 to 7,683.50, settling at 7,659.50. The close sat at 73.11 percent of that range, indicating buyers retained control into the settlement window. The cash index traded a considerably narrower regular-hours band of 40.27 points, from 7,636.75 to 7,677.02, which is 0.53 percent of the session low. The two figures describe different windows and should not be compared directly: the futures range spans the full electronic session including the pre-dawn reaction to the consumer price release, while the cash range covers only 09:30 AM to 04:00 PM ET. Within the cash window the index closed at 50.24 percent of its range, a mid-range positional read that sits well beneath the 73.11 percent futures close, and the gap between the two is the detail worth carrying forward: the firmer part of Friday's positioning was established in the electronic session around the consumer price release rather than accumulated through regular-hours trade.
The desk note for Friday evening records that a large zero-day expiry structure of roughly 12,000 lots at 7,680 and 7,685 acted as the session's effective ceiling and that this position was closed near 01:00 PM ET. That is consistent with the cash high of 7,677.02 stalling just beneath the structure.
The Sunday electronic reopen is the more important near-term event. The contract opened at 7,609.25 against the Friday settlement of 7,659.50, a gap of 0.66 percent measured open to previous. It has since traded between 7,604.25 and 7,625.75. This is an overnight repricing and not a regular-hours move; it should not be characterized as Monday's session direction, which has not yet occurred.
2.2 Daily Structure
The broader daily picture is one of a market in a corrective phase within a longer advance. The September contract registered its 52-week high at 7,838.50 on August 13 and a one-month high of 7,824.50 on August 17. It has made lower highs since. The one-month low of 7,585.50 was established on September 10, one session before Friday's rebound. Friday's advance therefore originated from a test of the monthly low and recovered roughly 74 points from it.
Over the trailing five sessions the contract is lower by 101.50 points, or 1.31 percent, having opened that window at 7,722.00 and printed a period high of 7,728.50 on September 8. Over one month it is lower by 184.50 points, or 2.36 percent. Over three months it remains higher by 123.00 points, or 1.64 percent. The market is correcting within an uptrend rather than reversing it, a distinction that matters for how support tests should be treated.
Position within the daily range is currently poor. The overnight low of 7,604.25 sits only 18.75 points above the Friday session low of 7,594.25, meaning the Sunday session has already retraced most of Friday's recovery.
2.3 4-Hour and Swing Structure
The swing sequence since mid-August is a clear series of lower highs: 7,838.50 on August 13, 7,824.50 on August 17, then 7,728.50 on September 8. The corresponding low sequence is less decisively lower, with 7,585.50 on September 10 representing the operative swing low. A sustained break beneath that level would extend the lower-high sequence into a lower-low confirmation and open the 7,556.50 and 7,518.75 computed supports.
Retracement structure from the 13-week range places the 38.2 percent level at 7,641.96 and the 50 percent level at 7,581.25. Price is presently between those two, which is a neutral location offering no directional edge on retracement grounds alone. The 38.2 percent retracement measured from the four-week low sits at 7,676.80 and aligns closely with Friday's cash high, reinforcing that area as the nearer structural ceiling.
The oscillator matrix on the swing timeframes is uniformly compressed toward the lower end without being extreme, which is a configuration more often associated with mean reversion than with continuation.
2.4 Moving Averages
The moving-average stack is arranged as follows against the current overnight quote near 7,622:
| 5-day | 7,640.55, price below by approximately 18 points |
| 20-day | 7,688.98, price below by approximately 67 points |
| 50-day | 7,636.08, price below by approximately 14 points |
| 100-day | 7,553.43, price above by approximately 69 points |
| 200-day | 7,254.66, price above by approximately 367 points |
The configuration is short-term bearish and long-term constructive. Price sits beneath the 5-day, 20-day and 50-day averages while holding comfortably above the 100-day and 200-day. The 20-day average at 7,688.98 is the significant overhead reference, and it now coincides closely with Friday's session high of 7,683.50 and the first computed resistance at 7,697.25, forming a meaningful band of supply between roughly 7,684 and 7,697.
Notably, the Friday settlement of 7,659.50 was above the 50-day average while the current overnight quote is below it. The 50-day at 7,636.08 is therefore the first meaningful reclaim objective on any recovery attempt.
2.5 Oscillator and Trend Readings
Relative strength readings are neutral to soft: 42.09 on the 9-day, 45.46 on the 14-day, and 48.02 on the 20-day. None is at an extreme. The 14-day figure declined 3.28 points on the session.
Stochastic readings are considerably more stretched. The 14-day raw stochastic is 17.77 percent, with %K at 20.64 percent and %D at 20.14 percent. The 20-day raw reading is 14.64 percent. These are depressed levels that historically coincide with exhaustion of downside momentum rather than its continuation, though they can persist during sustained declines and are not a timing instrument on their own.
Trend strength is the most informative element of this matrix. The 14-day directional index reads 13.36, with positive directional movement at 16.71 and negative at 23.13. A directional index beneath roughly 20 indicates the absence of a definable trend. The negative directional component exceeds the positive, so what directional tilt exists is downward, but the low index value argues that neither side has established control. This is range-consistent behavior, not trend-consistent behavior, and it supports treating well-defined support and resistance as actionable rather than expecting clean directional extension.
Historic volatility on the 14-day window is 8.88 percent, against 8.56 percent on the 20-day and 11.08 percent on the 50-day. Realized movement has been compressing.
The composite trend indicator registers a hold. The aggregated multi-indicator opinion stands at 16 percent sell with signal strength described as minimum and direction weakening. That aggregate has deteriorated sharply over the month, having read 100 percent buy one month ago and 40 percent buy one week ago. The long-term component remains 67 percent buy while the short-term component is 60 percent sell, which is a further expression of the same short-versus-long divergence visible in the moving-average stack.
2.6 Volatility and Expected Range
Average true range measurements:
| 9-day | 69.08 points, 0.91 percent |
| 14-day | 71.00 points, 0.93 percent |
| 20-day | 74.16 points, 0.97 percent |
| 50-day | 82.99 points, 1.09 percent |
Average daily range measurements: 69.72 on the 9-day, 63.82 on the 14-day, and 63.55 on the 20-day.
The options-derived expectation is materially informative here. The options-flow surface publishes an implied one-day move of 0.50 percent for the cash index, producing a band from 7,624.14 to 7,700.76. That band is 76.62 points wide. Measured against the 14-day average true range of 71.00 points, the implied band is 1.079 times one average true range, and measured against the 14-day average daily range of 63.82 it is 1.201 times. The options market is therefore pricing Monday at approximately one average range, slightly wider, which is a neutral expectation rather than a compressed or expanded one.
The implied five-day move is 1.32 percent, which spans the Wednesday policy decision and the Friday quarterly expiration. At-the-money implied volatility for the policy-decision expiry stands at 11.0 percent and for the expiration at 12.4 percent, corresponding to daily moves of 69 and 78 basis points respectively. One-month realized volatility is 8.7 percent. Traders are paying a clear premium over realized movement for the event window, which is ordinary ahead of a policy decision of this character but does establish that a simple volatility-selling posture into Wednesday is a crowded expression.
Key Levels
Levels are quoted in the September E-mini domain with cash-index equivalents in parentheses. The equivalents use the basis measured for this session, namely the Friday settlement of 7,659.50 against the cash close of 7,656.98, or plus 2.52 points. Where the options-flow surface publishes its own paired futures and cash values, those pairs are quoted verbatim and identified as such, because that source carries its own offset of plus 5.3 points rather than the basis measured here. The two should not be conflated, and a change in basis is not permitted to move a source-published cash value.
3.1 Resistance
The immediate overhead reference is the computed pivot point at 7,645.75 (cash 7,643.23), which price is currently beneath and which becomes the first objective on any recovery. Immediately above that sits the Friday settlement at 7,659.50 (cash 7,656.98), a prior-close magnet that frequently attracts price in the absence of a directional catalyst, and which on a data-light Monday carries more weight than usual.
Above the settlement, supply thickens considerably. Friday's session high at 7,683.50 (cash 7,680.98) marks the top of the completed session and sits just beneath the 20-day moving average at 7,688.98 (cash 7,686.46). The first standard-deviation resistance at 7,691.65 (cash 7,689.13) and the first computed resistance at 7,697.25 (cash 7,694.73) complete a band of roughly fourteen points containing four separate references. That 7,684 to 7,697 area is the principal barrier to any sustained recovery and is where a first attempt higher would be expected to stall.
Beyond it, the second standard-deviation resistance at 7,704.97 (cash 7,702.45) and third at 7,715.19 (cash 7,712.67) bracket the upper end of the statistically ordinary range. The options-flow surface publishes near-term resistance in the cash domain at 7,675 and 7,700, which corroborates the same zone from a positioning rather than a price-structure basis.
The second computed resistance at 7,735.00 (cash 7,732.48) and third at 7,786.50 (cash 7,783.98) are extended objectives requiring a catalyst. The primary call side ceiling is published by the source as cash 7,800 with a paired futures value of 7,805.3, and the primary gamma concentration as cash 8,000 paired with 8,005.3. Both are distant and act as structural rather than tactical references this week. Both of those sit on listed strikes.
3.2 Support
The immediate support complex is unusually dense and is the defining feature of Monday's map. Working down from current price: the 5-day moving average at 7,640.55 (cash 7,638.03) and the 50-day moving average at 7,636.08 (cash 7,633.56) are the first two references, both currently overhead of the overnight quote and therefore functioning as resistance until reclaimed.
Beneath price, the first standard-deviation support at 7,627.35 (cash 7,624.83) sits just under the overnight high of 7,625.75 (cash 7,623.23). The second standard-deviation support at 7,614.03 (cash 7,611.51) begins the critical zone.
The critical zone itself spans roughly 7,604 to 7,614 and contains four independent references within ten points: the second standard-deviation support at 7,614.03; the modeled gamma-flip level, published by the source as cash 7,604 with a paired futures value of 7,609.3; the first computed support at 7,608.00 (cash 7,605.48); and the third standard-deviation support at 7,603.81 (cash 7,601.29). The overnight low of 7,604.25 (cash 7,601.73) has traded beneath both conversions of the modeled flip level, at 7,606.52 on this session's measured basis and at 7,609.30 on the source's own pair, while holding above the third standard-deviation support at 7,603.81 that forms the band's lower boundary. This confluence is the most defensible support on the map and is the basis for the Primary Setup below.
The modeled gamma-flip level is a modeled underlying-price threshold produced by the provider's model rather than a listed option strike, and no contract need exist at that price. It is quoted here at the source's published pair as of the Friday evening edition and moves as positioning changes.
Below the critical zone, Friday's session low at 7,594.25 (cash 7,591.73) and the modeled directional pivot, published by the source as cash 7,590 and last updated September 10, sit within three points of one another and form the final line before conditions deteriorate materially. The source states that forward from its most recent update, cash levels beneath 7,600 represent an environment of purely amplifying dealer hedging, and that a break of that area would make a move toward cash 7,350 reasonable. That is the source's stated view rather than a measured quantity, and it is recorded here as such.
Further down, the one-month low at 7,585.50 (cash 7,582.98), the 50 percent retracement of the 13-week range at 7,581.25 (cash 7,578.73), the second computed support at 7,556.50 (cash 7,553.98) and the third computed support at 7,518.75 (cash 7,516.23) mark the downside objectives should the critical zone fail. The primary put side support base is published by the source as cash 7,500 paired with a futures value of 7,505.3, and sits on a listed strike.
Macro Drivers
4.1 Dollar, Rates, and Fed Policy
This is the first-order driver and overwhelms the others this week. The August consumer price report released Friday at 08:30 AM ET delivered a core monthly rate of 0.3 percent against a 0.2 percent expectation. Headline year over year held at 3.4 percent, matching expectations and unchanged from July, while core year over year eased to 2.4 percent from 2.5 percent, a five and a half year low. The composition matters: the monthly core acceleration is what moved policy expectations, while the annual core deceleration is what allowed equities to absorb the print without damage.
Market-implied odds of an increase at the September 16 meeting rose materially on the release. Intraday snapshots through Friday placed the figure at 85, 86 and 88 percent at different timestamps; the direction of travel was consistently higher, from roughly 69 to 75 percent before the print. An increase would be the first in three years. Press commentary published Friday emphasized that policy cycles of this kind rarely consist of a single move, which is the substantive question for duration and for equity multiples: the Summary of Economic Projections accompanying Wednesday's decision will carry more information than the decision itself.
The dollar index rose 0.06 percent on Friday, a marginal move, supported by the rate differential implication of the print. The ten-year note yield closed slightly higher, having initially declined on the crude oil decline before the inflation data reasserted itself into the close. Producer prices released September 10 came in at 5.4 percent year over year against a 5.3 percent expectation, with the prior revised up to 4.8 percent from 4.7 percent, a further firm reading. The August employment report on September 4 delivered 162,000 against a 55,000 expectation, with the prior revised to positive 21,000 from negative 23,000. The cumulative data set over the past two weeks has been consistently firmer than expected across activity and prices, which is the coherent explanation for the repricing.
4.2 Large-Cap Leadership and Earnings
Single-stock positioning was constructive on Friday even as index-level hedging turned defensive. The options-flow surface recorded approximately positive 1.3 billion dollars of total delta in single stocks on the session, concentrated in the largest technology names. Most of that group traded higher, led by two names advancing roughly 2 percent each. Specific flow highlighted included substantial opening call purchases in October-dated contracts on those two names, with the options themselves appreciating 27 and 22 percent on the session.
This divergence between constructive single-stock flow and defensive index flow is a genuine feature of the current environment rather than noise. It suggests participants are expressing selective upside while hedging aggregate exposure, a configuration that tends to support relative outperformance of large-cap leadership if the index holds, and to offer no protection if it does not.
The earnings calendar for Monday is empty of first-order reports. That absence is itself relevant, because it removes a potential source of idiosyncratic support or pressure and leaves the session dependent on positioning and policy anticipation.
4.3 Geopolitical Backdrop
The active conflict between the United States and Iran continues to be the principal non-policy variable, and its transmission to equities runs through crude oil and from there through the inflation impulse and the rate path.
The weekend developments were de-escalatory at the margin. Saudi Arabia's foreign ministry stated Friday afternoon that it had chosen not to retaliate at that stage following a request from Iraq's prime minister. Iraq stated it rejects attacks threatening Saudi security, appreciated the Saudi decision to hold off, and has ordered an investigation into the attacks. A regional meeting scheduled for Monday in Oman was postponed Sunday afternoon, described as being in the interest of consensus. Iran's foreign ministry stated that its strikes have been directed at the source of attacks rather than at countries, and separately indicated that several states backing an adverse resolution at the international atomic agency would face consequences. Reporting also indicated that negotiations are not possible until Iranian conditions are accepted.
The net assessment is a conflict that has not de-escalated structurally but has paused tactically. Crude's behavior across the weekend contradicts the de-escalatory headlines, which is discussed in section 4.5 and constitutes the principal cross-asset warning for Monday.
4.4 Sector Breadth and Rotation
Friday's advance was broad at the index level. The S&P 500 rose 0.86 percent, the Dow Jones Industrial Average rose 0.98 percent, and the Nasdaq 100 rose 0.91 percent. The near-uniformity across capitalization and style suggests an index-level relief move driven by the crude decline rather than a rotation.
This section rests on index-level aggregates rather than on a direct measurement of advancing versus declining issues or of sector-level attribution, neither of which was captured in this run. The breadth characterization above should therefore be treated as inference from index behavior rather than as a measured breadth reading.
The overnight session shows a meaningful divergence that was not present Friday. The Nasdaq 100 contract is lower by 1.27 percent while the S&P 500 contract is lower by 0.48 percent. Technology is leading the overnight decline by a wide margin, roughly two and a half times the broad index in percentage terms. If that persists into the cash session it would represent a genuine rotation away from the leadership that carried Friday, and it would undermine the single-stock flow constructiveness described in section 4.2.
4.5 Cross-Asset and Volatility
Crude oil is the critical cross-asset signal and it has reversed hard.
October crude settled Friday at 100.05, lower by 2.43 dollars or 2.37 percent, after Thursday's 6.7 percent advance to a three and a half month high. The Friday decline followed an International Energy Agency warning that elevated prices and restricted supply would produce the largest drop in global oil demand since the pandemic. That same agency simultaneously raised its estimate of this year's global supply deficit to 1.7 million barrels per day from 1.3 million, and delayed its expected return to surplus until 2027 from late 2026. The demand warning drove Friday's price action; the deficit revision is the more consequential fact.
Across the weekend reopen, crude has advanced 2.76 dollars, or 2.76 percent, to trade near 102.81. Friday's high of 104.46 was a fresh 52-week high. Crude is therefore recovering the entirety of Friday's decline and pressing back toward a one-year high, despite the de-escalatory diplomatic headlines described in section 4.3.
This matters directly for equities. Friday's equity advance was explicitly attributed to the crude decline easing inflation concerns. That support has been withdrawn overnight. The coincidence of crude reversing higher and equity futures gapping lower is internally consistent and is the most coherent single explanation for the overnight repricing.
Volatility reset ahead of the weekend. The volatility index declined roughly 11 percent to close at 15.84, returning to a 15 handle, and the volatility-of-volatility index fell 11 points to close at 91. Fixed-strike volatility collapsed across short-dated tenors, with expiries of two days or less falling 3 to 4 volatility points. That reset occurred before the crude reversal and should be regarded as stale relative to current conditions.
4.6 Institutional Positioning
Aggregate index positioning is defensive and has become more so.
The options-flow surface recorded negative 17 billion dollars of total delta in the cash index on Friday, driven by a combination of put buying and zero-day call selling. That combination, occurring on a day the index rose 0.86 percent, is the single most informative positioning fact available: participants used strength to add downside protection and to monetize upside, rather than to chase.
The gamma index for the cash index reads negative 1.615 and for the principal tracking fund negative 0.793. Gamma notional for market makers is negative 472.471 million dollars in the cash index and negative 1.954 billion in the tracking fund. Gamma tilt reads 0.902 for the cash index. Negative dealer gamma means hedging flows amplify directional movement rather than dampening it, which raises the expected magnitude of any move that develops and is the mechanical reason the area beneath cash 7,600 is treated as consequential.
Options volume on Friday ran 755,010 calls against 980,642 puts, a put-to-call volume ratio of 1.299. Open interest stands at 10.32 million calls against 14.499 million puts, a ratio of 1.405. Both ratios are skewed toward puts, and the open-interest ratio exceeding the volume ratio indicates the put-heavy configuration is an established position rather than a single session's activity. The 25-delta risk reversal at negative 0.054 corroborates a persistent bid for downside protection.
Futures positioning data as of September 8 shows equity fund speculators increasing their net short position in the cash-index contract by 29,085 contracts to 336,643, while equity fund managers cut their net long position by 19,683 contracts to 907,770. Both moves are in the same direction: reduced net length and increased net short exposure ahead of the policy decision.
The quarterly expiration on Friday, September 18 is a structural consideration of the first order. Roughly 35 percent of total United States options exposure is scheduled to expire between now and that date. Large expirations of this character can act as a catalyst for expanded movement as positions that currently pin price are removed, and the interaction of that expiration with a policy decision two days prior is the defining feature of the week.
SPX Options Flow Context
This section is the primary flow surface for the E-mini contract rather than a proxy, because the cash index options complex is the instrument against which E-mini exposure is hedged. The readings below are drawn from the desk note published Friday, September 11 at 05:27 PM ET, and from the associated positioning dataset captured in the same session.
A provenance qualification applies to the level table and is material. The reference prices carried in that table are cash 7,591 and 7,596.3 in the September futures domain. The cash figure corresponds to the September 10 close of 7,591.70 rather than to Friday's close of 7,656.98, which means the published level set and the source's own plus 5.3 offset are anchored to the September 10 reference, not to Friday's settlement. The same pattern holds in the technology index, where the source's reference of 29,103 matches that index's September 10 close of 29,103.51. The narrative portion of the note is current to Friday's close; the level table is anchored one session earlier. These modeled levels are not permanently fixed and move as positioning changes, so the anchoring date is stated wherever the levels are used below, and the measured basis for this session is never used to move a source-published cash value.
The dealer positioning stack in the cash domain, with the source's own paired futures values where published:
| Primary gamma concentration | 8,000 cash, paired 8,005.3 futures, listed strike |
| Primary call side ceiling | 7,800 cash, paired 7,805.3 futures, listed strike |
| Modeled volatility threshold | 7,655 cash, paired 7,660.3 futures, modeled level |
| Modeled gamma-flip level | 7,604 cash, paired 7,609.3 futures, modeled level |
| Primary put side support base | 7,500 cash, paired 7,505.3 futures, listed strike |
| Modeled directional pivot | 7,590 cash, updated September 10 |
The modeled volatility threshold at cash 7,655 is the most immediately relevant of these. The Friday cash close of 7,656.98 finished 1.98 points above it, effectively astride the level. The current overnight futures quote near 7,622 translates to approximately cash 7,619.98 on this session's measured basis, which is roughly 35 points beneath that threshold. Price has moved from balanced on the threshold to clearly beneath it across the weekend reopen, which is a deterioration in the mechanical support conditions.
The modeled gamma-flip level at cash 7,604 is the pivotal reference. On this session's measured basis of plus 2.52 it corresponds to approximately 7,606.52 in the futures domain; the source's own paired value is 7,609.3, reflecting its offset of plus 5.3. The overnight low of 7,604.25 sits beneath both of those conversions, by 2.27 points against the measured-basis conversion and by 5.05 points against the source's own pair. Price has therefore traded marginally through the flip level in overnight dealing and has since recovered above it, so the level has been breached rather than defended, and the regular-hours reaction to it is what settles the question.
Gamma tilt at 0.902 with gamma notional at negative 472.471 million dollars describes a market where dealer hedging amplifies rather than dampens movement. The practical implication for Monday is asymmetric: a hold of the 7,604 to 7,614 confluence permits an orderly recovery toward the pivot and prior settlement, whereas a decisive loss of it invites acceleration rather than a measured decline.
Zero-day flow attribution on Friday showed call selling as the dominant contributor on that tenor, paired with longer-dated put buying. The net negative 17 billion dollars of delta on a positive session is the clearest available expression of cautious positioning into Wednesday. The 12,000-lot zero-day structure at 7,680 and 7,685 that capped the session was closed around 01:00 PM ET, which removes that specific ceiling for Monday but does not replace it with a supportive position.
Combination-strike conviction scores in the cash domain identify dense concentrations beneath current price at 7,614 scoring 95.02, 7,599 scoring 96.83, 7,592 scoring 92.58, 7,577 scoring 96.28, 7,561 scoring 96.20 and 7,554 scoring 99.46. Above price, concentrations appear at 7,622 scoring 91.42, 7,652 scoring 89.27, 7,675 scoring 87.76 and 7,683 scoring 87.07. These are conviction scores produced by the provider's model and are not calibrated probabilities. The density of high-scoring concentrations immediately beneath price between 7,554 and 7,614 is notable and indicates substantial positioning interest through the zone that would be traversed if the flip level fails.
Forecast
Scenario weightings below represent discretionary analyst judgment. They are not statistically derived and carry no calibration.
Night Session (6:00 PM ET Sunday, September 13 to 3:00 AM ET Monday, September 14, Globex/Asia)
Bias is cautiously constructive from the current level, with the qualification that the session is already well advanced and has established its character. The contract reopened at 7,609.25, traded down to 7,604.25 and has recovered to the 7,620 area. The overnight low of 7,604.25 traded beneath the modeled flip conversions at 7,606.52 and 7,609.30 before recovering, so the confluence has been probed rather than cleanly defended.
The principal overnight catalysts are Chinese activity data at 10:00 PM ET Monday, which falls outside this window, and any incremental development in the Gulf. Crude's behavior is the variable to watch: continued strength there argues for renewed pressure on equity futures.
Expected range for the remainder of the window is 7,600 to 7,635.
London Session (3:00 AM to 8:00 AM ET Monday, September 14)
Bias is neutral. The European calendar for Monday is thin, carrying only Swedish inflation data at 02:00 AM ET, which is not a driver for United States index futures. European participants will be positioning for the Wednesday policy decision rather than responding to domestic data.
The dollar cross-read is the relevant channel. A dollar that extends Friday's marginal gain on rate-differential grounds would apply mild pressure to the index. Absent a crude escalation, the London window is likely to be a consolidation period that respects the overnight band.
Expected range: 7,598 to 7,640.
Morning Session (9:30 AM to 12:00 PM ET Monday, September 14, RTH Open)
Bias is constructive from support, conditional on the confluence holding.
There are no scheduled United States economic releases on Monday. The only North American data is Canadian consumer price and manufacturing sales at 08:30 AM ET, which is not a first-order driver for this instrument. The cash open at 09:30 AM ET therefore sets the session's first directional test without a data catalyst, and price discovery will be driven by positioning into Wednesday rather than by new information.
The level map for this window is well defined. Support at 7,604 to 7,614 was probed overnight to 7,604.25, marginally beneath the modeled flip conversions, and price recovered from it. The first upside objective is the computed pivot at 7,645.75, followed by the Friday settlement magnet at 7,659.50. Resistance thickens materially at 7,684 to 7,697.
A failure of 7,596 during this window would be the significant development, opening 7,556.50 with amplifying hedging conditions beneath.
Expected range: 7,596 to 7,660.
Afternoon Session (12:00 PM to 4:00 PM ET Monday, September 14)
Bias is neutral with a drift toward the settlement magnet. There are no auctions, no scheduled policy speakers of consequence, and no first-order releases in this window. Monday afternoons preceding a policy decision typically feature declining participation and gravitational pull toward prior-close and pivot references.
The behavior into the 04:00 PM ET close carries information for Tuesday. A close above the computed pivot at 7,645.75 would indicate the overnight repricing has been rejected. A close beneath 7,608 would indicate it has been accepted and would place the modeled flip level in play for Tuesday with the expiration approaching.
Expected range: 7,605 to 7,665.
Night Session Forward (6:00 PM ET Monday, September 14)
Residual bias depends entirely on where Monday closes relative to 7,645.75. Chinese industrial output, retail sales, unemployment and urban investment data arrive at 10:00 PM ET, and a press conference from the Chinese statistics bureau accompanies them. That set is the first scheduled catalyst of substance after Monday's close and is capable of setting the tone for Tuesday's European session, particularly for materials and energy-linked exposure.
Expected Range (Monday, September 14 Full Session)
| Low-range scenario | ** 7,610 to 7,655 |
| Mid-range scenario (most likely) | ** 7,596 to 7,665 |
| High-range scenario | ** 7,555 to 7,700 |
The mid-range scenario spans 69 points, which is approximately 0.97 times the 14-day average true range of 71.00 points and is consistent with the options-derived implied band of 76.62 points.
Most Likely Path
The most probable sequence begins with the cash open at 09:30 AM ET testing the overnight low area near 7,604 as participants react to the weekend crude reversal. That test holds, given the density of references between 7,604 and 7,614 and the depressed stochastic configuration. Price then recovers through the morning toward the computed pivot at 7,645.75, where the first meaningful resistance is encountered, and trades between that pivot and the 7,614 support through the afternoon in declining volume as participation withdraws ahead of Wednesday. A push to the Friday settlement at 7,659.50 is achievable on a constructive session but is likely to mark the upper bound absent a catalyst, because the 7,684 to 7,697 band above it is too dense to be resolved on a data-light Monday.
Monday Economic Calendar
The Monday calendar is notably light for United States index futures, and that absence is the defining characteristic of the session.
The overnight Asian window carries no first-order releases ahead of the cash open. Swedish consumer prices arrive at 02:00 AM ET during the European window, with the prior monthly reading at negative 0.3 percent and the prior annual reading at 0.3 percent; this is not a driver for this instrument.
The North American morning carries Canadian data at 08:30 AM ET: consumer prices year over year with a 3.1 percent forecast against a 3.0 percent prior, consumer prices month over month forecast at flat against a 0.5 percent prior, core consumer prices with a 2.3 percent prior annual reading, and manufacturing sales forecast at negative 0.2 percent against a 0.1 percent prior. These matter for the Canadian dollar and marginally for cross-border rate sentiment, but they are not first-order for the S&P 500.
There are no scheduled United States economic releases and no first-order corporate reports on Monday. The Treasury auctions 13-week and 26-week bills at 11:30 AM ET, which are routine short-dated bill operations rather than a duration event and are not a driver for this instrument.
The single first-order event for this instrument on Monday is therefore the cash open at 09:30 AM ET itself, and specifically whether the overnight repricing is accepted or rejected in regular-hours trade. In the absence of data, positioning ahead of Wednesday is the mechanism of price discovery.
Looking to the remainder of the week, which governs how much size is appropriate on Monday: Chinese industrial output, retail sales, unemployment and urban investment arrive at 10:00 PM ET Monday. Tuesday brings United Kingdom employment at 02:00 AM ET, German economic sentiment at 05:00 AM ET with a 40.2 forecast against a 34.2 prior, New York regional manufacturing at 08:30 AM ET with a 14 forecast against a 20.60 prior, and a 20-year Treasury auction at 01:00 PM ET. Wednesday is the pivotal session: United States retail sales at 08:30 AM ET with a 0.9 percent forecast against a negative 0.6 percent prior and core retail sales at 0.5 percent against negative 0.3 percent, import and export prices in the same 08:30 AM ET slot, crude oil inventories at 10:30 AM ET with a 1.35 million barrel draw forecast, then the policy rate statement and projections at 02:00 PM ET followed by the press conference at 02:30 PM ET. Thursday carries the Bank of England decision at 07:00 AM ET, forecast unchanged at 3.75 percent, and United States jobless claims at 08:30 AM ET with a 205,000 forecast against 206,000 prior. Friday is the quarterly expiration.
The implication for Monday is direct. A data-light session immediately preceding a policy decision that is roughly 86 percent priced, with a quarterly expiration four sessions away and approximately 35 percent of United States options exposure rolling off by then, does not warrant full commitment. Monday is a session for establishing position at well-defined structure, not for expressing a directional view on the policy outcome.
Primary Trade Setup
Direction: Long
Rationale: Price has retraced into a confluence of four independent support references spanning roughly ten points, has probed the lower boundary overnight to 7,604.25 and recovered from it, and carries depressed stochastic readings with a directional index indicating no established trend. A data-light Monday favors mean reversion toward the computed pivot and prior settlement magnet rather than directional extension.
Entry Zone: 7,604 to 7,614 (cash 7,601.48 to 7,611.48)
Stop Loss: 7,589 (cash 7,586.48), beneath the Friday session low of 7,594.25 and beneath the modeled directional pivot published at cash 7,590, so that the stop sits below both the price-structure and the positioning references rather than between them
Target 1 (T1): 7,645.75 (cash 7,643.23), the computed pivot point and first overhead reference
Target 2 (T2): 7,659.50 (cash 7,656.98), the Friday settlement and prior-close magnet
Target 3 (T3, extended): 7,697.25 (cash 7,694.73), first computed resistance, only if momentum carries through the 7,684 band on expanding volume
Risk-to-Reward: Approximately 1:1.84 to T1, 1:2.52 to T2, and 1:4.41 to T3, measured from the 7,609 midpoint of the entry zone against the 7,589 stop
Invalidation: Sustained acceptance beneath 7,596, defined as two consecutive 30-minute closes below that level. This breaks both the Friday session low and the modeled directional pivot, and places the amplifying hedging environment beneath the flip level in control, opening 7,556.50 and then 7,518.75.
Macro override: A continuation of the weekend crude advance through the Friday high of 104.46 would re-establish the inflation impulse that Friday's equity advance was predicated on being relieved, and would invalidate the mean-reversion thesis irrespective of price structure. A second override is any pre-decision policy signal, whether through press reporting or an unscheduled communication, that shifts the expected path beyond Wednesday's move.
Position sizing note: Reduced size is appropriate. The setup is a counter-trend mean reversion in an environment of amplifying dealer hedging, positioned two sessions ahead of a policy decision and four ahead of a quarterly expiration.
Sources and methodology
This piece is built from this desk’s own session review for the contract, prepared on the evening of Sunday September 13, 2026, and refreshed against live pre-market data at 8:15 AM ET on Monday September 14. The last completed regular-hours session was Friday September 11. The computed pivot ladder is reconstructed from that session’s high, low and settlement. The moving-average stack, oscillator matrix and volatility measurements are read from the same session and are labelled as Friday readings wherever they appear against a live price.
Monday figures marked as live were read at 8:15 AM ET and reconciled against Friday’s settlement before use. Contract domains are kept separate throughout: a cash index level is never set against a futures level without the basis being stated, and dashboard headers quoting spot metal or the cash index are not treated as futures quotes. Dealer-positioning figures are taken from the options flow dataset captured this morning and are dated where the provider dates them.
Scenario weightings reflect discretionary analyst judgment. They are not statistically derived and carry no calibration.
Every level above is published before the session, not after it. Our performance statement shows how the graded levels have resolved over time.
Daily reviews for ES, NQ, GC and CL go out before each session. See what is included.



