
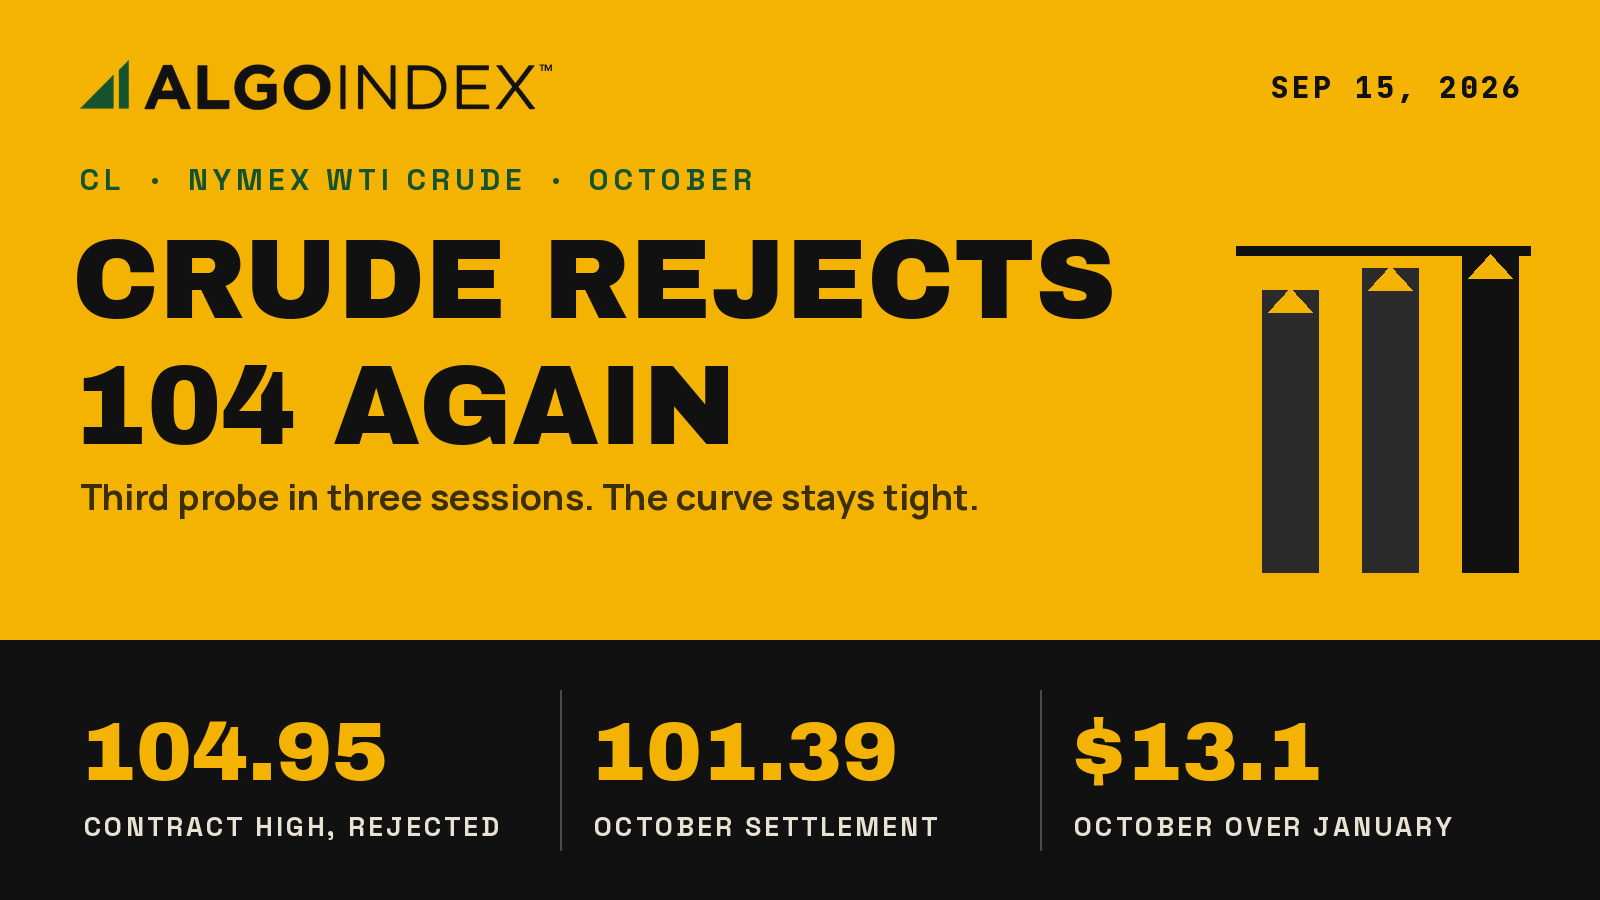
At 8:35 AM ET on Monday, press reports said a damaged Saudi pipeline would need three to five weeks of repairs, and October crude printed 104.95 in that same half hour on 17,920 contracts. No price in the life of the contract is higher. Six hours later it traded 100.53.
Washington did most of the damage. At 11:05 AM ET a statement described Ukraine and Russia as having agreed not to strike each other's energy targets, and at 11:32 AM ET another signaled openness to engagement with Iran. The US energy secretary said roughly 12 million barrels had moved through the Strait of Hormuz on Sunday, even as Iranian naval authorities insisted the strait was closed. In the 12:30 PM ET half hour the contract fell from 103.07 to 100.79 on 20,615 contracts.
October West Texas Intermediate settled at 101.39, up 1.34 dollars or 1.34 percent from Friday's 100.05. That green number hides the shape of the day. The 4.42-dollar range equals 4.36 percent of the settlement, and the settlement landed just 19.5 percent of the way up it. The contract enters Tuesday under a computed pivot of 102.29, beneath a supply band that has turned it back three sessions running, with a forward curve that has not softened at all.
October WTI crude futures settled at 101.39, up 1.34 percent, after a 104.95 contract high failed on de-escalation statements from Washington. The key Tuesday levels are the 102.29 pivot and the 104.04 to 104.05 resistance confluence overhead, and the 100.53 session low and the 100.00 to 100.05 band beneath. The primary setup is a short from 102.90 to 103.30, stop 104.20, targets 101.39, 100.53 and 99.63, with the weekly industry inventory bulletin due around 4:30 PM ET.
Neutral for the session inside an intact uptrend. The primary setup fades strength into the supply band.
Three probes, three rejections
The pattern is now three sessions deep. On September 10 the contract opened at 96.88, ran to 104.04 and settled at 102.48 on 437,382 contracts. On September 11 it printed 104.46, fell to 98.48 and settled at 100.05. Monday cleared Friday's high by 49 cents and failed again, closing its high half hour at 104.22, then printing lower highs at 104.55, 104.51 and 104.23.
Monday's outlook named Friday's 104.46 high as the first target for its long from 101.00 to 102.00. The contract got through that high by 49 cents in the 8:30 AM ET half hour and then gave the whole move back, without reaching the 99.40 stop.
The break came in two waves. The 11:00 AM ET half hour traded 20,459 contracts and swung from 103.53 down to 101.91 before closing at 103.75, and the 11:30 AM ET window traded another 21,892. Then came the 12:30 PM ET collapse of more than two dollars in thirty minutes. The low of 100.53 printed in the 2:30 PM ET settlement window on 9,652 contracts.
Buyers came back within the hour. The 3:30 PM ET half hour climbed from 101.27 to 101.96, and the contract was still bid between 101.85 and 101.97 into the evening. Friday had no such recovery. Monday also made a higher high and a higher low against Friday, 100.53 against 98.48, so it was not an outside day, but a marginal new high followed by a settlement near the low reads like a market that ran out of buyers at a specific price.
Volume reached about 378,700 contracts against a 20-day average of 285,669, roughly 33 percent above normal. Open interest in October has dropped from 270,038 on August 27 to 175,963 as positions roll into November ahead of the September 22 expiration and the September 24 first notice date, so much of that volume was transfer and churn. The contract has run 25.33 dollars in fourteen sessions from the August 26 low of 79.62, through 85.76 on August 31, 90.22 on September 1 after a 4.46-dollar session, 93.03 on September 8 and 96.05 on September 9.
Every average below, every oscillator stretched
The moving averages sit in perfect ascending order under price. The 5-day is 98.65, 2.74 below the settlement. The 20-day is 89.28, 12.11 below, which puts the contract 13.6 percent above it. The 50-day at 82.75 and the 100-day at 81.85 sit just 0.90 apart, a leftover from two months spent between 80 and 83 before September, and the 200-day at 73.71 leaves price at a 37.6 percent premium. The year-to-date average is 76.02.
Sellers have barely shown up. The 9-day directional index reads 45.26, with positive direction at 38.29 against negative direction at 6.03, and the 14-day reads 30.75, with 36.42 against 9.06. The 20-day at 22.81 and the 50-day at 13.77 show how recent the trend is. The multi-indicator composite reads 100 percent buy on all thirteen measures, which also means there is no further technical confirmation left to attract a new buyer.
Momentum is stretched and starting to roll. Relative strength reads 79.41 on the 9-day, 75.28 on the 14-day, up 1.55 on the session, 71.04 on the 20-day, 61.88 on the 50-day and 58.50 on the 100-day. The stochastic slow lines now sit above the fast lines, 88.40 against 84.56 on the 9-day and 90.10 against 87.62 on the 14-day, an early deceleration signal without a confirmed cross beneath 80. The 9-day raw reading is 82.52, the 14-day 87.01 and the 50-day 91.15. Historic volatility runs 38.83 percent on the 14-day, 37.13 percent on the 9-day and 45.27 percent on the 50-day.
A 4.42-dollar day is ordinary here. The 14-day average true range is 4.03 dollars, 3.96 percent of the price, against 4.35 on the 9-day, 3.85 on the 20-day and 3.48 on the 50-day, and the average daily range is 4.17 on the 14-day, 4.59 on the 9-day and 3.64 on the 20-day. At a 1,000-dollar point value that is roughly 4,000 dollars of expected daily movement per contract. One average true range from the settlement spans 97.36 to 105.42, and one average daily range spans 99.31 to 103.48.
Overhead, the pivot at 102.29 comes first. Then comes the 103.00 to 103.15 band, where 103.07, 103.12 and 103.17 all failed on Monday. The strongest level on the chart follows: the computed first resistance at 104.05 sits one cent above the September 10 high of 104.04. Friday's 104.46 and Monday's 104.95 complete the supply band. The second resistance is 106.71 and the third 108.47, a 7.08-dollar climb from the settlement.
Beneath, the settlement and the 100.53 low come first. The round number meets Friday's settlement in the 100.00 to 100.05 band, and the first support at 99.63 sits six cents from the 38.2 percent retracement of the September 8 to Monday advance at 99.57. Friday's 98.48 low, the 50 percent retracement at 97.91 and the second support at 97.87 follow. Then come the 61.8 percent retracement at 96.25 and the 96.05 September 9 settlement. At the bottom, the third support at 95.21 meets the September 10 low of 95.37. The three-session range runs from 98.48 to 104.95, and its 101.72 midpoint sits within 18 cents of the 101.90 evening quote.
A curve that still says scarce
The strongest bullish argument did not budge. October traded near 101.85 in the evening against 97.47 for November, 92.75 for December and 88.74 for January 2027, a spread of roughly 4.4 dollars to the next month and 13.1 dollars to January. A market pays that kind of premium for barrels it needs now.
The product market agrees. Gasoline settled at 3.3171 dollars a gallon and diesel at 4.9615, which at 42 gallons a barrel works out to a gasoline crack near 37.93 dollars, a distillate crack near 106.99 and a blended three-two-one crack near 60.95, computed from Monday's settlements. Distillate is pricing acute scarcity, in mid-September, normally the softest demand stretch of the year. Whether the cracks widened or narrowed from Friday cannot be determined from Monday's data. Brent settled at 105.68, up 1.07 dollars or 1.02 percent, leaving the spread to West Texas at about 4.29 dollars after the US benchmark outperformed on the day, and natural gas settled at 2.8960, up 2.30 percent.
The pipeline news matters for a specific reason. That route exists to move Saudi barrels around the Strait of Hormuz. Losing it for three to five weeks removes the main alternative to the strait while the strait's status is disputed. In the afternoon the US interior secretary said export bans would be unlikely to lower energy prices and that all options remain under consideration. He also raised the possibility of Venezuelan energy exports forming part of future arrangements.
China's industrial data did not deliver the weak print that would have challenged the advance. Chinese data released at 10:00 PM ET Monday showed industrial output up 5.2 percent from a year earlier, against a 4.8 percent forecast. Retail sales rose only 0.4 percent against 0.8 percent, and fixed-asset investment fell 7.2 percent over the first eight months.
Headlines in both directions
The escalation list kept growing after the settlement. Iranian naval command asserted that the strait is closed and under its control, a supertanker was reported ablaze after apparently striking a mine south of it, and Saudi civil defense issued and then lifted a warning in Najran province. Houthi representatives claimed the interception of two Saudi aircraft at 3:41 PM ET, and two Iranian fishing vessels were reported struck by drones at 4:17 PM ET. The United States also sanctioned a Russian bank over alleged Iranian sanctions evasion. On the other track, Iran's president said his country has no intention of going to war with Saudi Arabia while keeping its demands unchanged.
The reactions are lopsided. Escalation headlines have been lifting crude one to two dollars at a time, while Monday's de-escalation statements produced a four-dollar round trip in three hours. A firmer dollar added a headwind, closing at 99.50, up 0.38 percent after a range of 99.07 to 99.74, and the volatility index rose 7.95 percent to 17.10.
Positioning explains the speed. As of September 8, managed money held 218,960 long contracts against 107,229 short, a net long of about 111,731, after adding 13,660 longs and cutting 3,790 shorts in the week. Non-commercial traders were net long about 136,579, with 350,118 long against 213,539 short. Commercials sat on the other side, net short about 166,185, with 889,086 long against 1,055,271 short. Swap dealers held 110,812 long against 585,913 short, and producers 655,691 long against 346,775 short. The report is stale. It predates the September 10 breakout and both rejections, and the contract has added roughly five dollars since, which leaves a crowded long book with a narrow exit.
The trade map for Tuesday
The primary setup is a short from 102.90 to 103.30 on a rejection of the round-number band during the pit session. The stop sits at 104.20, above the 104.04 to 104.05 confluence.
| Setup | Primary: short | Alternate: long |
|---|---|---|
| Condition | Rejection of the 103 band in the pit session | 102.29 accepted early |
| Entry zone | 102.90 to 103.30 | 102.20 to 102.45 |
| Stop | 104.20 | 101.25 |
| Target 1 | 101.39 (settlement) | 104.04 |
| Target 2 | 100.53 (session low) | 104.95 |
| Target 3 | 99.63 (1st pivot support) | None |
| Reward to risk | 1.6, 2.3, 3.2 from 103.10, 1.10 of risk | Half to two-thirds size |
| Invalidation | Settlement above 104.46 | Back beneath 102.29 |
From a 103.10 midpoint, 1.10 dollars of risk stands against 1.71, 2.57 and 3.47 dollars of reward. That is about 1.6, 2.3 and 3.2 times risk to the settlement at 101.39, the low at 100.53 and the first support at 99.63. The last needs selling to extend through the round-number band on expanding volume. A settlement above 104.46 ends the idea. Acceptance over 104.05 for more than a pit hour on above-average volume is the early warning. Headlines override all of it. A confirmed disruption to Hormuz transit, a further attack on producing or transit infrastructure, a producer-group statement on reduced output, or a surprise draw far larger than consensus voids the setup at any price. Formal verification that traffic through the strait is normal, or a structured diplomatic channel with Iran, pushes it toward the third target and beyond.
The alternate applies if the London bid carries through the pit open and 102.29 is accepted early. It is a long from 102.20 to 102.45 on a retest of the reclaimed pivot, stop 101.25, targets 104.04 and 104.95. Either side runs at one half to two thirds of an equivalent index allocation, given a 4.03-dollar average true range and a loaded Wednesday.
The calendar sets the timing. The industry-group weekly inventory bulletin publishes around 4:30 PM ET Tuesday, two hours after the 2:30 PM ET settlement, so exposure carried past the close is inventory-event exposure. Wednesday is heavier. Retail sales print at 8:30 AM ET and the government inventory report at 10:30 AM ET, with consensus for a draw of 1.35 million barrels against a prior draw of 0.391 million. The rate decision follows at 2:00 PM ET, where the calendar forecast is 4 percent against a previous 3.75 percent. On Tuesday itself the 20-year bond auction lands at 1:00 PM ET. A cloture vote at 2:15 PM ET, fifteen minutes before settlement, makes the 2:15 PM to 2:35 PM ET window mechanically unreliable.
Scenario ranges are analyst judgment. The low-range case runs 100.80 to 102.80 and the mid-range case, the most likely, 100.00 to 103.60. The high-range case, 98.50 to 105.00, needs a headline in a liquid window. The most likely path opens the pit session near 101.50 to 102.00 and fails at 102.29 in the first pit hour. From there it drifts back toward 101.00 and balances between 100.53 and 102.29. The settlement lands between 101.00 and 102.00. The alternative, about a third as likely, carries the London bid through the open, accepts 102.29 early and reaches 104.04 by midday. The confluence there should hold on a first test.
Every headline that moved crude on Monday arrived outside a scheduled window, and Tuesday's largest scheduled release lands two hours after settlement.
The complete data picture
Every figure behind the session for October WTI crude: the key readings, the remaining charts, the full level map, then the complete numeric reference.
Complete level map, split at the October settlement 101.39. October contract. Pivots are computed from Monday’s 104.95 high, 100.53 low and 101.39 settlement.
| Resistance, top down | Support, top down |
|---|---|
| 108.47Third pivot resistance | 100.53Monday low |
| 106.71Second pivot resistance | 100.05Friday settlement |
| 105.42One-ATR projection high | 100.00Round number |
| 104.95Monday high, contract high | 99.63First pivot support |
| 104.46Friday high, prior-week high | 99.5738.2% of the Sep 8 to Sep 14 advance |
| 104.05First pivot resistance | 98.655-day average |
| 104.04September 10 high | 98.48Friday low |
| 103.15Top of the 103 supply band | 97.9150% of the advance |
| 103.00Round number | 97.87Second pivot support |
| 102.29Tuesday pivot | 97.36One-ATR projection low |
| 101.72Midpoint of the 3-session range | 96.2561.8% of the advance |
| 96.05September 9 settlement | |
| 95.37September 10 low | |
| 95.21Third pivot support | |
| 90.87September 8 low | |
| 89.2820-day average | |
| 82.7550-day average | |
| 81.85100-day average | |
| 79.62August 26 low | |
| 76.02Year-to-date average | |
| 73.71200-day average |
Full numeric reference: every figure from the session review
1. Executive Summary
October WTI settled at 101.39, up 1.34 on the session, a gain of 1.34 percent against Friday's 100.05 settlement. That closing figure understates how violent the day actually was. The contract opened at 102.25, extended to 104.95 during the London-into-US handover, and then surrendered the entire advance and more, trading down to 100.53 in the settlement window before the official price was struck. The full session range was 4.42 dollars, which is 4.36 percent of the 101.39 settlement, and the settlement landed at only 19.5 percent of that range, measured from the session low of 100.53 and high of 104.95 against the 101.39 settle. A green number on the screen concealed a decisive intraday rejection.
The settlement and the evening electronic trade disagree, and the direction of that disagreement matters. After the 2:30 PM ET settlement was struck, the contract recovered through the late afternoon and was trading around 101.85 to 101.97 into the evening, roughly 0.45 to 0.60 above the settle. That is a reversal of the pattern seen on Friday, September 11, when the contract printed 104.46 and then settled at 100.05, giving the electronic market no meaningful recovery at all. Friday's settlement was not its session low: Friday traded down to 98.48 intraday and the 100.05 settlement sat 1.57 above that low. Two consecutive sessions have now attempted the 104 handle and failed, but only today's attempt was followed by buyers returning after the official price was set. The market is rejecting the highs and defending the lows in the same twenty-four hours.
The dominant session driver was supply-side and geopolitical, not demand or inventory. Press reports early in the US morning indicated that a damaged Saudi pipeline would be largely out of service for several weeks while repairs are completed, and that headline coincided with the push to the session high. The reversal coincided with two separate statements out of Washington in the late morning: one describing a mutual agreement between Ukraine and Russia not to strike each other's energy infrastructure, and one indicating openness to engagement with Iran. Both cut directly against the risk premium that had been accumulating in the contract for two weeks. Commentary from the US energy secretary that a substantial crude volume had transited the Strait of Hormuz on Sunday added to that unwind, even as Iranian naval authorities publicly asserted the strait remained closed and under their control. Those two claims cannot both be fully true, and the market is being asked to price the gap between them.
The structural contradiction heading into Tuesday is therefore straightforward to state and difficult to resolve. The physical market is screaming tightness: the forward curve is in steep backwardation, with October trading roughly 4.4 above November and roughly 13.1 above January 2027, and product cracks are at levels that imply acute distillate and gasoline scarcity. Against that, the headline channel has begun to produce de-escalation signals for the first time since late August, and positioning is heavily one-sided long. The trend environment is intact and powerful, with the 9-day directional index at 45.26 and every major moving average below spot, but momentum is extended, with the 14-day relative strength reading at 75.28 and the 14-day stochastic at 87.62. The primary setup preview is a fade of strength back toward the new pivot rather than a chase of the breakout, with a hard acknowledgement that a single overnight headline can void the entire technical case.
2. Price Action & Technical Structure
2.1 Intraday and Session Review
The Globex session reopened Sunday evening near 102.80 and spent the Asian hours in a narrow band between 101.94 and 103.09, with the low of that window printed around 2:30 AM ET. Volume through Asia was thin, averaging roughly 2,000 to 3,000 lots per half hour, and there was no directional resolution. The European morning was where the buying began in earnest. Between 3:30 AM and 8:00 AM ET the contract worked from 102.43 up through 103.73 and 103.83, with participation building steadily, and the 8:00 AM ET half hour traded 9,125 lots as European desks positioned ahead of the US pit open.
The session high was made in the 8:30 AM ET half hour, which printed 104.95 on 17,920 lots, the largest half-hourly volume of the morning to that point. That window coincided with press reports, timed at 8:35 AM ET, indicating that the damaged Saudi pipeline would require three to five weeks of repair work. The contract could not hold the print. It closed that half hour at 104.22, made a lower high at 104.55, a second lower high at 104.51 into the 10:00 AM ET pit hour, and a third at 104.23. Three successively lower attempts at the same shelf, each on declining conviction, is the structural signature that preceded the break.
The break itself was fast. The 11:00 AM ET half hour traded 20,459 lots and drove from 103.53 to 101.91 before recovering to close at 103.75, a violent two-way window that coincided with a statement out of Washington at 11:05 AM ET describing an agreement between Ukraine and Russia not to target each other's energy assets. The 11:30 AM ET window traded another 21,892 lots. The decisive break came in the 12:30 PM ET half hour, which traded 20,615 lots and carried the contract from 103.07 down to 100.79, closing at 101.36. That collapse of over two dollars in thirty minutes is the defining move of the session.
The final hour into the 2:30 PM ET settlement was heavy but orderly. The contract made the session low of 100.53 in the 2:30 PM ET window, which traded 9,652 lots, and settled at 101.39. What followed is the part worth noting. The post-settlement electronic market did not continue lower. The 3:30 PM ET half hour traded up from 101.27 to 101.96, and the contract was still bid at 101.85 to 101.97 into the evening on declining volume. The session low was defended within an hour of being made. Buyers stepped in below 101 and are holding the contract above the settlement into the Globex break.
Total session volume was approximately 378,700 contracts against a 20-day average of 285,669, running roughly 33 percent above normal. Open interest in the October contract stands at 175,963 and has been falling steadily, from 270,038 on August 27 to the current figure, which is consistent with position rolling into November ahead of the September 22 expiration and the September 24 first notice date. Volume of that magnitude in an expiring contract with falling open interest describes churn and transfer rather than fresh accumulation.
2.2 Daily Structure
Today produced a higher-high, higher-low day against Friday's session, not an outside day. Friday ranged 98.48 to 104.46 and settled 100.05. Today ranged 100.53 to 104.95 and settled 101.39. Today's high exceeded Friday's high by 0.49 and today's low held 2.05 ABOVE Friday's low, so today's range sits inside Friday's on the downside and only marginally beyond it on the upside. An outside day would require today's low to have taken out 98.48, and it did not. The higher high and higher low pairing is technically constructive, but the settlement landed in the lower fifth of the day's range, and that combination, a marginal higher high followed by a close near the low, is the shape of a market that has run out of buyers at a specific price rather than one preparing to extend.
The prior week's high was 104.46, set on Friday. Today's 104.95 cleared it by 0.49 and then failed. That is a marginal break of a prior-week high that did not hold, which in structural terms is a liquidity event rather than a breakout, and until it is reclaimed on a closing basis the 104.46 to 104.95 band functions as supply.
The daily sequence into today is one of the most aggressive advances in the contract's recent record. From the August 26 low of 79.62, the October contract has travelled to 104.95, a range of 25.33 dollars in fourteen trading sessions. The key marks along the way are 85.76 on August 31, 90.22 on September 1, which was a 4.46-dollar single-session advance, 93.03 on September 8, 96.05 on September 9, and then the breakout session of September 10, which opened 96.88, traded to 104.04, and settled 102.48 on 437,382 contracts. September 11 marked the first rejection, printing 104.46, trading down to 98.48 and settling at 100.05. Today marked the second. The 104.04 to 104.95 area has now absorbed three separate probes in three sessions.
The 20-day moving average sits at 89.28, which is 12.11 below the settlement. That distance is extraordinary and carries a specific implication: mean-reversion pressure toward the 20-day is enormous in magnitude but says nothing about timing. A contract trading 13.6 percent above its 20-day average is not in a condition that persists indefinitely, but the same statement was true at 96.00 and the advance continued.
The forward curve is in steep backwardation. October is quoted near 101.85, November near 97.47, December near 92.75, and January 2027 near 88.74. The October to November spread is roughly 4.4 dollars and the October to January spread is roughly 13.1 dollars. Backwardation of that depth is the market paying a substantial premium for immediate physical barrels over deferred ones, which is the clearest available evidence of genuine present-day scarcity rather than speculative positioning alone. The curve is the strongest bullish argument on the board and it did not soften today.
2.3 4-Hour and Swing Structure
The swing sequence from the August 26 low is a clean series of higher highs and higher lows with no intervening change of character until the 104.46 print on September 11. Since then the sequence has been: high 104.46 on September 11, low 98.48 the same session, high 104.95 today, low 100.53 today. The higher low at 100.53 against 98.48 preserves the uptrend structure. The high at 104.95 against 104.46 is a higher high by a margin that a single headline could have produced, so it should be treated as an equal high rather than a confirmed extension until proven otherwise.
On the 4-hour framing, the contract is building a broadening structure between roughly 98.48 and 104.95 that has now consumed three sessions. The mid-point of that structure sits at 101.72, and the settlement at 101.39 with the evening quote at 101.90 places price directly on that mid-point. That is a neutral position within a volatile balance, and it is the reason the directional case for Tuesday is weaker than the trend backdrop would suggest.
Fibonacci retracement of the September 8 low at 90.87 up to today's high at 104.95 gives 38.2 percent at 99.57, 50 percent at 97.91, and 61.8 percent at 96.25. The 38.2 percent level at 99.57 sits just above the September 11 low of 98.48 and just below the round 100.00, creating a defended band between roughly 98.50 and 100.00 that would need to fail before the broader advance is in question.
2.4 Moving Averages
The moving average stack is uniformly below spot and in perfect ascending order, which is the strongest possible trend configuration.
- 5-day: 98.65, with spot 2.74 above
- 20-day: 89.28, with spot 12.11 above
- 50-day: 82.75, with spot 18.64 above
- 100-day: 81.85, with spot 19.54 above
- 200-day: 73.71, with spot 27.68 above
- Year-to-date average: 76.02, with spot 25.37 above
The 50-day and 100-day are separated by only 0.90, which describes a market that spent roughly two months in a tight band between 80 and 83 before the September repricing. The 200-day at 73.71 against spot at 101.39 is a 37.6 percent premium, which quantifies how much has changed in the physical picture and how far price would have to fall before any longer-horizon trend measure turned.
The 5-day at 98.65 is the only average close enough to matter tactically. A settlement below it would be the first break of short-term trend structure since the September 1 acceleration, and it currently sits between the 99.57 retracement level and the September 11 low of 98.48, reinforcing that band.
2.5 Oscillator and Trend Readings
Relative strength readings across horizons: 9-day at 79.41, 14-day at 75.28, 20-day at 71.04, 50-day at 61.88, 100-day at 58.50. Every measure out to fifty days is above the neutral mark and the shorter two are in territory conventionally described as overbought. The 14-day reading rose 1.55 on the session despite the settlement finishing in the lower fifth of the range, which reflects the positive close rather than the intraday rejection.
Stochastic readings: 9-day raw at 82.52 with %K at 84.56 and %D at 88.40; 14-day raw at 87.01 with %K at 87.62 and %D at 90.10; 50-day raw at 91.15. The %D exceeding %K across the 9-day and 14-day horizons indicates the fast line has begun to roll beneath the slow line, which is an early momentum-deceleration signal, though neither has produced a confirmed crossover below the 80 threshold.
The directional system is the clearest evidence that this remains a trending environment rather than a range. The 9-day directional index reads 45.26 with the positive direction indicator at 38.29 against a negative indicator of only 6.03, a ratio above six to one. The 14-day directional index reads 30.75 with 36.42 against 9.06. Readings above 25 conventionally describe a strong trend; a 9-day reading above 45 with a negative indicator near 6 describes a market where sellers have had almost no sustained presence. The 20-day index at 22.81 and 50-day at 13.77 confirm the trend is recent and accelerating rather than mature.
Historic volatility is 38.83 percent on the 14-day measure, 37.13 percent on the 9-day, and 45.27 percent on the 50-day. The 9-day reading sitting below the 50-day indicates realised volatility has actually compressed slightly relative to the summer even as the directional move has been large, which is characteristic of a persistent one-way advance rather than a two-way shock.
The multi-indicator composite reads 100 percent buy across all thirteen constituent measures, with short-term, medium-term and long-term groupings each at 100 percent. A unanimous composite is informative in two opposite ways: it confirms every conventional trend measure agrees, and it means no additional bullish confirmation is available, so the marginal new buyer must come from somewhere other than a technical signal.
2.6 Volatility and Expected Range
- 9-day average true range: 4.35, which is 4.28 percent of spot
- 14-day average true range: 4.03, which is 3.96 percent of spot
- 20-day average true range: 3.85, which is 3.78 percent of spot
- 50-day average true range: 3.48, which is 3.43 percent of spot
- 9-day average daily range: 4.59, which is 4.51 percent of spot
- 14-day average daily range: 4.17, which is 4.10 percent of spot
- 20-day average daily range: 3.64, which is 3.58 percent of spot
Today's realised range of 4.42 sits between the 14-day average true range of 4.03 and the 9-day average daily range of 4.59, so the session was slightly wider than the fourteen-day norm but well inside what the nine-day measure would predict. This is not an outlier day by this contract's current standards, which is itself the point: a 4.42-dollar range has become ordinary.
A one-average-true-range projection from the 101.39 settlement using the 14-day measure of 4.03 gives a band of 97.36 to 105.42. Using the 14-day average daily range of 4.17 gives 99.31 to 103.48 if the session opens at the settlement and travels a normal distance in one direction. For risk purposes the working assumption for Tuesday should be a 4-dollar range with a fat tail in both directions, and position sizing should reflect that a single contract carries approximately 4,000 dollars of expected daily excursion at a 1,000-dollar point value. Sizing at one half to two thirds of an equivalent index-futures allocation remains appropriate, and stop placement below 75 cents is not survivable in this environment.
3. Key Levels
All pivot values below are computed from today's session high of 104.95, low of 100.53 and settlement of 101.39, and are therefore the levels that apply to Tuesday's session.
3.1 Resistance
102.29, Tuesday pivot point. The arithmetic centre of today's session and the first mechanical decision level. Price is currently trading below it at 101.90. Acceptance above 102.29 in the Globex or early pit session restores the near-term upward bias and puts the higher shelf back in play; repeated rejection there confirms the session is building a lower value area beneath today's midpoint.
103.00 to 103.15, round-number band and intraday supply. The 103 handle absorbed three separate half-hourly attempts during today's pit session, with 103.07, 103.12 and 103.17 all printing as rejection highs before the final break. Round-number psychology and a proven intraday supply pocket occupy the same price, which makes this the first level where a Tuesday advance is likely to meet real resistance.
104.04 to 104.05, Tuesday first resistance and prior breakout high confluence. This is the strongest single level on the chart. The Tuesday first pivot resistance computes to 104.05 and the September 10 session high was 104.04, one cent apart. Mechanical pivot math and a verified swing high occupying the same price is the kind of confluence that produces clean reactions. A move through it opens the September 11 high directly.
104.46, prior-week high. Friday's session high and the level today's advance cleared by 0.49 before failing. Until a session settles above it, this marks the upper edge of the three-session distribution band and is the reference that defines whether the breakout attempt is live.
104.95, session high and October contract high. The highest print this contract has recorded. It was made on the largest half-hourly volume of the European morning and was immediately rejected. A decisive move above it with follow-through volume would be a genuine structural break and would leave very little visible overhead reference until the pivot extensions.
106.71, Tuesday second resistance. The first mechanical objective beyond the contract high. It sits 1.76 above today's high, roughly 0.4 of a 14-day average true range beyond the extreme, which makes it a plausible destination on a headline-driven expansion day rather than an ordinary one.
108.47, Tuesday third resistance. The extended mechanical target, reachable only on a supply-shock session. Reaching it would require a 7.08 advance from the settlement, approximately 1.8 average true ranges, which historically requires a discrete physical-disruption event rather than a continuation of existing conditions.
3.2 Support
101.39, today's settlement. The immediate reference and the line the post-settlement electronic market has been defending. The contract recovered above it within an hour of the session low and has held there since, which makes it the first genuine test of whether the late-session buying was covering or accumulation.
100.53, session low. Today's low, made in the settlement window on 9,652 contracts. It is the pivot on which the higher-low structure against Friday's 98.48 rests. A break below it during Tuesday's pit session would erase the constructive element of today's higher-low structure.
100.00 to 100.05, round number and Friday settlement. The psychological 100 handle and Friday's official settlement of 100.05 sit within five cents of each other. A move through this band would put the contract below two consecutive settlements and would be the first evidence that the September advance is being unwound rather than consolidated.
99.57 to 99.63, Tuesday first support and retracement confluence. The Tuesday first pivot support computes to 99.63 and the 38.2 percent retracement of the September 8 to September 14 advance sits at 99.57. Mechanical support and a standard retracement level six cents apart is meaningful confluence and marks the first place a decline would be expected to find organised buying.
98.48, Friday's session low. The September 11 session low and the lower boundary of the three-session balance. It is not the prior week's low: the week of September 7 traded down to the 90.87 area on September 8, far beneath this level. Losing it would complete a lower low against the entire structure built since September 10 and would put the 96 area into scope quickly.
97.87, Tuesday second support. The second mechanical pivot objective, computed from today's high, low and settlement. A full one-average-true-range decline from the 101.39 settlement lands lower, at 97.36 on the 14-day measure of 4.03, so the pivot and the volatility projection are roughly half a dollar apart rather than the same level. This band sits between Friday's 98.48 low and the deeper swing support, and is the logical destination on a de-escalation session.
96.05, September 9 settlement. The last settlement before the September 10 breakout session, and therefore the price from which the current advance originated. Returning here would mean the entire breakout has been retraced and the market has decided the supply premium was mispriced.
95.21 to 95.37, Tuesday third support and breakout-session low confluence. The Tuesday third pivot support computes to 95.21 and the September 10 session low was 95.37, sixteen cents apart. This is the deepest structural reference that remains relevant to the current move. A settlement beneath it would end the September trend framing entirely.
4. Macro Drivers
4.1 OPEC and Supply Policy (Quotas, Compliance, Saudi/Russia Signals)
No scheduled producer-group decision landed today and none is on Tuesday's calendar, which leaves policy as background rather than catalyst for the immediate session. The operative supply story is physical rather than political: press reports at 8:35 AM ET indicated that a damaged Saudi pipeline will be largely out of service for three to five weeks of repairs. That route exists specifically to move barrels while bypassing the Strait of Hormuz, so its removal from service does not reduce production directly but does remove the principal alternative to the strait at precisely the moment the strait's status is contested. The two constraints compound each other.
Statements from the US interior secretary in the mid-afternoon are worth recording because they frame the policy response function. He indicated that export bans would be unlikely to lower energy prices while noting that all options remain under consideration, and separately raised the possibility of Venezuelan energy exports forming part of future arrangements. Neither is an immediate supply change. Both signal that the administration is considering the supply side of the problem publicly, which historically caps the upper tail of a crude advance because it introduces the possibility of policy intervention that traders must price.
Spare capacity is the unresolved question that available data cannot answer. If the producer group's stated spare capacity is real and deliverable, the current premium is excessive. If it is nominal, the curve shape is correct. That uncertainty is a genuine limit on conviction and is stated here rather than papered over.
4.2 EIA and API Inventory (Crude Stocks, Gasoline, Distillates, Cushing, SPR)
There was no inventory print today, and none lands during Tuesday's pit session. Tuesday does, however, carry a scheduled inventory release. The industry-group weekly bulletin publishes every Tuesday at approximately 4:30 PM ET, moving to Wednesday only when Monday is a federal holiday, which it was not this week. That places the release on Tuesday, September 15 at approximately 4:30 PM ET: two hours after the 2:30 PM ET pit close, inside the Globex session, and roughly eighteen hours ahead of the official government figures. It is a fixture on the publication calendar. The official weekly petroleum status report follows Wednesday, September 16 at 10:30 AM ET, with consensus looking for a draw of 1.35 million barrels against a prior draw of 0.391 million barrels. The practical consequence is that the industry figures set the tone for the Tuesday evening Globex session and frame how the Wednesday morning number is received.
The consensus expectation of a 1.35-million-barrel draw is modest in absolute terms but consequential in context. Against a forward curve in this degree of backwardation, a draw confirms the physical tightness the curve is already pricing and would be read as validation. A build, by contrast, would directly contradict the curve and would give the de-escalation case a data anchor it currently lacks. The asymmetry favours the downside reaction: the market already believes in tightness, so confirmation delivers little new information while contradiction would force a repricing.
Cushing stocks, refinery utilisation and product inventories are all components of the same Wednesday release and none can be assessed from today's data. Distillate positioning deserves particular attention given where the cracks are, discussed in section 4.4.
4.3 Geopolitical Backdrop (Middle East, Iran, Russia/Ukraine, Venezuela)
The geopolitical picture is genuinely two-sided today, and both tracks moved.
The escalation track is dense and continued accumulating through the afternoon and into the evening. Iranian naval command publicly asserted that the Strait of Hormuz is closed and under its control. A supertanker was reported ablaze after apparently striking a naval mine south of the strait. Saudi civil defence issued and then lifted a warning in the Najran province. Houthi representatives claimed the interception of two Saudi aircraft at 3:41 PM ET. Two Iranian fishing vessels were reported struck by drones in southern Iran at 4:17 PM ET, after the pit close. The pipeline damage that removes the principal Hormuz bypass for several weeks belongs to this track as well.
The de-escalation track is thinner but arrived during the liquid part of the session, which is why it dominated price. At 11:05 AM ET a statement from Washington described Ukraine and Russia as having agreed not to strike each other's energy targets. At 11:32 AM ET a further statement indicated openness to engagement with Iran. Separately, the US energy secretary stated that roughly 12 million barrels transited the Strait of Hormuz on Sunday, which directly contradicts the Iranian closure claim. Iran's president stated in the afternoon that his country has no intention of going to war with Saudi Arabia while maintaining that its underlying demands are unchanged. The United States also sanctioned a Russian bank for alleged involvement in Iranian sanctions evasion, which cuts the other way.
Assessing the two tracks: the escalation track carries the higher probability of continuation, because it involves physical damage to infrastructure and vessels that takes weeks to repair regardless of diplomatic sentiment, and because it has produced new incidents on each of the last several days. The de-escalation track carries the larger single-day move, because the premium built into the front of the curve over the past two weeks is substantial and would unwind quickly if Hormuz transit were verified as normal or if a diplomatic channel opened formally. The reaction function is asymmetric: escalation headlines have been producing one to two dollar advances, while today's de-escalation statements produced a four-dollar round trip in three hours.
Overnight exposure is therefore the dominant risk for Tuesday, and it is larger for this contract than for any other instrument covered. Every item listed above arrived outside a scheduled window.
4.4 Demand and Refining (Refinery Utilisation, Crack Spreads, Seasonal Pattern)
Product settlements today were gasoline at 3.3171 per gallon and diesel at 4.9615 per gallon, against a crude settlement of 101.39. Converting at 42 gallons per barrel gives a gasoline crack of approximately 37.93 per barrel and a distillate crack of approximately 106.99 per barrel, with a blended three-two-one crack of approximately 60.95 per barrel. These are computed values from today's settlements, not published figures, and they describe refining margins that are extraordinarily wide by any normal standard. Distillate in particular is pricing acute scarcity.
The direction of change matters more for Tuesday than the absolute level, and it cannot be read off the percentage moves. Crude advanced 1.74 percent in the late electronic session while gasoline advanced 1.31 percent and diesel advanced 0.77 percent. A crack is a dollar spread between two different price bases, not a ratio, so a smaller percentage move on a product priced near 139 or 208 dollars per barrel is not automatically a smaller dollar move than a larger percentage on crude near 101. An illustrative reconstruction from those percentages gives a gasoline crack roughly 7 cents wider and a distillate crack roughly 14 cents narrower, but that calculation pairs a late electronic crude quote with product settlement prices and carries no quantified error bound, so it cannot establish a direction OR a near-zero change. Prior-session product settlements are not part of this edition. The session-to-session change in the cracks is therefore UNDETERMINED from the captured inputs, and no conclusion about compression, widening or stability is drawn here. The structural point stands on the levels rather than the change: cracks at these absolute levels describe a market bidding the input on scarcity, and if products do begin to lag crude in dollar terms it would pressure refinery run economics at the margin and eventually reduce crude demand, which is the natural self-correcting mechanism in a supply-shock advance. That is a condition to watch for, not one observed today.
Seasonally, mid-September sits between the end of the summer driving season and the onset of winter heating demand, which is conventionally the weakest demand window of the year and a period of elevated refinery maintenance. The market is advancing against that seasonal grain, which reinforces the reading that this is a supply story and not a demand story.
Natural gas settled at 2.8960 against a prior settlement of 2.831, an advance of 2.30 percent, which is broadly in line with the energy complex and provides no independent signal.
4.5 Dollar and Cross-Asset (DXY, Commodities Complex, Equity Risk-On/Off)
The dollar index closed at 99.50, up 0.38 percent, having ranged 99.07 to 99.74 and reaching its highest level in roughly a week and a half. A firmer dollar is conventionally a headwind for dollar-denominated crude, and the fact that the contract advanced anyway underscores that supply factors were overwhelming currency effects today. Investment-bank commentary attributed the dollar's strength to last week's firmer inflation data, with core consumer prices printing 0.3 percent month over month on September 11 against a 0.2 percent consensus, and producer prices at 5.4 percent year over year on September 10 against 5.3 percent expected.
Cross-asset behaviour today was risk-off and broad. Index futures finished lower, with the S&P contract at 7,694.50, down 0.42 percent, and the Nasdaq contract down roughly 0.71 percent, with press attributing equity weakness to semiconductor pressure following commentary from artificial-intelligence executives about slowing development, compounded by elevated energy costs. Volatility expanded meaningfully, with the index moving to 17.10, up 7.95 percent on the day after ranging 16.58 to 18.17. Gold fell 1.60 percent to 4,338.2, which is notable: a genuine geopolitical escalation normally bids gold alongside crude, and gold declining while crude advanced suggests the market read today's flow as a commodity-supply event rather than a broad safe-haven event.
Brent settled at 105.68, up 1.07 or 1.02 percent, placing the Brent to WTI differential at approximately 4.29 dollars on settlement prices. WTI outperformed Brent on the day, advancing 1.34 percent against Brent's 1.02 percent, which narrows the spread slightly and is mildly consistent with US-specific tightness or with the American benchmark catching up to an internationally-led move.
4.6 Institutional Positioning (COT, Money Manager vs Commercial Hedger, Speculator Length)
The committed-positions data available is dated September 8, which makes it six days stale as of tonight. That staleness is material and should be weighted accordingly: the report predates the September 10 breakout session, the September 11 rejection and today's second rejection, so it describes the market before the most consequential three sessions of the move.
As of September 8, managed-money accounts held 218,960 long contracts against 107,229 short, a net long position of approximately 111,731, with longs increasing by 13,660 and shorts decreasing by 3,790 on the week. Both sides of that change point the same direction: speculative length was being added into strength. Broader non-commercial accounts held 350,118 long against 213,539 short, a net long of approximately 136,579, with longs up 17,670 and shorts up 11,002.
On the other side, commercial accounts held 889,086 long against 1,055,271 short, a net short of approximately 166,185, with shorts increasing 14,131 against longs increasing only 3,951. Swap dealers held 110,812 long against 585,913 short, with shorts increasing 9,724. Producers held 655,691 long against 346,775 short.
The structure is conventional for a rallying market: speculators adding length, commercial hedgers and swap dealers adding shorts against physical exposure. The inference worth drawing is about crowding rather than direction. A managed-money book that was already net long 111,731 six days ago, before the contract advanced another five dollars, is a book where the marginal buyer is scarce and the exit is narrow. That does not forecast a decline, but it explains why today's de-escalation statements produced a four-dollar reversal in three hours rather than a modest fade. This subsection rests on inference from stale data rather than measured current positioning and should be read as such.
5. No Liquid Options Proxy
This contract is analysed without an options-surface positioning dataset. Unlike the equity-index instruments, which use direct index positioning or an exchange-traded fund proxy, crude analysis here is built entirely on the physical-market stack. The available exchange-traded fund is too thin and too structurally eroded by curve effects to serve as a reliable positioning proxy, so this section relies on the physical and committed-positions data instead.
Positioning signal for this contract therefore comes from the following inputs, all of which are covered in section 4:
- The weekly committed-positions report, currently dated September 8 and six days stale, showing managed money net long approximately 111,731 and commercials net short approximately 166,185
- The weekly petroleum status report, next scheduled Wednesday, September 16 at 10:30 AM ET with consensus at a 1.35-million-barrel draw
- The industry-group weekly inventory bulletin, scheduled Tuesday, September 15 at approximately 4:30 PM ET, two hours after the pit close and inside the Globex session
- Producer-group policy signals, with no scheduled decision on the near calendar
- The forward-curve shape, currently in steep backwardation with October roughly 4.4 above November and roughly 13.1 above January 2027, which is the single most reliable tightness indicator available
- The Brent differential at approximately 4.29 and the product cracks detailed in section 4.4
Among these, the curve is the highest-quality real-time signal because it updates continuously and reflects the physical market's own pricing of immediate versus deferred barrels. It has not softened, which is the strongest argument against treating today's rejection as a top.
6. Forecast
Night Session (6:00 PM ET Monday to 3:00 AM ET Tuesday, Globex/Asia)
Bias is neutral with an upward lean. The contract is holding 0.45 to 0.60 above its settlement into the Globex break, having defended the session low within an hour of making it, and the curve has not softened. Asian demand character over the past several sessions has been constructive, with the Asian window consistently trading in the upper portion of the prior session's range. Chinese activity data is scheduled at 10:00 PM ET, covering industrial output with a 4.8 percent consensus against 4.5 percent prior, retail sales at 0.8 percent against 0.6 percent prior, and urban investment at negative 7.1 percent against negative 6.7 percent prior, followed by a statistics-bureau press conference. A materially weak industrial print would be the first demand-side challenge to the advance in two weeks.
The larger overnight risk is headline rather than data. Every geopolitical item catalogued in section 4.3 arrived outside a scheduled window, and two arrived after the pit close today. Expected Globex range is 100.80 to 103.20 absent a discrete headline, with the skew to the upside given the settlement-to-electronic recovery. A supply-disruption headline opens 104.05 quickly; a Hormuz-transit verification or a formal diplomatic channel opens 100.00.
London Session (3:00 AM to 8:00 AM ET Tuesday)
Bias is neutral. European sessions have been the source of the buying in each of the last two days, with today's advance from 102.43 to 103.83 occurring entirely within this window before the pit open. That pattern argues for respecting a London bid until it fails. Scheduled European data is second-order for crude: UK labour market figures at 2:00 AM ET with unemployment expected at 4.9 percent and average weekly earnings at 3.9 percent, French final inflation at 2:45 AM ET, German economic sentiment at 5:00 AM ET with consensus at 40 against 34.2 prior, and eurozone trade at 5:00 AM ET. A strong German sentiment beat would support the demand side marginally through the euro and through European industrial expectations, but none of these moves crude on its own. Expected London range is 101.00 to 103.50.
Morning Session (9:00 AM to 12:00 PM ET Tuesday, US Open / Pit Session)
Bias is neutral with a downward lean into the pivot. The pit opens at 9:00 AM ET and the first directional test typically resolves within the opening hour. The mechanical reference is 102.29, Tuesday's pivot, and the behaviour of price relative to that level through the first pit hour is the session's most informative signal. Acceptance above it restores the 103.00 to 103.15 band and then 104.04 as objectives. Rejection there sets up a drift toward 100.53 and the round-number band.
Scheduled US data is light. The New York regional manufacturing survey prints at 8:30 AM ET with consensus at 15 against 20.60 prior, which is a notable expected deterioration but is a second-order input for crude. Canadian wholesale sales print at the same time. There is no first-order energy data on Tuesday's morning calendar. Expected first-pit-hour range is 101.20 to 102.80.
Afternoon Session (12:00 PM to 2:30 PM ET Tuesday, NYMEX Pit Close)
Bias is neutral. A US twenty-year bond auction is scheduled at 1:00 PM ET, with the prior high yield at 5.204 percent and prior bid-to-cover at 2.530. A poor auction would pressure the dollar and support crude at the margin; a strong one does the reverse. A congressional cloture vote is scheduled at 2:15 PM ET, fifteen minutes before the pit close, which introduces the possibility of disorderly pricing directly into the settlement window and argues for treating the 2:15 PM to 2:35 PM ET band as mechanically unreliable. The industry-group weekly inventory bulletin is scheduled at approximately 4:30 PM ET, two hours after the pit close, and is the session's last and largest scheduled catalyst. Expected afternoon range is 101.00 to 103.00 into the pit close, with the evening Globex reaction to the inventory figures capable of carrying price outside that band.
Night Session Forward (6:00 PM ET Tuesday)
Residual bias depends entirely on whether Tuesday resolves the 102.29 question. The Globex reopen Tuesday evening carries elevated importance because it is the final liquid window before Wednesday's combined event risk, discussed in section 7. Positioning ahead of a same-day inventory print and central-bank decision typically compresses the Tuesday evening range and then expands it sharply on the Wednesday morning open.
Expected Range (Tuesday Full Session)
- Low-range scenario: 100.80 to 102.80
- Mid-range scenario (most likely): 100.00 to 103.60
- High-range scenario: 98.50 to 105.00
The mid-range scenario spans 3.60, slightly inside the 14-day average true range of 4.03, on the reasoning that Tuesday's pit session carries no first-order energy catalyst and sits immediately ahead of a heavily loaded Wednesday, which typically suppresses daytime range. Note that the scheduled 4:30 PM ET industry inventory release falls after the pit close, so the widest part of Tuesday's distribution belongs to the evening Globex session rather than to the pit hours these scenarios describe. The high-range scenario spans 6.50 and applies only if a discrete geopolitical headline lands during a liquid window.
Most Likely Path
The most probable path opens the pit session near 101.50 to 102.00, tests 102.29 within the first pit hour, and fails there on the first attempt, drifting back toward 101.00 through the late morning. From there the session likely balances between 100.53 and 102.29 for much of the afternoon, with the auction at 1:00 PM ET and the cloture vote at 2:15 PM ET providing two-way noise rather than direction. The settlement most likely lands between 101.00 and 102.00, close to today's. The alternative path, roughly a third as likely, is that the London bid carries through the pit open, 102.29 is accepted early, and the session runs at 104.04 by midday, where the pivot-resistance and prior-breakout-high confluence would be expected to hold on a first test. The scenario weights stated throughout this section are analyst judgement applied to the structure described above, not statistically derived probabilities.
7. Tuesday Economic Calendar
Tuesday's pit session is light on scheduled catalysts, but the day as a whole is not: it ends with a scheduled inventory release at approximately 4:30 PM ET. The overnight Asian block begins at 10:00 PM ET Monday with Chinese activity data, covering industrial output at a 4.8 percent consensus against 4.5 percent prior, retail sales at 0.8 percent against 0.6 percent, urban investment at negative 7.1 percent against negative 6.7 percent, and the unemployment rate at 5.2 percent, followed by a statistics-bureau press conference. This is the only genuine demand-side input on the entire Tuesday calendar and it arrives before European desks are at their screens.
The European morning opens at 2:00 AM ET with the UK labour market report, covering the unemployment rate at a 4.9 percent consensus, average weekly earnings at 3.9 percent against 4.1 percent prior, and earnings excluding bonuses at 3.5 percent. French final inflation follows at 2:45 AM ET at 2.7 percent on the harmonised measure. German economic sentiment prints at 5:00 AM ET with consensus at 40 against 34.2 prior, alongside current conditions at negative 52.1 against negative 61.1 and eurozone trade balance. An additional European central-bank speaker is scheduled at 10:00 AM ET.
The US session carries a Canadian wholesale sales print and the New York regional manufacturing survey, both at 8:30 AM ET, with the survey expected at 15 against 20.60 prior. The twenty-year bond auction results arrive at 1:00 PM ET, and a congressional cloture vote is scheduled at 2:15 PM ET, fifteen minutes ahead of the pit close. The evening brings New Zealand current account at 6:45 PM ET and Japanese trade data at 7:50 PM ET.
The first-order energy catalyst on Tuesday is the industry-group weekly inventory bulletin at approximately 4:30 PM ET, and it lands after the pit close. That is the single most consequential scheduled item for this contract on the day. During pit hours the calendar is genuinely thin, with the New York regional manufacturing survey second-order at best, so the daytime risk is dominated by unscheduled geopolitical headlines. The asymmetry is the point: the session's largest scheduled repricing event arrives when pit liquidity has already gone, which is precisely the configuration in which a position carried casually into the evening gets marked against a thin book.
Looking one day further is essential to Tuesday's sizing decision. Wednesday, September 16 carries the heaviest single-day event load of the month for this contract. US retail sales print at 8:30 AM ET with an 0.8 percent consensus against negative 0.6 percent prior. The weekly petroleum status report prints at 10:30 AM ET with a 1.35-million-barrel draw expected. The US interest rate decision and projections land at 2:00 PM ET, followed by the press conference at 2:30 PM ET. The economic calendar carries a forecast of 4 percent against a previous 3.75 percent, so the scheduled consensus is an increase rather than a hold, and investment-bank scenario commentary timestamped 9:03 AM ET Monday treats no move as a low-probability outcome. The calendar reading is the Monday 6:00 PM ET read of the economic calendar. An inventory print and a central-bank decision on the same day, four hours apart, with the press conference landing exactly at the pit close, is a configuration that makes Wednesday genuinely difficult to hold positions through. The Bank of England decision follows Thursday at 7:00 AM ET with a hold at 3.75 percent expected, and investment-bank commentary points to a Japanese rate increase on Friday that is described as fully priced.
The practical implication is direct: Tuesday is a positioning day inside a defined structure, not a day to commit maximum size. Full conviction belongs on the other side of Wednesday's 10:30 AM ET and 2:00 PM ET events, when the inventory picture and the rate path are both resolved.
8. Primary Trade Setup
Direction: Short
Rationale: Two consecutive sessions have rejected the 104.04 to 104.95 band, momentum oscillators are rolling from overbought territory with the fast stochastic line now beneath the slow line, speculative length was already crowded six days ago before a further five-dollar advance, and Tuesday's pit session carries no scheduled energy catalyst capable of extending the move. The fade is against strength into a proven supply band, not against the trend itself. The scheduled 4:30 PM ET industry inventory release is the reason this is a pit-session trade: it is a genuine two-sided repricing risk landing after the close, so the position is intended to be flat or materially reduced before it prints rather than carried through it.
Entry Zone: 102.90 to 103.30, on a rejection of the round-number band during the pit session.
Stop Loss: 104.20 (above the 104.04 to 104.05 pivot-resistance and prior-breakout-high confluence, giving a 0.90 to 1.30 buffer that respects this contract's 4.03 average true range)
Target 1 (T1): 101.39 (today's settlement, the first magnet and the level the post-settlement market has been defending)
Target 2 (T2): 100.53 (today's session low and the structural pivot of the higher-low sequence)
Target 3 (T3, extended): 99.63 (Tuesday first pivot support, in confluence with the 99.57 retracement, only if momentum extends through the round-number band on expanding volume)
Risk-to-Reward: Approximately 1:1.6 to T1, 1:2.3 to T2, 1:3.2 to T3, measured from a 103.10 entry midpoint against a 104.20 stop, giving 1.10 of risk against 1.71, 2.57 and 3.47 of reward.
Invalidation: A settlement above 104.46, the prior-week high, negates the fade thesis entirely. An intraday acceptance above 104.05 held for more than one pit hour on above-average volume is early warning that the third probe of the band will succeed where the first two failed.
Macro override: Any of the following voids the setup in real time regardless of price: a confirmed physical disruption to Strait of Hormuz transit, a further attack on producing or transit infrastructure, a producer-group statement indicating reduced output, or a surprise inventory draw materially larger than the 1.35-million-barrel consensus. In the opposite direction, formal verification that Hormuz transit is proceeding normally, or the announcement of a structured diplomatic channel with Iran, would accelerate the setup toward T3 and beyond and would argue for holding rather than taking profit at T1.
Alternate scenario: If the London bid carries through the pit open and 102.29 is accepted early, the fade is deferred rather than abandoned. In that case the reference becomes long from 102.20 to 102.45 on a retest of the reclaimed pivot, stop 101.25 beneath the session structure, T1 104.04 at the confluence band, T2 104.95 at the contract high. Position sizing on either side should run at one half to two thirds of an equivalent index allocation given the 4.03 average true range, and neither setup warrants full size given Wednesday's event load.
Sources and methodology
This outlook is built from our desk's session review of October WTI crude oil futures, prepared after Monday's 2:30 PM ET settlement on September 14, 2026, with evening electronic prices identified where they are used. Pivot levels are computed from Monday's high of 104.95, low of 100.53 and settlement of 101.39.
Crack spreads are computed from Monday's product settlements at 42 gallons per barrel and are not published figures. No options positioning dataset is used for this contract. Commitment figures are as of September 8 and predate the September 10 breakout.
China's August activity figures, released by the National Bureau of Statistics at 10:00 PM ET Monday, were added from published reports before publication. Scenario ranges are analyst judgment; they are not statistically derived and carry no calibration.
Outlooks for ES, NQ, GC and CL are collected on the market outlook page, and our forward trading record, recomputed from the record itself, is on the performance statement.
View pricing →


