
Six percent. That is how far the semiconductor complex fell on Monday after senior figures in artificial intelligence publicly backed a slower pace of frontier development, and the S&P 500 cash index gave up just 0.48 percent, closing near 7,620. Software gained about 5 percent. Healthcare added about 2 percent and consumer staples about 1 percent, so the money pulled out of the most capital-hungry corner of the index mostly went looking for cash-generative software and defensive sectors inside it.
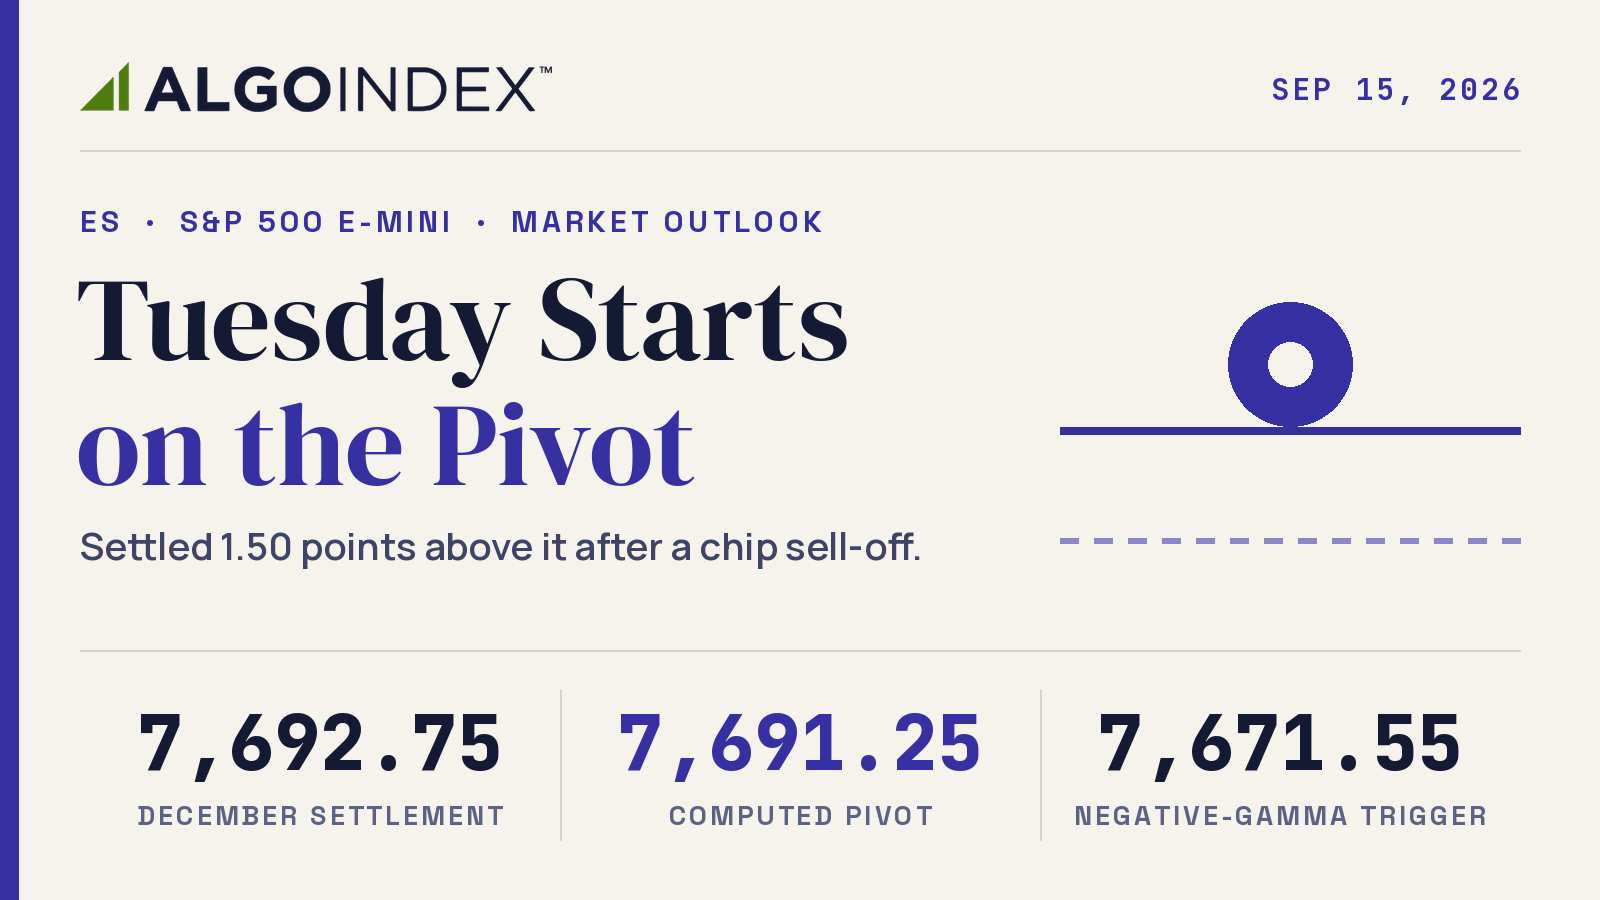
That rotation left the December E-mini contract in an unusual spot. It settled at 7,692.75 after a 58.50-point session between 7,661.25 and 7,719.75, just 1.50 points above the computed pivot at 7,691.25. Tuesday opens on the pivot. The modeled gamma-flip level at 7,683.55 sits 9.20 points lower, and 7,671.55, the level the positioning model treats as the edge of fully negative gamma, sits 21.20 points lower. Price looks orderly. Positioning does not, with the rate decision due Wednesday at 2:00 PM ET and a heavy week of protection buying already on the books.
December S&P 500 futures settled at 7,692.75, on top of the 7,691.25 pivot, after chipmakers fell about 6 percent and the cash index lost 0.48 percent. The key Tuesday levels are the 7,719.75 to 7,721.25 shelf overhead and the 7,671.55 negative-gamma trigger beneath. The primary setup is a short from 7,715 to 7,725 on a failed retest, stop 7,745, targets 7,691, 7,672 and 7,633, ahead of Wednesday's rate decision.
Lean bearish into the 1:00 PM ET auction. The short from resistance is primary; the long applies only at the trigger.
The shelf that failed and the pivot underneath
Monday's recovery died at 7,719.75. The computed first resistance sits 1.50 points higher at 7,721.25, so the two prices form one shelf, and it is the shelf the rally has already failed at once. Below it, the 50-day average at 7,703.15, the 5-day average at 7,708.25 and the 38.2 percent retracement from the 13-week high at 7,706.74 crowd into a smaller band that price has to clear before the shelf is even back in play.
Above the shelf the levels come quickly. The modeled volatility threshold at 7,736.55 marks the line between a mean-reverting session and an expansionary one. The 38.2 percent retracement from the four-week low backs it up six points higher, at 7,742.24. Then come the second computed resistance at 7,749.75, the 20-day average at 7,755.92 and the 50 percent retracement of the four-week range at 7,770.50. A sustained push through 7,770.50 opens 7,771.55. That is the futures equivalent of the 7,700 strike on the cash index, one of its four largest open-interest positions.
We built Monday's long above the 7,590 pivot on the cash index and parked the stop just beneath it. Monday's December low of 7,661.25 converts to within about two points of that line on the cash scale. The contract climbed from there into the cash open. Beneath the settlement the map is dense. The pivot, the flip level and the 7,671.55 trigger come first, then a shelf where Monday's low and the first computed support at 7,662.75 sit 1.50 points apart. The one-month low at 7,650.75 held by 10.50 points, so the descent from the 7,890.25 one-month high has no new swing low yet.
Momentum is soft. Relative strength reads 42.79 on the 9-day and 45.93 on the 14-day, climbing to 53.80 on the 100-day. Raw stochastics sit at 22.98, 21.00 and 17.54 on the 9, 14 and 20-day windows. The 14-day directional index at 13.31, with negative direction at 23.21 against positive direction at 16.81, describes a drift with no established trend. The multi-indicator composite reads 16 percent sell. Its short-term group reads 60 percent sell and its long-term group 67 percent buy.
A day of heavy insurance buying
The volatility index rose about 8 percent to close above 17. The volatility-of-volatility gauge added 4 percent to 95. An 8 percent jump against a 0.48 percent decline in the index is a ratio near seventeen to one, well beyond the roughly five-to-one relationship the two usually keep, and that gap is the signature of hedging demand.
Every gauge leaned the same way. Put open interest on the cash index stands at 14.447 million contracts against 10.31 million calls, a ratio of 1.40, and Monday's put volume of 1.132 million contracts ran 1.55 times the 728,823 calls traded. The 25-delta risk reversal sits at minus 0.044. Fixed-strike volatilities for the September 16 and September 18 expirations climbed roughly 3 to 4 points, to 15.6 percent and 16.0 percent at the money, which imply moves of about 98 and 100 basis points.
What separates Monday from an ordinary down day is where the hedges went. Real-time hedging flow on the S&P 500 registered about minus 9 billion dollars of delta, driven mostly by same-day expirations that decay within hours. On the Nasdaq the figure was about minus 3 billion dollars, and roughly minus 2.4 billion of it came from longer-dated put buying, protection with a multi-week horizon placed on the part of the index now carrying a regulatory headline channel.
Dealer positioning is balanced on a knife edge at the settlement. The gamma index on the cash index reads 0.707 and the tilt 1.043, with market-maker gamma notional at a positive 113.458 million dollars. The index-tracking ETF tells the opposite story, a tilt of 0.687 and gamma notional of minus 1.181 billion dollars. When one reading sits barely positive and the other firmly negative, the cushion that normally dampens intraday swings is thin. The positioning model's densest band sits right underneath price: conviction scores of 98.73, 97.19, 94.90 and 97.33 at 7,603, 7,611, 7,619 and 7,626 on the cash index convert to a futures band from 7,674.55 to 7,697.55, and the settlement sits inside it, 4.80 points below its top.
Five percent yields and an auction the day before the Fed
Ten-year Treasury yields hovered near 5 percent all session. Last week's data put them there: core consumer prices rose 0.3 percent against a 0.2 percent forecast, and producer prices ran 5.4 percent year over year against 5.3 percent, with the prior revised up to 4.8 percent. The economic calendar carries a 4 percent forecast for Wednesday's decision against a previous 3.75 percent, a scheduled 25 basis point increase, with projections at 2:00 PM ET and the press conference at 2:30 PM ET.
Tuesday's own test lands at 1:00 PM ET, when the Treasury auctions 20-year bonds. The prior sale cleared a 5.204 percent high yield with a 2.530 bid-to-cover. With the 10-year near 5 percent a day before a policy decision, a weak result is the most direct route to a fast afternoon drop in the index. A Senate cloture vote at 2:15 PM ET adds a second headline window.
The rest of the backdrop is loud. Iran's naval command said the Strait of Hormuz remains closed, a supertanker was reported burning after striking a mine south of the strait, and a damaged Saudi pipeline is expected to be mostly out of service for three to five weeks; sustained energy prices feed the inflation path now repricing the front of the curve. On the technology side, the House Speaker said the President will convene AI executives this week or next, and the House Minority Leader said his party would prioritise AI regulation if it won the chamber. No first-tier earnings reports sit on Tuesday's calendar.
The trade map for Tuesday
The primary setup is a short, and it needs a failed retest. The entry zone is 7,715 to 7,725, just under the shelf where Monday's rally stalled. The stop sits at 7,745, above both the 7,736.55 volatility threshold and the 7,742.24 retracement and below the 7,749.75 second computed resistance.
| Setup | Primary: short | Alternate: long |
|---|---|---|
| Condition | Failed retest of the Monday shelf | First test of 7,671.55 that holds |
| Entry zone | 7,715 to 7,725 | 7,672 to 7,680 |
| Stop | 7,745 | 7,658 |
| Target 1 | 7,691 (pivot 7,691.25) | 7,705 |
| Target 2 | 7,672 (trigger 7,671.55) | 7,720 |
| Target 3 | 7,633 (2nd computed support) | None |
| Reward to risk | 1.2, 1.9, 3.5 from 7,720, 25 points of risk | Reduced size |
| Invalidation | 30-minute close above 7,745 | Loss of the 7,661.25 to 7,662.75 shelf |
Measured from a 7,720 midpoint against 25 points of risk, reward runs about 1.2 times risk to the first target, 1.9 times to the second and 3.5 times to the third. That first target is thin. The 7,691.25 pivot sits inside the confluence band and clears the risk but falls short of a 1.5-to-1 exit, so the trade is built around the second target at the 7,671.55 trigger, with the first used to reduce. The third target at 7,633 needs the trigger to break and hedging flow to amplify the move. That would take a poor auction. A 30-minute close above 7,745 invalidates the idea, and a direct run through 7,725 without a rejection voids the entry. Two events retire the short immediately: a strong 20-year auction that pulls long-end yields lower, with a bid-to-cover above 2.530, or a credible de-escalation headline on the maritime supply route.
The reciprocal trade applies only if price reaches the trigger first. It is a long from 7,672 to 7,680 on a first test of 7,671.55 that holds, with a stop at 7,658 beneath the 7,661.25 to 7,662.75 shelf and targets at 7,705 and 7,720.
Scenario weights are analyst judgment. The low-range case, 7,665 to 7,720 with a 30 percent weight, rotates between the flip level and Monday's high. The mid-range case, 7,650 to 7,735 at 45 percent, breaks one boundary and reverts. The high-range case, 7,605 to 7,770 at 25 percent, needs the trigger to fail on a weak auction so negative gamma can do the rest. The most likely path opens near 7,691.25 and probes the 50-day average within the first hour. It fails before the shelf and slides back to the flip level by late morning, leaving the afternoon to the auction. A close beneath 7,662.75 would be the first structural break of the week, with the 7,650.75 one-month low next.
The cash index closed Monday about 20 points above 7,600, the strike where the positioning model says hedging stops cushioning the fall.
The complete data picture
Every figure behind the session for the December E-mini S&P 500: the key readings, the remaining charts, the full level map, then the complete numeric reference.
Complete level map, split at the December settlement 7,692.75. Cash equivalents for positioning-model levels are the published pairs.
| Resistance, top down | Support, top down |
|---|---|
| 8,071.55Primary gamma concentration strike, cash 8,000 | 7,691.25Computed pivot, cash 7,619.70 |
| 7,905.0052-week high | 7,690.55Confluence score 94.90, cash 7,619 |
| 7,890.25One-month high, cash 7,818.70 | 7,683.55Modeled gamma-flip level, cash 7,612 |
| 7,871.55Call-side boundary, cash 7,800 | 7,682.55Confluence score 97.19, cash 7,611 |
| 7,805.55Confluence score 91.66, cash 7,734 | 7,674.55Confluence band bottom, cash 7,603 |
| 7,798.7638.2% from 4-week high, cash 7,727.21 | 7,662.751st computed support, cash 7,591.20 |
| 7,789.55Confluence score 92.43, cash 7,718 | 7,661.25Monday low, cash 7,589.70 |
| 7,779.753rd computed resistance, cash 7,708.20 | 7,653.11Bottom of the implied one-day move |
| 7,774.55Confluence score 94.16, cash 7,703 | 7,650.75One-month low, cash 7,579.20 |
| 7,771.55Open-interest strike, cash 7,700 | 7,645.5050% of 13-week range, cash 7,573.95 |
| 7,770.5050% of 4-week range, cash 7,698.95 | 7,632.752nd computed support, cash 7,561.20 |
| 7,764.50One average true range above the settlement | 7,621.00One average true range below the settlement |
| 7,755.9220-day average, cash 7,684.37 | 7,618.27100-day average, cash 7,546.72 |
| 7,749.752nd computed resistance, cash 7,678.20 | 7,604.253rd computed support, cash 7,532.70 |
| 7,742.2438.2% from 4-week low, cash 7,670.69 | 7,584.2638.2% from 13-week low, cash 7,512.71 |
| 7,736.55Volatility threshold, cash 7,665 | 7,571.55Put-side boundary, cash 7,500 |
| 7,732.39Top of the implied one-day move | 7,421.55Modeled downside objective, cash 7,350 |
| 7,721.251st computed resistance, cash 7,649.70 | 7,386.0013-week low |
| 7,719.75Monday high, cash 7,648.20 | 7,346.06Year-to-date average |
| 7,708.255-day average | 7,311.75200-day average |
| 7,706.7438.2% from 13-week high, cash 7,635.19 | |
| 7,703.1550-day average, cash 7,631.60 | |
| 7,697.55Confluence band top, cash 7,626 |
Full numeric reference: every figure from the session review
1. Executive Summary
The S&P 500 cash index closed Monday at 7,619.96, down 0.48 percent from Friday's 7,656.98 close, while the December E-mini futures contract settled at 7,692.75 after trading a 58.50 point session range between 7,661.25 and 7,719.75. The index closed in the upper half of that range, at roughly the 54 percent mark, which is a materially better close than the headline decline suggests and is the first structural contradiction carried into Tuesday. The broader index complex was not uniformly weak: the Dow industrials gave back 0.29 percent while the Nasdaq 100 lost 0.82 percent, and the dispersion between them was entirely a sector story rather than an index-level risk event.
The dominant session driver was a sharp repricing of the semiconductor complex, where the sector ETF lost roughly 6 percent after leadership figures within the artificial-intelligence industry publicly supported slowing the pace of frontier development. That is a capital-allocation headline rather than a demand headline, and the session's internal behavior reflected that distinction. Capital did not leave the index. It rotated: software gained about 5 percent, healthcare about 2 percent, and consumer staples about 1 percent while the chip complex absorbed the selling. Adding to the pressure, ten-year Treasury yields hovered near the 5 percent area through the session, which compresses the discount-rate support beneath the longest-duration growth names precisely when their earnings narrative is being questioned.
The structural contradiction heading into Tuesday is the gap between a still-orderly price structure and a visibly defensive positioning stack. Price held above every near-term mechanical support, settled at 7,692.75 in the futures domain, 1.50 points above the next session's computed pivot at 7,691.25, and sits 9.20 points above the modeled gamma-flip level at 7,683.55 on the futures scale. Against that, the volatility index rose 8 percent to close above the 17 handle, the volatility-of-volatility measure added 4 percent to 95, put open interest on the index runs 1.40 times call open interest, put volume ran 1.55 times call volume, the 25-delta risk reversal sits at minus 0.044, and put implied volatility steepened against at-the-money implied volatility. Fixed-strike volatilities rose roughly 3 to 4 points across the September 16 and September 18 expirations. Participants spent the session buying insurance into a two-event week.
Tuesday itself is a low-density United States data day sitting one session ahead of Wednesday's 2:00 PM ET policy decision, projections release, and 2:30 PM ET press conference, with the quarterly triple-witching expiration following on Friday September 18. The primary setup below is therefore a short from the first computed resistance pivot band at 7,715 to 7,725 back toward the modeled gamma-flip level, with the negative-gamma trigger at 7,671.55 in the futures domain as the second objective and a stop above the modeled volatility threshold.
2. Price Action & Technical Structure
2.1 Intraday and Session Review
The December contract opened the Sunday evening Globex session at 7,680.00, marked its session low at 7,661.25, worked higher into the cash open, printed its session high at 7,719.75, and settled at 7,692.75. The 58.50 point range represents 0.76 percent of the settlement price and is meaningfully narrower than the 71.75 point fourteen-day average true range, so Monday was a contraction day in absolute terms even though the sector-level moves inside the index were violent. Closing-range position computes to 53.85 percent from the same session high, low and settlement, which places the settlement squarely in the upper half. That figure is derived from the futures session bar confirmed independently on the weekly chart, which carries the identical 7,719.75 high and 7,661.25 low because Monday is the only completed session in the current week.
Two session details matter for Tuesday. First, a roughly 12,000 lot same-day options structure built around the 7,640 area of the cash index acted as a ceiling through the mid-morning, opening near 10:20 AM ET and closing out near 10:50 AM ET, which explains why the recovery attempt stalled where it did rather than where the moving averages sit. Second, the model-implied one-day high at 7,644 on the cash index held cleanly, so the day traded inside its own implied envelope rather than breaking out of it. A session that respects its implied band on a 6 percent sector drawdown is a session where the index-level supply was rotational rather than directional.
The cash index close and the futures settlement are separate prints. The cash index closed at 7,619.96, down 0.48 percent against the 7,656.98 prior close. The 7,692.75 futures figure is the December contract settlement carried into the Tuesday Globex session, and every futures-domain calculation in this piece is computed from that settlement.
2.2 Daily Structure
The measured futures-to-cash offset for this session is plus 72.79 points, computed as the 7,692.75 futures settlement less the 7,619.96 cash close. The positioning model publishes its structural levels in both domains simultaneously and carries its own offset of plus 71.55 points across every paired level, so wherever a published pair appears below it is quoted verbatim in both domains rather than re-derived, and the 1.24 point difference between the two offsets is the measurement uncertainty on any level converted with the model's offset.
Against the daily structure, the settlement sits 197.50 points below the one-month high of 7,890.25, a 2.50 percent drawdown, and 212.25 points below the 52-week high of 7,905.00, a 2.69 percent drawdown. It sits 42.00 points above the one-month low of 7,650.75 and 306.75 points above the thirteen-week low of 7,386.00. The five-day change is minus 96.50 points, or minus 1.24 percent, which frames Monday as the continuation of a week-long drift rather than a single-day shock. The settlement sits 13.99 points below the 38.2 percent retracement from the thirteen-week high at 7,706.74 and 47.25 points above the 50 percent retracement from the thirteen-week high and low at 7,645.50. That band, 7,645.50 to 7,706.74, is the structural corridor the contract is currently resolving inside.
2.3 4-Hour and Swing Structure
Four-hour and one-hour bar values were not available for this edition, so the swing sequence below is derived from the confirmed daily and weekly bars and the published retracement ladder, and it should be read as structural inference rather than a measured four-hour sequence.
What is measurable: the contract has produced a sequence of lower session highs from the 7,890.25 one-month high, and Monday's 7,719.75 high sits below the 38.2 percent retracement from the four-week low at 7,742.24 and well below the 50 percent retracement from the four-week high and low at 7,770.50. The swing structure is a controlled descent with each recovery attempt capped beneath the prior retracement shelf. The 7,661.25 session low held above the 7,650.75 one-month low by 10.50 points, so the descending sequence has not yet produced a new swing low, and that non-confirmation is the single most important bullish fact on the chart.
2.4 Moving Averages
The moving-average stack is compressed and mixed, which is the signature of an index in transition rather than in trend. Against the 7,692.75 settlement: the five-day average at 7,708.25 sits 15.50 points overhead, the twenty-day at 7,755.92 sits 63.17 points overhead, and the fifty-day at 7,703.15 sits 10.40 points overhead. Below the settlement, the hundred-day average at 7,618.27 is 74.48 points beneath, the two-hundred-day at 7,311.75 is 381.00 points beneath, and the year-to-date average at 7,346.06 is 346.69 points beneath.
The read is straightforward. Every short and intermediate average is above price and every long average is well below it. The contract is in a primary uptrend that has surrendered its short-term and intermediate-term footing. The fifty-day at 7,703.15 is the nearest overhead average and sits only 10.40 points above the settlement, which makes it a same-session decision point rather than a swing target: a Tuesday open that cannot hold above it confirms that the intermediate structure has flipped to resistance, and reclaiming it opens the 7,721.25 computed first resistance pivot immediately above.
2.5 Oscillator and Trend Readings
Short-term momentum readings are depressed without being washed out. Relative strength reads 42.79 on the nine-day, 45.93 on the fourteen-day, 48.35 on the twenty-day, 52.63 on the fifty-day and 53.80 on the hundred-day, a clean ascending term structure that puts short-horizon momentum below neutral and long-horizon momentum above it. Raw stochastic readings are more stretched: 22.98 percent on the nine-day, 21.00 percent on the fourteen-day and 17.54 percent on the twenty-day, against 59.10 percent on the fifty-day and 69.19 percent on the hundred-day. Short-term oscillators are near the lower quartile of their ranges, which historically favors upward mean reversion but offers no timing.
The directional-index set is the more important read for Tuesday. The fourteen-day directional index sits at 13.31 with the negative directional indicator at 23.21 against a positive directional indicator of 16.81. The nine-day reads 19.18 with the same negative tilt, 24.17 against 15.04. A directional index in the low teens describes an environment with no established trend, and the negative tilt inside it describes a downward drift without conviction. That combination argues against carrying directional size through an event window and in favor of trading the mechanical levels.
Historic volatility runs 8.85 percent on the fourteen-day and 8.55 percent on the twenty-day, against 11.09 percent on the fifty-day. Implied volatility on the December option series stands at 13.91 percent with 95 days to the December 18 expiration, a premium of 5.06 points over realized fourteen-day volatility. The multi-indicator composite reads 16 percent sell overall, built from 60 percent sell on the short-term group, 25 percent sell on the medium-term group and 67 percent buy on the long-term group, with the trend signal on hold. That is the same message the averages give: short-term deterioration inside an intact long-term structure.
2.6 Volatility and Expected Range
The fourteen-day average true range is 71.75 points, or 0.93 percent. The nine-day reads 70.45 points, the twenty-day 74.35 points and the fifty-day 79.29 points. Average daily range runs 74.25 points on the nine-day, 66.55 points on the fourteen-day and 65.34 points on the twenty-day. A one-average-true-range projection from the 7,692.75 settlement spans 7,621.00 to 7,764.50.
The options-implied envelope is the tighter constraint. The positioning model carries a 0.52 percent implied one-day move on the cash index, which is a band 79.28 index points wide, or plus and minus 39.64 points. Applied to the futures settlement that maps to 7,653.11 to 7,732.39. The implied band is therefore about 7.53 points wider than the 71.75 point fourteen-day average true range, roughly 10 percent wider, and about 5.03 points wider than the 74.25 point nine-day average daily range. Options are pricing a marginally larger Tuesday than recent realized behavior delivered, which is consistent with a session that sits directly in front of a policy decision. The implied five-day move of 1.26 percent covers the decision and the quarterly triple-witching expiration together.
Event-specific implied volatility is the sharper number. At-the-money implied volatility stands at 15.6 percent for the September 16 expiration and 16.0 percent for the September 18 expiration, implying intraday moves of approximately 98 basis points and 100 basis points respectively. Both expirations repriced upward by roughly 3 to 4 volatility points during Monday's session.
3. Key Levels
All levels below are stated in the December futures domain with the cash-index equivalent in parentheses. Published positioning levels are quoted in both domains exactly as published and carry the model's plus 71.55 point offset. Computed pivot levels, session extremes and retracements are converted with that same offset and carry the 1.24 point measurement uncertainty described above. All pivot values are computed from Monday's confirmed session high of 7,719.75, low of 7,661.25 and settlement of 7,692.75.
3.1 Resistance
The first ceiling is Monday's session high at 7,719.75 (cash 7,648.20), which sits within two points of the computed first resistance pivot at 7,721.25 (cash 7,649.70). Those two prices form a single 7,719.75 to 7,721.25 shelf and represent the level the recovery failed at on Monday. Immediately beneath it, the fifty-day average at 7,703.15 (cash 7,631.60) and the 38.2 percent retracement from the thirteen-week high at 7,706.74 (cash 7,635.19) form a minor band that price must clear before the shelf is even in play.
Above the shelf, the modeled volatility threshold sits at 7,736.55 (cash 7,665), a published pair and the level that separates a mean-reverting environment from an expansionary one. The 38.2 percent retracement from the four-week low at 7,742.24 (cash 7,670.69) reinforces it within six points. Beyond that, the computed second resistance pivot at 7,749.75 (cash 7,678.20) and the 50 percent retracement from the four-week high and low at 7,770.50 (cash 7,698.95) bracket the next zone, with the 7,755.92 twenty-day average (cash 7,684.37) sitting inside it. A sustained move through 7,770.50 opens the published concentration at 7,771.55 (cash 7,700), which is one of the four largest open-interest strikes on the index and a genuine magnet rather than a shelf.
Higher still, the computed third resistance pivot at 7,779.75 (cash 7,708.20) and the 38.2 percent retracement from the four-week high at 7,798.76 (cash 7,727.21) cap the immediate structure, above which the call-side boundary at 7,871.55 (cash 7,800) and the one-month high at 7,890.25 (cash 7,818.70) define the recovery objective. The primary gamma concentration at 8,071.55 (cash 8,000) is far above the session and is not a Tuesday consideration.
3.2 Support
The first support is the computed pivot itself at 7,691.25 (cash 7,619.70), which sits 1.50 points below the settlement and is effectively the settlement price. That coincidence matters: Tuesday opens with price sitting on its own mechanical pivot, so the first thirty minutes of cash trade resolve directly into either the resistance shelf or the band below.
Beneath it, the modeled gamma-flip level at 7,683.55 (cash 7,612) is the first level with mechanical consequence. It is a published pair and a modeled underlying-price threshold rather than a listed contract, dated Monday evening's positioning update. Price settled 9.20 points above it on the futures scale, and the cash close sat 7.96 points above its cash equivalent. Below that threshold, market-maker hedging flips from dampening moves to amplifying them, and the positioning model explicitly treats the area beneath cash 7,600, equivalent to 7,671.55 in the futures domain, as fully negative gamma, with a stated downside objective of cash 7,350, equivalent to 7,421.55, if that area gives way. The 7,671.55 level is therefore the single most consequential price on the Tuesday map, sitting only 21.20 points below the settlement.
Below that trigger, the computed first support pivot at 7,662.75 (cash 7,591.20) sits almost exactly on Monday's 7,661.25 session low (cash 7,589.70), forming a 7,661.25 to 7,662.75 shelf, with the one-month low at 7,650.75 (cash 7,579.20) ten points beneath. The 50 percent retracement from the thirteen-week high and low at 7,645.50 (cash 7,573.95) and the computed second support pivot at 7,632.75 (cash 7,561.20) define the next zone down, followed by the hundred-day average at 7,618.27 (cash 7,546.72) and the computed third support pivot at 7,604.25 (cash 7,532.70). The put-side boundary at 7,571.55 (cash 7,500) is the deepest structural support relevant to this week and coincides with the 38.2 percent retracement from the thirteen-week low at 7,584.26 (cash 7,512.71) within thirteen points.
4. Macro Drivers
4.1 Dollar, Rates, and Fed Policy
Ten-year Treasury yields hovered around the 5 percent area through Monday's session and were an explicit contributor to equity pressure. The rates backdrop hardened last week: core consumer prices rose 0.3 percent month over month against a 0.2 percent forecast and a 0.2 percent prior on September 11, and producer prices ran 5.4 percent year over year against a 5.3 percent forecast on September 10, with the prior revised up to 4.8 percent. That sequence removed the disinflation argument that had supported duration through late August.
Wednesday's policy decision at 2:00 PM ET carries the statement, the updated projections and a 2:30 PM ET press conference. The economic calendar read Monday evening lists a forecast of 4 percent against a previous 3.75 percent, so the scheduled consensus is a 25 basis point increase, and investment-bank scenario commentary timestamped 9:03 AM ET Monday framed inaction as the low-probability outcome on the grounds that standing still would carry an institutional-credibility cost after last week's inflation prints. Those two captures agree on direction. No numerical market-implied probability is asserted here. The front end of the curve is therefore not cleanly priced. Fixed-strike volatilities for the Wednesday expiration repriced 3 to 4 points higher during Monday's session, which is consistent with that expectation without establishing it as the cause. Currency commentary noted the dollar opened the week firm on a combination of domestic and external developments, with last week's inflation print cited as the domestic driver.
Tuesday's own rates event is the 1:00 PM ET twenty-year bond auction, where the prior operation cleared at a 5.204 percent high yield with a 2.530 bid-to-cover. With the ten-year at the 5 percent area the day before a policy decision, a weak twenty-year auction is the most direct route to an equity air pocket during the Tuesday afternoon.
4.2 Large-Cap Leadership and Earnings
Monday was a leadership event, not an earnings event. The semiconductor sector ETF lost roughly 6 percent after senior figures in the artificial-intelligence industry publicly supported slowing the pace of frontier model development. That is a statement about capital intensity and deployment timelines rather than about end demand, which is why the broad technology ETF fell only 0.8 percent while the chip complex fell roughly seven and a half times as far.
The political layer compounded it. Press reports described a call from the President to the chief executive of the leading accelerator manufacturer during a conference appearance, criticising growing calls for tighter artificial-intelligence rules; a private meeting between the President and the chief executive of a major model developer at a party convention; a statement from the House Speaker that the President will convene with artificial-intelligence executives this week or next; and a statement from the House Minority Leader that his party would prioritise regulating artificial-intelligence if it won the chamber. The largest weight in the index now carries an active regulatory-headline channel that did not exist as a pricing factor a month ago. No first-tier earnings releases appear on the Tuesday calendar, so the leadership channel is headline-driven rather than results-driven for the coming session.
4.3 Geopolitical Backdrop
The energy-security situation deteriorated further through Monday. The Iranian naval command stated the Strait of Hormuz remains closed and under its control, a supertanker was reported afire after striking a naval mine south of the strait, and a Saudi crude pipeline damaged in earlier strikes was reported to be mostly out of service for three to five weeks of repairs. Additional Monday items included drone strikes on two Iranian fishing vessels, a Houthi claim of intercepting two Saudi fighter aircraft, a civil-defence warning and all-clear in the Najran province, and new United States sanctions on a Russian bank for sanctions-evasion involvement. The Iranian president stated publicly that his country has no intention of going to war with Saudi Arabia and repeated existing negotiating demands, and the President stated openness to determining whether the United States engages.
For the index this is a second-order but persistent input. Sustained energy prices feed the inflation path that is currently repricing the front end of the curve, which is the transmission channel into equity valuations. The positioning source noted that the oil ETF reached its highest level of the year while its implied-volatility rank sits at only 27 percent and demand for call skew at 68 percent has cooled relative to put skew at 51 percent, which describes an energy market that has moved on physical supply rather than on panic. That is the more benign version of this backdrop, and it is the version currently priced.
4.4 Sector Breadth and Rotation
The internal picture was the session's most constructive feature. Against the 6 percent semiconductor decline, software gained about 5 percent, healthcare about 2 percent and consumer staples about 1 percent. Capital rotated from the highest-multiple, highest-capital-intensity corner of the index into cash-generative software, defensives and staples. That reads as a positioning adjustment inside the equity allocation, and it is why the cash index lost only 0.48 percent on a day when its most-watched sub-sector lost about twelve times that.
Exchange-level advance-decline, volume-differential and short-term breadth readings were not available for this edition, so no breadth confirmation is offered. This subsection is inferred from sector-level performance rather than measured breadth, and the inference that breadth was better than the headline should be read that way.
4.5 Cross-Asset and Volatility
The volatility index rose 8 percent on the session to close above the 17 handle, a level the positioning model flags as a concentration point, and the volatility-of-volatility measure rose 4 percent to 95. The relationship is worth stating precisely: the volatility index is typically around five times more volatile than the cash index, and Monday delivered an 8 percent volatility move against a 0.48 percent index move, a ratio near seventeen to one. Volatility repriced far more than the index move alone would justify, which is a hedging-demand signature rather than a fear signature.
Ten-year yields near 5 percent, an oil complex at its highest level of the year, and a volatility surface bidding for downside protection into a policy week form a coherent cross-asset picture: participants expect the distribution of Wednesday outcomes to be wide and are paying to define their exposure to it in advance.
4.6 Institutional Positioning
Positioning data supports the same conclusion from four independent angles. Put open interest on the cash index stands at 14.447 million contracts against 10.31 million call contracts, a ratio of 1.40. Monday's put volume of 1.132 million contracts ran 1.55 times the 728,823 call contracts traded. The 25-delta risk reversal sits at minus 0.044, and put implied volatility steepened relative to at-the-money implied volatility during the session, which reads as institutional positioning for tail outcomes. Finally, real-time hedging flow on the Nasdaq registered roughly minus 3 billion dollars of delta, of which approximately minus 2.4 billion came from longer-dated put buying rather than same-day activity.
That last figure is the one that separates Monday from an ordinary down day. Longer-dated put buying concentrated in technology is a considered hedge with a multi-week horizon. Institutions bought duration in their downside protection on the part of the index that carries the new regulatory-headline channel.
5. SPX Options Flow Context
Real-time hedging flow on the S&P 500 registered approximately minus 9 billion dollars of delta across Monday's session, indicating significant options-driven downward delta pressure. The flow was driven primarily by same-day expiration options: the spread between the next-expiry series and the all-trades series remained narrow through the day, which is the signature of same-day rather than term activity. The contrast with the Nasdaq flow described above is the session's most informative positioning detail. Index-level pressure was mechanical and same-day, while technology-level pressure was deliberate and longer-dated.
The dealer-positioning stack is finely balanced at the settlement. The gamma index on the cash index reads 0.707 and the gamma tilt ratio reads 1.043, both marginally constructive, with estimated gamma notional for market-makers at a positive 113.458 million dollars. The ETF proxy tells the opposite story, with a tilt of 0.687 and gamma notional of minus 1.181 billion dollars. When the index measure sits barely positive and the ETF measure sits firmly negative, the dampening effect that suppresses intraday range is weak and conditional. The next-expiry share of total gamma stands at 8.36 percent.
The mapped confluence levels beneath the close are dense and carry high conviction scores. In the cash domain, 7,626 scores 97.33, 7,619 scores 94.90, 7,611 scores 97.19 and 7,603 scores 98.73, forming a tightly packed band from 7,603 to 7,626 that brackets Monday's 7,619.96 cash close. These are conviction scores from the positioning model, not calibrated probabilities. Converted with the model's offset, that band spans 7,674.55 to 7,697.55 in the futures domain. Most of it sits between the settlement and the negative-gamma trigger, but not all: the top 4.80 points run above the 7,692.75 settlement, so the settlement sits inside the band rather than on its upper edge. Above the close, 7,703 scores 94.16, 7,718 scores 92.43 and 7,734 scores 91.66 in the cash domain, equivalent to 7,774.55, 7,789.55 and 7,805.55 in the futures domain, so upside confluence is thin until well beyond the immediate resistance shelf.
The four largest structural strikes on the cash index are 8,000, 7,700, 7,600 and 7,000. The 7,600 strike, equivalent to 7,671.55 in the futures domain, is the level the positioning model treats as the boundary of fully negative gamma conditions. That coincidence, a major open-interest strike sitting exactly on the modeled negative-gamma boundary, is what gives the level its weight for Tuesday. Below it the model points toward cash 7,350. The modeled gamma-flip level at cash 7,612 sits between the settlement and that trigger, and is a modeled underlying-price threshold rather than a listed contract, dated Monday evening's update. The published high-volatility and low-volatility points read 8,170 and 7,745 respectively, an ordering that is inconsistent with the rest of the surface, so they are excluded from the level map.
6. Forecast
Scenario weightings below are analyst judgment applied to the measured structure. They are not statistically derived and carry no historical calibration.
Night Session (6:00 PM ET Monday to 3:00 AM ET Tuesday, Globex/Asia)
Bias is neutral with a mild upward drift. The contract reopened at 7,699.25, has held a 7,695.00 to 7,700.25 band in the first half hour, and is trading 3.75 points above the settlement. Volume is negligible at 2,233 contracts against 585,620 of open interest, so early Globex prints carry no information weight. The scheduled catalyst is the Chinese activity data at 10:00 PM ET, covering industrial output forecast at 4.8 percent, retail sales at 0.8 percent, the unemployment rate at 5.2 percent and urban investment at minus 7.1 percent, followed by a statistics-bureau press conference. A material downside miss on Chinese retail sales is the one overnight input capable of moving the index complex before London. Expected band 7,675 to 7,712.
London Session (3:00 AM to 8:00 AM ET Tuesday)
Bias is neutral to slightly lower. European trade opens with the United Kingdom labour market report at 2:00 AM ET, covering an unemployment rate forecast at 4.9 percent and average weekly earnings at 3.9 percent against 4.1 percent prior, followed by final French inflation at 2:45 AM ET and the German investor sentiment survey at 5:00 AM ET, forecast at 40 against 34.2 prior. A firm German sentiment print supports European equity and typically imports a mild bid into the index complex; a weaker wage print in the United Kingdom does the same through the rates channel. Neither is a first-order driver for the index. Dollar strength into the London morning is the cross-read to watch, since a firmer dollar alongside a 5 percent ten-year yield is the combination that pressures the index open. Expected band 7,668 to 7,715.
Morning Session (9:30 AM to 12:00 PM ET Tuesday, RTH Open)
Bias is neutral with a downward tilt. The scheduled morning input is the New York regional manufacturing survey at 8:30 AM ET, forecast at 15 against 20.60 prior, released an hour before the cash open. It is a second-tier print and its usual effect is to colour the opening tone rather than the session. The cash open at 9:30 AM ET delivers the session's first directional test, and the level map is unusually clean: the settlement at 7,692.75 sits 1.50 points above the computed pivot at 7,691.25, so the open resolves immediately in one direction or the other. Upside work runs into the fifty-day average at 7,703.15 and then the 7,719.75 to 7,721.25 shelf. Downside work runs into the modeled gamma-flip level at 7,683.55 and then the 7,671.55 negative-gamma trigger. The morning is most likely a rotation between those two boundaries. Expected band 7,665 to 7,722.
Afternoon Session (12:00 PM to 4:00 PM ET Tuesday)
Bias is neutral with widening two-sided risk. The 1:00 PM ET twenty-year auction is the session's first-order event and carries genuine index consequence with the ten-year near 5 percent. A high yield that clears well above the prior 5.204 percent with a bid-to-cover beneath the prior 2.530 pressures duration and the index together, and is the most direct route to a test of 7,671.55 in the same hour. A well-bid auction does the reverse and opens a squeeze toward 7,736.55. A cloture vote at 2:15 PM ET adds a legislative headline channel into the afternoon. Pricing is likely to be disorderly in the minutes immediately surrounding the 1:00 PM ET auction result. The final hour carries positioning adjustment ahead of Wednesday's decision, which typically compresses range rather than expanding it. Expected band 7,660 to 7,730.
Night Session Forward (6:00 PM ET Tuesday)
Residual bias is neutral and range-bound. The Globex reopen sits inside the twenty-four hours preceding the policy decision, a window in which directional positioning is routinely reduced rather than added. New Zealand current account data at 6:45 PM ET and Japanese trade data at 7:50 PM ET are the only scheduled items and carry no index relevance. Expect a narrow band around whatever Tuesday's cash close establishes.
Expected Range (Tuesday Full Session)
- Low-range scenario: 7,665 to 7,720 (55 points, approximately 77 percent of the 71.75 point fourteen-day average true range; the index rotates between the gamma-flip level and Monday's high without resolving, weight 30 percent)
- Mid-range scenario (most likely): 7,650 to 7,735 (85 points, approximately 1.18 times the fourteen-day average true range; one boundary breaks and reverts, weight 45 percent)
- High-range scenario: 7,605 to 7,770 (165 points, approximately 2.30 times the fourteen-day average true range; the 7,671.55 trigger breaks on a weak auction and negative gamma conditions amplify the move, weight 25 percent)
Most Likely Path
The most probable path opens near the 7,691.25 pivot, attempts the fifty-day average at 7,703.15 within the first hour, and fails somewhere between there and the 7,719.75 to 7,721.25 shelf where Monday's recovery already failed once. That failure carries price back through the pivot into the modeled gamma-flip level at 7,683.55 during the late morning, where the dense confluence band between 7,674.55 and 7,697.55 in the futures domain slows the decline. The afternoon then hinges entirely on the 1:00 PM ET auction: a clean auction holds the flip level and produces a quiet drift into the close inside the low-range scenario, while a poor auction takes price through 7,671.55 and into the 7,661.25 to 7,662.75 shelf where Monday's low and the computed first support pivot coincide. A close beneath 7,662.75 would be the first structural break of the week and would put the one-month low at 7,650.75 in play ahead of the decision.
7. Tuesday Economic Calendar
The Tuesday session is bookended by an unremarkable data slate and one genuinely consequential afternoon event. The Asian overnight carries Chinese activity data at 10:00 PM ET Monday, with industrial output forecast at 4.8 percent against 4.5 percent prior, retail sales at 0.8 percent against 0.6 percent, the unemployment rate at 5.2 percent and urban fixed investment at minus 7.1 percent against minus 6.7 percent, followed by the statistics-bureau press conference; a reserve-bank speaker in Australia precedes it at 7:00 PM ET. The European morning opens with the United Kingdom labour market report at 2:00 AM ET, where the unemployment rate is forecast unchanged at 4.9 percent, employment change at minus 5,000 against minus 13,000 prior, average weekly earnings at 3.9 percent against 4.1 percent and earnings excluding bonuses at 3.5 percent. Final French inflation follows at 2:45 AM ET with the harmonised year-over-year measure forecast unchanged at 2.7 percent, and the German investor sentiment survey lands at 5:00 AM ET with the expectations component forecast at 40 against 34.2 prior and current conditions at minus 52.1 against minus 61.1. The Eurozone trade balance accompanies it.
The United States morning is thin. Canadian wholesale sales and the New York regional manufacturing survey share the 8:30 AM ET slot, the latter forecast at 15 against 20.60 prior, and a European central bank speaker appears at 10:00 AM ET. The single first-order event for the index is the 1:00 PM ET twenty-year bond auction, where the prior operation cleared a 5.204 percent high yield with a 2.530 bid-to-cover; with ten-year yields at the 5 percent area on the eve of a policy decision, the twenty-year auction is the cleanest read available on whether the long end will absorb supply at current levels, and a poor result transmits into the index within minutes. A legislative cloture vote at 2:15 PM ET is the secondary afternoon headline risk. The evening closes with New Zealand current account data at 6:45 PM ET and Japanese trade figures at 7:50 PM ET.
The wider week dominates the session. Wednesday September 16 brings United States retail sales at 8:30 AM ET, the policy decision, statement and projections at 2:00 PM ET and the press conference at 2:30 PM ET, alongside the volatility-index expiration. Thursday September 17 brings the Bank of England decision at 7:00 AM ET, where the bank rate is expected to hold at 3.75 percent, United States jobless claims, housing starts and the Philadelphia regional survey at 8:30 AM ET, and the Bank of Japan decision at 11:30 PM ET, where a move to 1.25 percent from 1.00 percent is the market case. Friday September 18 is the quarterly triple-witching expiration, with United States industrial production at 9:15 AM ET. Tuesday is therefore a positioning session ahead of three consecutive event days, and size committed on Tuesday is size carried into an event window.
8. Primary Trade Setup
Direction: Short
Rationale: Monday's recovery already failed once at the 7,719.75 to 7,721.25 shelf, the multi-indicator composite reads 16 percent sell with the negative directional indicator dominant, and the modeled negative-gamma trigger sits only 21.20 points below the settlement, so a failed retest of that shelf offers a defined-risk entry into the densest confluence band on the map.
Entry Zone: 7,715 to 7,725
Stop Loss: 7,745 (above BOTH the modeled volatility threshold at 7,736.55 and the 38.2 percent retracement from the four-week low at 7,742.24, and below the computed second resistance pivot at 7,749.75; beyond this band the environment turns expansionary and the short thesis no longer applies)
Target 1 (T1): 7,691 (the computed pivot at 7,691.25, which the settlement is sitting on, inside the high-conviction confluence band whose upper edge is 7,697.55)
Target 2 (T2): 7,672 (the 7,671.55 modeled negative-gamma trigger, coinciding with the cash 7,600 structural strike)
Target 3 (T3, extended): 7,633 (the computed second support pivot at 7,632.75, reachable only if the trigger breaks and hedging flow amplifies the move, which requires a poor 1:00 PM ET auction)
Risk-to-Reward: Approximately 1:1.2 to T1, 1:1.9 to T2, 1:3.5 to T3, measured from a 7,720 entry midpoint against 25 points of risk. T1 clears the risk but falls below this desk's 1.5-to-1 minimum for a full exit, so it is structured as a second-target trade with T1 used to reduce.
Invalidation: A thirty-minute close above 7,745, which places price above both the modeled volatility threshold at 7,736.55 and the 38.2 percent retracement at 7,742.24, and reopens the 7,749.75 to 7,779.75 pivot band. A direct move through 7,725 without a prior rejection wick also voids the entry, since the setup requires a failed retest rather than a breakout chase.
Macro override: A twenty-year auction at 1:00 PM ET clearing well through the prior 5.204 percent high yield with a bid-to-cover above 2.530 pulls long-end yields lower and can squeeze the index through 7,745 within the hour. A credible de-escalation headline on the maritime supply route situation does the same through the energy and inflation channel. Either condition retires the short on the spot rather than waiting for the stop.
Alternate setup: Long from 7,672 to 7,680 on a first test of the modeled negative-gamma trigger that holds, stop 7,658 beneath the 7,661.25 to 7,662.75 shelf, targets 7,705 and 7,720. This is the reciprocal of the primary and applies only if price reaches the trigger before it reaches the resistance shelf.
Sources and methodology
This outlook is built from our desk's session review of the December E-mini S&P 500 contract, prepared after Monday's close on September 14, 2026. Computed pivot, standard-deviation and retracement levels are calculated from Monday's session high, low and settlement, and every moving-average, oscillator and range reading is Monday's. The S&P 500 cash close of 7,619.96 is the published index close.
Positioning-model levels are quoted in the pairs the model publishes, which carry a 71.55-point offset between futures and cash. Other conversions use the measured offset of 72.79 points between the December settlement and the cash close. Modeled levels such as the gamma-flip level and the negative-gamma trigger are thresholds produced by a positioning model, not listed option strikes, and they move as positioning changes.
Prices are as of Monday evening. Scenario weightings are analyst judgment; they are not statistically derived and carry no calibration.
Outlooks for ES, NQ, GC and CL are collected on the market outlook page, and our forward trading record, recomputed from the record itself, is on the performance statement.
View pricing →


