
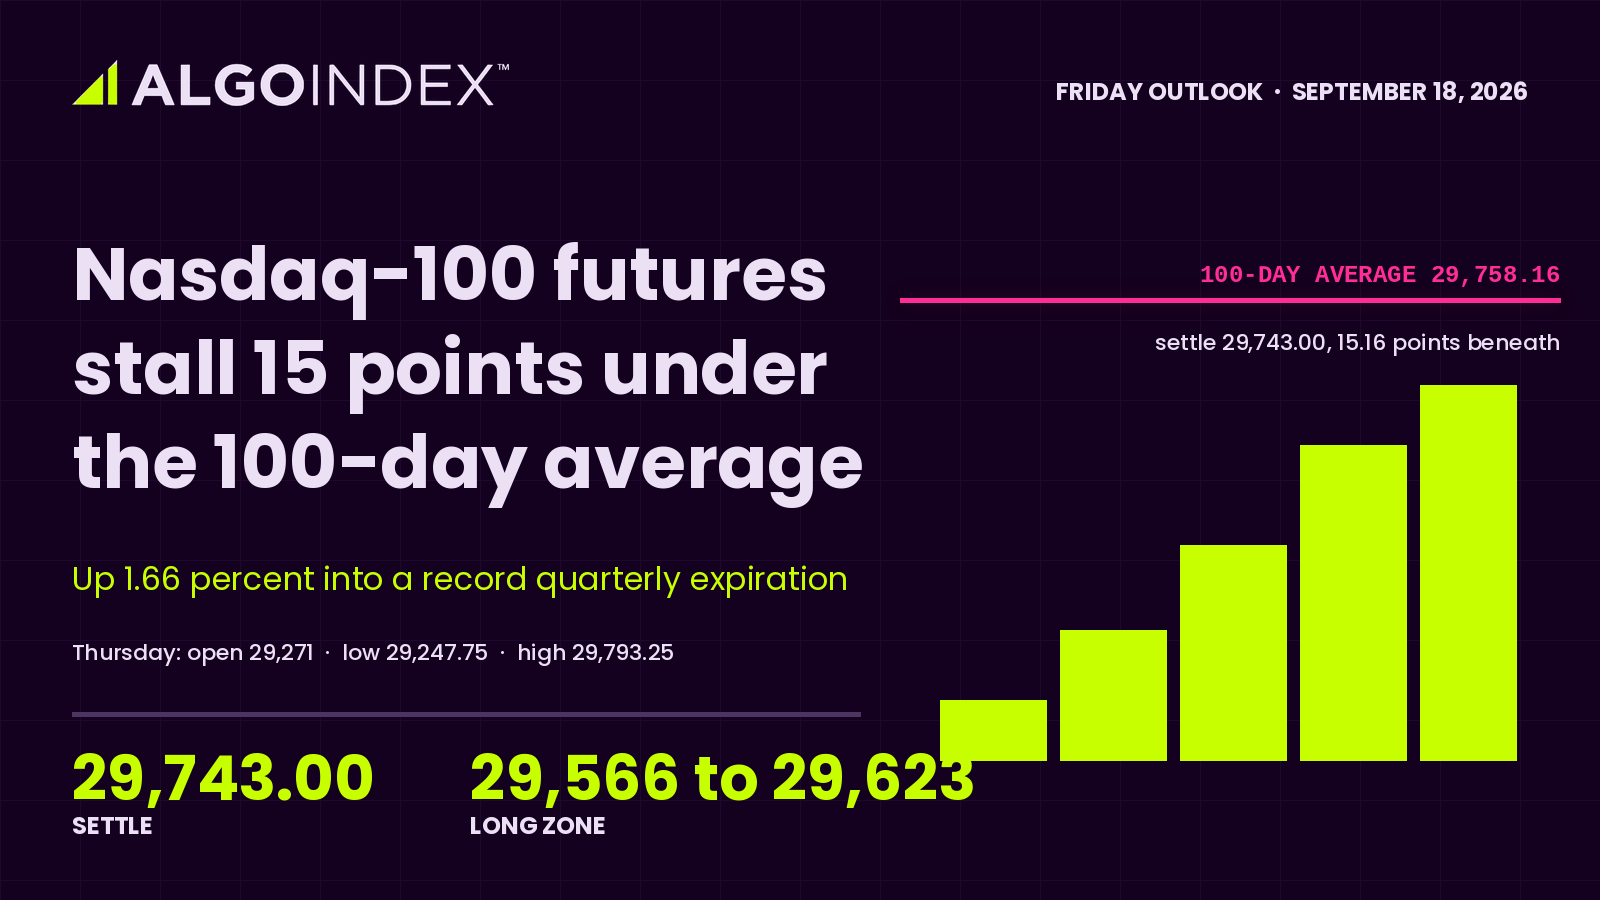
The December Nasdaq-100 contract opened Thursday at 29,271.00, printed a low of 29,247.75 just 23.25 points beneath that open, and ran to 29,793.25. It settled at 29,743.00, up 486.25 points or 1.66 percent, 90.8 percent of the way up a 545.50 point range. The daily bar does not show the path between the extremes. It does show a 472.00 point body, a 23.25 point lower shadow and a 50.25 point upper shadow, which is the shape of a trend session.
The high pushed 35.09 points through the 100-day average at 29,758.16. The settlement gave that back and finished 15.16 points beneath it. Thursday cleared the most significant average above price intraday and could not hold the reclaim into the close, which is a different position from never having reached it. The reopened evening session traded 29,674.50 to 29,728.50 on 4,372 contracts and sat near 29,680, 63 points below the settlement.
December Nasdaq-100 futures settled at 29,743.00, up 1.66 percent, the strongest advance of the four contracts we cover, and stalled 15.16 points beneath the 100-day average at 29,758.16. Resistance runs from that average through the 29,793.25 session high to the first pivot resistance at 29,941.58. Support is the 29,566 to 29,623 band where the 50-day average, the pivot point and the 20-day average sit within 57.28 points. The primary setup is a long from 29,566 to 29,623, stop 29,470, targets 29,758, 29,941 and 30,109, at half size into Friday's quarterly expiration, carried in the options positioning data rather than a verified calendar and unconfirmed.
Stopped out by 8.25 points
Thursday's outlook set a short from 29,545 to 29,568 with a stop at 29,785. The zone filled and Thursday's high reached 29,793.25. Stopped out by 8.25 points. We record the result as it stands. The lesson is in the driver, which sat outside technology. Crude fell 3.41 percent intraday, the expected inflation path eased, and stocks and bonds rallied together one day after the Federal Reserve raised its target range to 3.75 to 4.00 percent, the first increase since July 2023.
Within that broad move, technology led. The semiconductor fund gained 3.4 percent against the technology fund's 1.7 percent, a two-to-one ratio from the highest-beta part of the market. About three billion dollars of positive single-stock delta flow crossed, more than half of it from the mega-capitalisation complex, driven by longer-dated call buying. Longer-dated call buying after a hawkish central bank is a statement about earnings power in a higher-rate world. Compute demand added texture: an accelerator designer committed two billion dollars to an infrastructure fund at 12:55 PM ET, and a cloud operator was reported raising rental rates across four generations of that designer's chips at 9:37 AM ET. Rising rental rates are a direct demand signal.
A whole positioning structure cleared in one day
The cash index closed at 29,436.60, up 1.70 percent. Measured against Wednesday's 28,945 reference close, that finish sits above the call-side hedging boundary at 29,275, the modeled volatility threshold at 29,070, the primary gamma concentration and put-side boundary at 29,000, and the modeled gamma-flip level at 28,655. It cleared three of the four listed key strikes; the 29,500 strike sits 63.40 points above the close. Those are cash levels. The measured futures premium is 306.40 points, and none of them is converted into a futures price here.
This index carries the only positive dealer gamma in the complex, 6.28 million dollars of notional with a gamma tilt of 1.06, against negative 610 million on the broad index, negative 990 million on the technology fund, negative 191 million on the small-capitalisation index and negative 2.297 billion on its fund. Positive dealer gamma means hedging flows lean against price movement. On an expiration day of record size, that is the difference between an orderly close and a disorderly one. The technology fund runs the other way. Call gamma reads negative 285 million against put gamma of negative 2.5 billion, with next-expiry gamma at 8.03 percent. Its published levels are a modeled volatility threshold at 711, a gamma concentration at 700, a call-side boundary at 720 and a modeled gamma flip at 714, against a 704 reference. The fund closed at 716.41 against a previous close of 704.75, up 1.65 percent, on volume of 31,932,941 shares. The 25-delta risk reversal on the index reads negative 0.062, the most negative in the table, so puts are still bid over calls.
Three averages inside half a day's range
The 20-day, 50-day and 100-day averages span 192.20 points, from 29,565.96 to 29,758.16. That is under half of a single 14-day average true range of 421.22 points. Friday will very likely trade through several of them. The 20-day at 29,623.24, the pivot point at 29,594.67 and the 50-day at 29,565.96 sit inside 57.28 points and form the support band this outlook builds its setup around. The 5-day average at 29,480.05 is the invalidation reference, and the first pivot support is 29,396.08.
Above the settlement the map starts with the 100-day average at 29,758.16, then Thursday's high at 29,793.25 and the first pivot resistance at 29,941.58. The one-month high at 30,109.25 sits 30.92 points beneath the second pivot resistance at 30,140.17. That band is the most substantial on the board. The third pivot resistance is 30,487.08, and the 13-week and 52-week highs are 31,293.50 and 31,385.50, the latter 5.52 percent above the settlement. Below, Thursday's low at 29,247.75 leads to the 29,049 to 29,053 band where the second pivot support and the one-month low sit 3.83 points apart, then the third pivot support at 28,850.58. The 200-day average is 27,857.21.
The mechanical indicators have not caught up. The 14-day relative strength index is 51.25. The 14-day stochastic fast line reads 49.74 percent against 35.02 on the slow line, mid-range. The 14-day directional index is 14.41, far beneath the 20 threshold, with negative direction at 21.67 still above positive at 16.47. The composite reads 16 percent sell at minimum strength. The five-day change is 20.00 points, or 0.07 percent. Thursday recovered the week instead of extending it, and 14-day historic volatility is 12.72 percent.
The trade map for Friday
The primary setup is a long from 29,566 to 29,623 on a pullback into the three-way confluence. The stop is 29,470, beneath the 5-day average. The first target is the 100-day average at 29,758, the second the first pivot resistance at 29,941, and the third the one-month high at 30,109, only on momentum through the second.
From the 29,594.50 midpoint the risk is 124.50 points. The first target returns 163.50 points, about 1.3 times that risk, the second 346.50 points or 2.8 times, and the third 514.50 points or 4.1 times. Filled at the top of the zone, the first target pays 135 points against 153 of risk, a ratio of 0.88, so an entry near 29,623 does not clear one unit of risk on the first objective. Half size. Friday is, per the options positioning data rather than a verified calendar and unconfirmed, the September quarterly expiration, with roughly twenty percent of listed US options expiring or rolling and a delta-notional total set to exceed June's record. Expiration flows can carry price through the entry zone without a retest, in which case the setup does not activate.
The overnight carries a real catalyst. Japanese inflation at 7:30 PM ET, headline expected at 2.0 percent and core at 1.8 percent, and a Bank of Japan decision at 11:30 PM ET on a tentative statement time, with consensus for an increase to 1.25 percent from 1.00 percent, are carried on the news calendar and unconfirmed against a primary source. A second major central bank tightening in the same week lifts global term premium. This is the most duration-sensitive of the four contracts. Thursday's ten-year inflation-protected auction cleared at 2.653 percent against 2.438 percent previously; the index rose 1.66 percent anyway. That is the most surprising relationship in the data.
Friday's US slate is industrial production and capacity utilisation at 9:15 AM ET, expected at 0.3 percent and 76.4 percent, the one verified entry, followed by Federal Reserve commentary from Bowman at 9:30 AM ET and Schmid at 11:45 AM ET, both carried on the news calendar only and unconfirmed. Scenario ranges are analyst judgment. They run 29,600 to 29,900 in the low-range case, 29,450 to 30,000 most likely, 29,250 to 30,150 in the high-range case, against a one-ATR envelope of 29,321.78 to 30,164.22. The most likely path opens near 29,680, tests 29,758.16 during the morning and resolves the session there. Acceptance and a clearance of 29,793.25 open 29,941.58 and the 30,109 to 30,140 band. Rejection returns price to 29,566 to 29,623. Roughly one time in five, the largest rolls decide the direction and the outer markers are 29,049 to 29,053 and 30,109 to 30,140.
Between 2:00 PM ET and the 4:00 PM ET cash close, the rolls concentrate, and a 15-point question becomes a 500-point answer.
The complete data picture
Every number behind Friday’s plan, charted first, then the full level map, then the complete numeric reference underneath.
Full numeric reference, every remaining figure from the session review
Level notes
29,758.16 is the 100-day moving average and sits just 15.16 points above the settlement. It is the nearest resistance of any kind. Thursday traded through it and failed to hold the reclaim, so Friday's session is a retest rather than a first test.
29,793.25 is Thursday's session high, 50.25 points above the settlement, and clearing it is the minimum evidence that the trend day is extending rather than stalling.
29,941.58 is the first pivot resistance, computed from Thursday's verified session bar, and the primary upside objective for the session.
30,109.25 is the 1-month high, and the first level whose breach would end the month-long range to the upside.
30,140.17 is the second pivot resistance, sitting 30.92 points above the one-month high. The convergence of a mechanical objective and a structural high inside 31 points makes the 30,109 to 30,140 band the most substantial resistance on the board.
30,487.08 is the third pivot resistance, the extended objective, which would require roughly 1.8 average ranges from the settlement.
31,293.50 is the 13-week high and 31,385.50 the 52-week high, 5.52 percent above the settlement. Neither is a Friday level, but together they define the ceiling of the larger structure.
29,623.24 is the 20-day moving average, 119.76 points below the settlement and the upper edge of the primary support band.
29,594.67 is the pivot point from Thursday's verified bar, sitting 28.57 points beneath the 20-day average.
29,565.96 is the 50-day moving average, completing a three-way confluence with the pivot point at 29,594.67 and the 20-day average inside 57.28 points. This 29,566 to 29,623 band is the entry zone for the primary setup and the most defensible support on the board.
29,480.05 is the 5-day moving average and the level whose loss would invalidate the setup.
29,396.08 is the first pivot support, the first mechanical objective beneath the moving-average confluence.
29,247.75 is Thursday's session low, 23.25 points beneath the open and 495.25 points beneath the settlement.
29,053.00 is the 1-month low, and 29,049.17 is the second pivot support, the two sitting within 3.83 points of each other. That coincidence makes the 29,049 to 29,053 band the structural line for the entire month-long range.
28,850.58 is the third pivot support and the deepest level with mechanical basis for Friday.
2.1 Intraday and Session Review
The bar's range ran 545.50 points to a high of 29,793.25, and the contract settled at 29,743.00, only 50.25 points off the high. Whether the advance was continuous or included retracements cannot be read from the daily bar.
Crude and gold both printed lows far beneath their prior settlements; the Nasdaq contract's low sat within 24 points of its own open. The daily bar does not show whether the buying was continuous.
The close quality is strong but arrives with one qualification. The advance carried 35.09 points through the 100-day average at 29,758.16 on a high basis, then gave that back to settle 15.16 points beneath it. The index therefore cleared the most significant average above it intraday and could not hold the reclaim into the settlement. That is a materially different position from never having reached it.
The overnight session that reopened at 6:00 PM ET has traded 29,674.50 to 29,728.50 and sits near 29,680, roughly 63 points below the Thursday settlement on thin volume of 4,372 contracts. The contract enters Friday having given back a small portion of the advance.
2.2 Daily Structure
The daily structure is a recovering uptrend in the middle of its range. The 52-week high is 31,385.50 and the settlement sits 5.23 percent beneath it. The 52-week low is 23,429.00, which the settlement stands 26.95 percent above. The 13-week high is 31,293.50, the 1-month high 30,109.25, and the 1-month low 29,053.00.
The narrower structure is where the interest lies. Thursday's low of 29,247.75 sits 194.75 points above the one-month low, and Thursday's high of 29,793.25 sits 316.00 points below the one-month high. The contract is trading inside a well-defined month-long range, and Thursday's bar spans it from a low in the lower third to a high in the upper third.
The five-day change of positive 20.00 points, or 0.07 percent, deserves emphasis because it shows how much of this week was spent going nowhere. Thursday's 486.25 point advance essentially recovered the week's earlier losses rather than breaking new ground.
2.3 4-Hour and Swing Structure
The swing sequence is a higher low against an unchanged high. Thursday's 29,247.75 low is above the one-month low at 29,053.00, while the one-month high at 30,109.25 remains untested. That is a compression pattern, and the session that resolves it is more likely to be Friday than not, given the expiration.
The daily candle is a large bullish trend bar: an open near the low, a settlement near the high, a 472.00 point body from open to settlement, a 23.25 point lower shadow and only a 50.25 point upper shadow. Bars of that shape indicate continuation more often than exhaustion, with the standard caveat that this one terminated at a moving average rather than in open space.
2.4 Moving Averages
The stack is constructive but compressed, and its compression is the most useful observation available. The settlement at 29,743.00 sits above the 5-day average at 29,480.05 by 262.95 points, above the 20-day at 29,623.24 by 119.76 points, above the 50-day at 29,565.96 by 177.04 points, and far above the 200-day at 27,857.21 by 1,885.79 points. It sits below only the 100-day at 29,758.16, and by just 15.16 points.
The 20-day, 50-day and 100-day averages span only 192.20 points between 29,565.96 and 29,758.16, which is under half of a single 14-day average true range. Three major averages inside half a day's range is an unusually tight configuration, and it means Friday's session will very likely trade through several of them. The 20-day at 29,623.24, the pivot point at 29,594.67 and the 50-day at 29,565.96 sit within 57.28 points of one another and together form the primary support band this outlook builds its setup around.
2.5 Oscillator and Trend Readings
A neutral reading after a 1.66 percent advance means the move started from a neutral base rather than from oversold conditions.
The directional system has not confirmed the move, and this is the principal caution. The 14-day average directional index reads 14.41, far beneath the 20 threshold that separates trend from noise, and negative direction at 21.67 still exceeds positive direction at 16.47. In plain terms, the trend system still classifies this market as directionless with a residual downward lean, and one session has not changed that. Historic volatility is low and stable at 12.72 percent on the 14-day.
The multi-indicator composite reads 16 percent sell at minimum strength and weakest direction, identical to gold's reading tonight and a long way from crude's 100 percent buy. A composite that weak after a 1.66 percent advance confirms that the longer-horizon components remain unconvinced.
2.6 Volatility and Expected Range
The 14-day average true range is 421.22 points, or 1.42 percent of the settlement, and the 14-day average daily range is 378.02 points or 1.27 percent.
A one average-true-range day from the 29,743.00 settlement spans 29,321.78 to 30,164.22. Thursday's actual range of 545.50 points exceeded the 14-day average by 124.28 points, so Thursday was a wide day by recent standards. For Friday the relevant adjustment is upward rather than downward: expiration sessions of this size routinely produce ranges above baseline, and the options positioning data's own implied move for the broad index on Friday is 13.8 percent annualised volatility, implying roughly 86 basis points of intraday movement.
4.1 Mag7 Earnings and AI Capex Cycle
The options positioning data recorded roughly three billion dollars of positive delta flow in single-stock names on the day, with more than half originating in the mega-capitalisation complex and driven by longer-dated call buying. The accompanying observation is that these companies carry strong fundamentals and balance sheets that could support them in a higher-rate environment, which is the coherent bull case for the sector one day after a hawkish decision.
The artificial-intelligence capital-expenditure story produced several discrete items. A leading accelerator designer committed two billion dollars to an infrastructure fund at 12:55 PM ET, a cloud data source was reported raising rental rates across four generations of that designer's accelerators at 9:37 AM ET, and the chief executives of a major model developer and that same accelerator designer were reported as attending a state dinner with China's president at 1:34 PM ET. Rising rental rates for compute are a direct demand signal, and they are a more reliable read on the capital-expenditure cycle than commentary.
4.2 Semiconductor Cycle and Tech Sector Rotation
Semiconductors led decisively, with the sector fund gaining 3.4 percent against the technology index fund's 1.7 percent, a two-to-one leadership ratio. Leadership of that magnitude from the most cyclical and highest-beta part of the complex is the signature of a genuine risk-on session rather than a defensive rotation into large-capitalisation technology.
Two items add texture. A semiconductor chief executive was reported attending the state dinner with China's president at 4:54 PM ET, and a Chinese manufacturer was reported testing its own accelerators in limited foreign markets at 3:12 AM ET. The first is a mild positive for market access, the second a longer-term competitive concern. Neither moved the session.
4.3 Fed Policy and Real Yields (Duration Sensitivity)
The Nasdaq-100 is the most duration-sensitive of the four instruments here, which makes Wednesday's decision the most important standing fact in this outlook. The Federal Reserve raised its target range 25 basis points to 3.75 to 4.00 percent unanimously, with twelve of eighteen officials projecting one further increase this year, four projecting two, two projecting none, and no cut projected for next year.
Thursday's ten-year inflation-protected auction at 1:00 PM ET cleared at a 2.653 percent high yield against 2.438 percent previously, a sharp increase in the real rate. That the index advanced 1.66 percent on a day when the long-dated real yield rose that much is the single most surprising relationship in tonight's data, and it is explained by the crude decline easing the expected inflation path rather than by anything in the rate structure itself. The ten-year nominal yield sat near 4.950, essentially unchanged on the day.
The news calendar carries Federal Reserve Governor Bowman at 9:30 AM ET Friday and Schmid at 11:45 AM ET; neither appears in the verified calendar, so both times are unconfirmed.
4.4 Geopolitical Backdrop
The geopolitical environment is active but is currently transmitting to equities only through the oil price. A Saudi pipeline remains largely out of service with repairs estimated at three to five weeks, a maritime security incident was reported in the Strait of Hormuz at 3:30 PM ET, and Israel's prime minister called at 3:51 PM ET for toppling the Iranian government. None of this prevented a 1.66 percent advance, because crude fell anyway.
The transmission channel is worth stating plainly, because it is the key risk for Friday: geopolitical escalation raises crude, higher crude raises the expected inflation path, a higher inflation path raises the expected policy rate, and a higher expected policy rate compresses the valuation of long-duration technology earnings. The index's exposure to the Middle East runs entirely through that chain, and it is therefore an overnight risk rather than an intraday one.
Separately, the news feed carries a state visit by China's president to the United States beginning September 24, a date absent from the verified calendar and therefore unconfirmed, with several technology chief executives reported as attending the associated state dinner. That is a positive market-access signal for the sector at the margin.
4.5 Cross-Asset and Volatility
The volatility complex reset hard. Down 12.81 percent on the day, the volatility index closed near 15.45, and its companion index of volatility-of-volatility closed at 88, down 8 percent. Fixed-strike volatility declined two to three points as the event premium around the rate decision was released. The options positioning data noted that the volatility index's percentage change on the day was more than five times the percentage change in the broad equity index, which is a reminder of how much of Thursday's move was volatility compression rather than directional conviction.
Cross-asset, the dollar index sat near 100.238 in evening trade after the 4:00 PM ET equity close, having held most of its post-decision gains, the ten-year yield near 4.950; crude's November contract settled at 97.23 after a 3.41 percent intraday washout and recovery. The consumer sentiment gauge read 29 out of 100 at 10:18 AM ET, in the fear band, which is a notable divergence from a session in which technology gained 1.7 percent.
4.6 Institutional Positioning
The positioning data for this index is the most distinctive in the complex, and it points in one direction. The index's gamma notional reads positive 6.28 million dollars, the only positive reading in a table where the broad index reads negative 610 million, its fund negative 1.894 billion, the technology fund negative 990 million, the small-capitalisation index negative 191 million and its fund negative 2.297 billion. The index's gamma tilt of 1.06 is likewise the only reading above 1.00 in the set.
Net positive dealer gamma is a stabilising configuration: it implies hedging flows that lean against price movement rather than amplifying it. On an expiration day of record size, that distinction is the difference between an orderly session and a disorderly one, and this index is currently the best-positioned of the group for an orderly one.
The 25-delta risk reversal reads negative 0.062, the most negative in the table, indicating puts still bid over calls in relative terms. December open interest in the futures contract stands at 238,052.
Options positioning context
Volume was 31,932,941 shares.
The fund's dealer gamma profile is the reverse of the index's. Call gamma reads negative 285 million against put gamma of negative 2.5 billion, with next-expiry gamma at 8.03 percent, a high figure that reflects tomorrow's expiration. Where the index itself carries slightly positive gamma, the fund carries substantially negative gamma, so hedging flows in the fund amplify movement while hedging flows in the index dampen it.
The fund's published levels are a modeled volatility threshold at 711, a primary gamma concentration at 700, a call-side hedging boundary at 720, a put-side boundary at 700 and a modeled gamma-flip level at 714, all computed against the 704 reference. The fund's close of 716.41 therefore sits above the volatility threshold and the gamma-flip level but beneath the call-side boundary at 720, which is the nearest overhead marker for Friday.
Both are excluded from level structure.
Index-level positioning, quoted in cash terms as the data publishes it and computed against Wednesday's 28,945 reference close: modeled volatility threshold 29,070, primary gamma concentration 29,000, call-side hedging boundary 29,275, put-side hedging boundary 29,000, modeled gamma-flip level 28,655. The index's cash close of 29,436.60 finished above the modeled volatility threshold, the primary gamma concentration, both hedging boundaries, the modeled gamma-flip level and three of the four key strikes; the 29,500 key strike sits 63.40 points above the close and was not cleared.
Night Session (6:00 PM ET Thursday to 3:00 AM ET Friday, Globex/Asia)
Mildly negative drift into a genuine monetary catalyst. The reopened session has held 29,674.50 to 29,728.50 and sits near 29,680. The news calendar carries Japanese inflation at 7:30 PM ET with headline expected at 2.0 percent and core at 1.8 percent, and the Bank of Japan decision at 11:30 PM ET on a tentative statement time with consensus expecting an increase to 1.25 percent from 1.00 percent; neither appears in the verified calendar, so both dates and clocks are unconfirmed. A Japanese hike is the most duration-relevant overnight event available: it lifts global term premium and firms the yen, and this index is the most duration-sensitive instrument in the package. Expected Globex range 29,560 to 29,830.
London Session (3:00 AM to 8:00 AM ET Friday)
European hours are typically quiet for this index and Friday's European data is second-tier: the news calendar carries UK retail sales and German producer prices at 2:00 AM ET ahead of the window and euro-area inflation expectations at 4:00 AM ET, none of which appears in the verified calendar, so the times are unconfirmed. The material risk in this window is positioning rather than data: European hours on an expiration Friday often carry early rolling activity in index products. The level to monitor is the 29,566 to 29,623 confluence. Expected range 29,580 to 29,800.
Morning Session (9:30 AM to 12:00 PM ET Friday, RTH Open)
The cash open at 9:30 AM ET sets the session's first directional test, and Friday's open carries more structural weight than usual because the September quarterly expiration, carried in the options positioning data rather than a verified calendar and unconfirmed, settles into it. Industrial production and capacity utilisation, the one Friday entry in the verified calendar, print at 9:15 AM ET, expected at 0.3 percent and 76.4 percent on the news-feed consensus. The news calendar carries Federal Reserve Governor Bowman at 9:30 AM ET, which would coincide with the open, and Schmid at 11:45 AM ET; neither appears in the verified calendar, so both times are unconfirmed. The level map is 29,758.16 as the decision line, 29,793.25 as the confirmation level above it, and the 29,566 to 29,623 band as support. Expiration-related flows can distort the first hour in either direction without conveying directional information.
Afternoon Session (12:00 PM to 4:00 PM ET Friday)
The afternoon belongs to the expiration. Per the options positioning data rather than a verified calendar, and unconfirmed against a primary source, roughly twenty percent of all listed US options expire or roll on Friday, and in delta-notional terms this September expiration is set to surpass June's record. Large institutional rolls and position closures concentrate between 2:00 PM ET and the 4:00 PM ET cash close, into which the expiring index open interest settles. This index carries slightly positive dealer gamma, which argues for a more orderly close than the rest of the complex, while the technology fund carries substantially negative gamma with next-expiry gamma at 8.03 percent, which argues the opposite for fund-level flow. The net effect is genuinely uncertain and position sizing should reflect that rather than a directional view.
Night Session Forward (Sunday 6:00 PM ET reopen)
The Sunday 6:00 PM ET reopen follows the expiration, and post-expiration reopens frequently move more freely than the sessions preceding them because the pinning effect of expiring open interest has been removed. Weekend exposure runs through crude and the Middle East on the chain described in section 4.4.
Expected Range (Friday Full Session)
Low-range scenario: 29,600 to 29,900
Mid-range scenario (most likely): 29,450 to 30,000
High-range scenario: 29,250 to 30,150
Most Likely Path
The most probable Friday path opens near 29,680, tests the 100-day average at 29,758.16 during the morning, and resolves the session on that test. Acceptance above it, followed by a clearance of Thursday's 29,793.25 high, opens the first pivot resistance at 29,941.58 and then the 30,109 to 30,140 band where the one-month high and the second pivot resistance converge. Rejection instead turns the session back toward the 29,566 to 29,623 confluence, which is where the primary setup activates. The lower-likelihood path, roughly one in five, is an expiration-driven dislocation that ignores the moving-average structure entirely and trades to whichever side the largest rolls push it, in which case the 29,049 to 29,053 band and the 30,109 to 30,140 band are the outer markers.
Friday Economic Calendar
Friday's calendar is light on data and heavy on structure, and the structure is what matters for this index.
The overnight block comes entirely from the news calendar, is absent from the verified calendar, and is therefore unconfirmed. It opens with Japanese inflation at 7:30 PM ET Thursday, headline expected at 2.0 percent against 1.9 percent prior and core at 1.8 percent, alongside remarks from Australia's central bank governor at the same hour. The Bank of Japan decision, carried at 11:30 PM ET with a tentative statement time, is expected on the feed's consensus to raise the rate to 1.25 percent from 1.00 percent. For a long-duration index a second major central bank tightening in the same week is the most relevant overnight input available, working through global term premium.
European hours bring UK retail sales, UK core retail sales and German producer prices at 2:00 AM ET, and euro-area inflation expectations at 4:00 AM ET, all on the same unconfirmed news-feed basis. None is a direct input to this index.
The US session brings industrial production and capacity utilisation at 9:15 AM ET, the one Friday entry in the verified calendar, expected at 0.3 percent and 76.4 percent respectively on the news-feed consensus, then, on the news calendar only and unconfirmed against a primary source, Federal Reserve Governor Bowman at 9:30 AM ET and Schmid at 11:45 AM ET. Those two would be the first official comments since Wednesday's increase and they are the identifiable scheduled risk of the session for a duration-sensitive index.
The single first-order event for this index on Friday is not on the verified calendar at all. It is the September quarterly expiration, carried in the options positioning data and unconfirmed, in which roughly twenty percent of total US options expire or roll and whose delta-notional total is set to exceed June's record. Everything else on the slate is secondary to it.
Beyond Friday, the verified calendar carries several US releases on September 24 and durable goods orders on September 25. The news calendar adds global flash purchasing-manager surveys and a five-year note auction on September 23, the Chinese state visit beginning September 24, the next rate decision on October 28 and the midterm elections on November 3; none of those appears in the verified calendar, which covers through October 21, so they are unconfirmed.
Primary Trade Setup
Direction: Long
Rationale: Thursday's bar settled 90.8 percent up its range with the low just 23.25 points beneath the open, the index cleared its entire dealer-positioning structure, and it carries the only positive dealer gamma in the complex into an expiration. The 20-day average, the pivot point at 29,594.67 and the 50-day average converge inside 57.28 points, which is an unusually well-defined support band to work against.
Entry Zone: 29,566 to 29,623
Stop Loss: 29,470, beneath the 5-day average at 29,480.05
Target 1 (T1): 29,758 (the 100-day moving average at 29,758.16)
Target 2 (T2): 29,941 (the first pivot resistance at 29,941.58)
Target 3 (T3, extended): 30,109 (the 1-month high at 30,109.25, only on momentum extension through T2)
Risk-to-Reward: Approximately 1:1.3 to T1, 1:2.8 to T2, 1:4.1 to T3 from the midpoint of the entry zone. Filled at the top of the zone the ratio to T1 falls to 0.88, so an entry near 29,623 does not clear one unit of risk on the first objective
Invalidation: A decisive break beneath 29,470 negates the thesis, because it would mean the three-way moving-average confluence failed on its first test after a trend day. The next mechanical support is the first pivot support at 29,396.08, and beneath that the 29,049 to 29,053 band where the second pivot support at 29,049.17 and the one-month low sit within 3.83 points.
Macro override: A hawkish turn from Bowman or Schmid, carried on the news calendar at 9:30 AM ET and 11:45 AM ET and unconfirmed against the verified calendar, that lifts the expected rate path would compress this index faster than any other in the package, given its duration sensitivity. A Bank of Japan increase, carried on the news calendar at 11:30 PM ET on a tentative statement time and unconfirmed against the verified calendar, that lifts global term premium sharply would do the same overnight. In the opposite direction, expiration flows on a record delta-notional day can carry price through the entry zone without a retest, in which case the setup simply does not activate rather than being invalidated.
Sources and methodology
This outlook is built from our session review of the December E-mini Nasdaq-100 contract, prepared after Thursday's close on September 17, 2026. Computed pivot levels come from Thursday's session high, low and settlement as read from the daily bar, which does not time the low or the high. Index positioning levels are quoted in cash terms as published and are never converted into futures prices; the measured futures premium is 306.40 points. Fund proxy concentrations are quoted in the fund's own price domain. Closing figures for the Nasdaq-100, the S&P 500, the volatility index and crude were checked against published closing data.
Scenario ranges are analyst judgment; they are not statistically derived and carry no calibration. Contract months are kept separate throughout. Scheduled items marked unconfirmed come from a news calendar and were not verified against a primary source.
Thursday’s outlook for this contract is here. Outlooks for ES, NQ, GC and CL are collected on the market outlook page, and our forward trading record is on the performance statement.



