
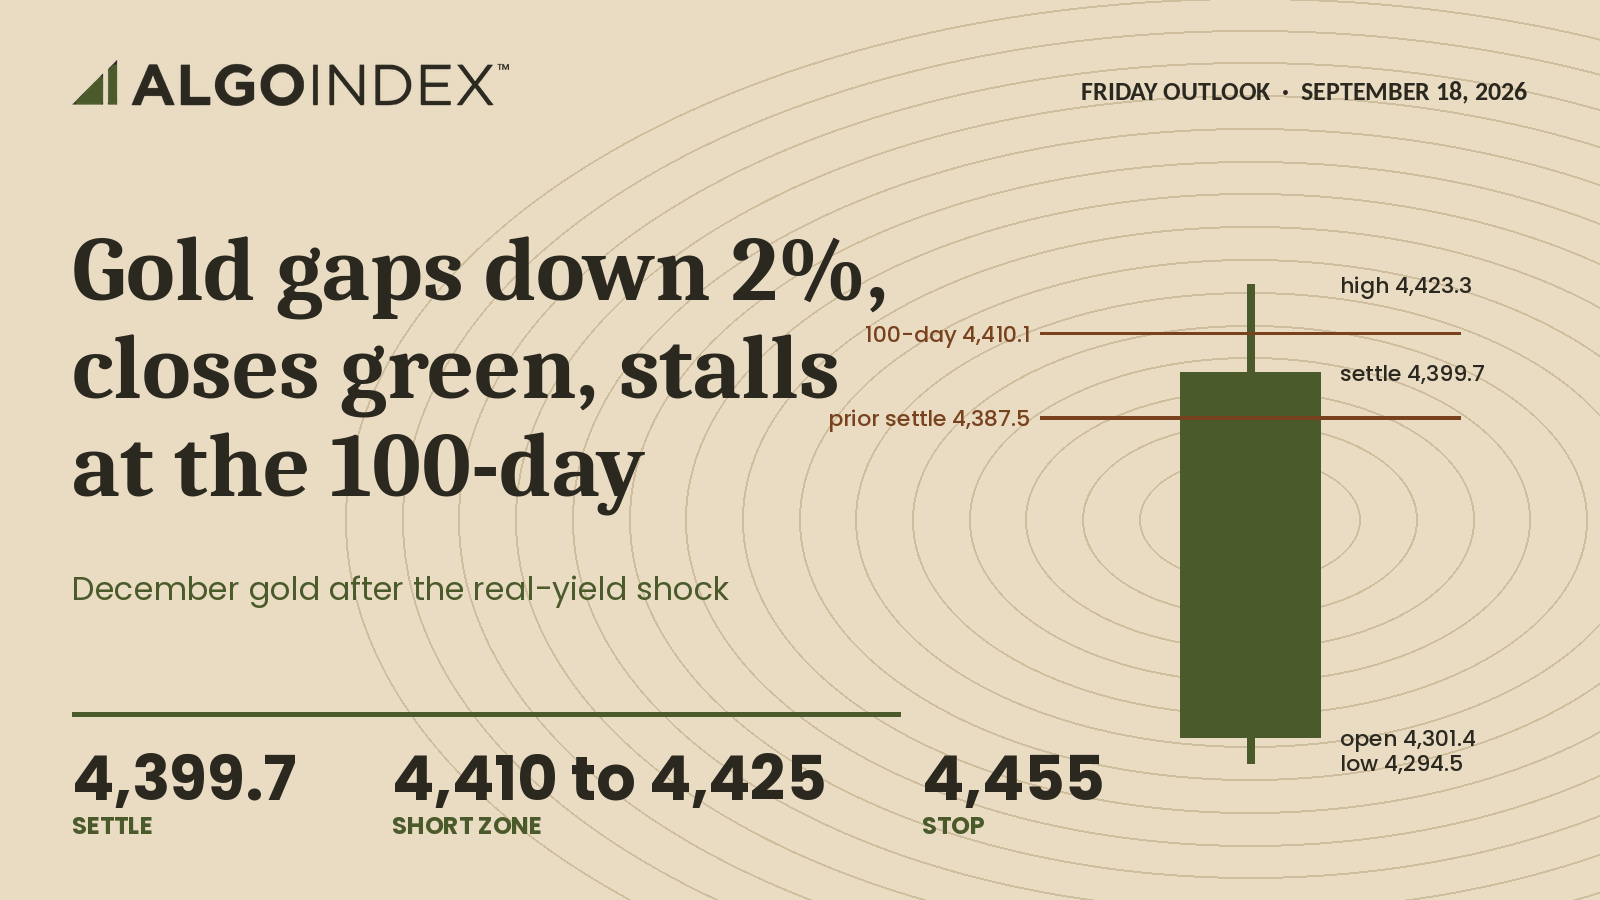
December gold opened Thursday at 4,301.4, already 86.1 points or 1.96 percent beneath the prior settlement of 4,387.5. The gap carried Wednesday's rate decision into the reopen. The session low printed at 4,294.5, 6.9 points beneath the open. The high reached 4,423.3, 3.00 percent above that low, closing the opening gap and trading 35.8 points above the prior settlement. The contract settled at 4,399.7, up 12.2 points or 0.28 percent. That is 81.7 percent of the way up a 128.8 point range.
The daily bar does not order the low and the high, so the recovery is read from the extremes and the settlement, not from a path. The bar establishes one thing. A market gapped down two percent on a hawkish central bank and closed higher. It also establishes where the recovery stopped: the high pierced the 100-day average at 4,410.1 by 13.2 points and the settlement finished 10.4 points beneath it. The evening session traded a narrow 4,380.5 to 4,388.5 on 2,065 contracts and sat near 4,382.
December gold settled at 4,399.7, up 0.28 percent, after an 86.1 point gap lower and a full recovery to 4,423.3. The 100-day average at 4,410.1 is the nearest resistance and the decision line; above it sit the session high, the first pivot resistance at 4,450.5 and the 20-day average at 4,490.0. Support is the 4,371 to 4,373 band where the pivot point and the 5-day average sit 1.4 points apart, then the 50-day at 4,342.0 and the session low at 4,294.5. The primary setup is a short from 4,410 to 4,425, stop 4,455, targets 4,372, 4,322 and 4,295, at half size.
Where Thursday's short went
Thursday's outlook set a short from 4,420 to 4,442 with a stop at 4,460 and a first target at 4,358. The session high of 4,423.3 reached the bottom of that zone. The stop held. Whether the 4,294.5 low came before or after any fill cannot be read from the daily bar, so we claim no result beyond those two facts. The settlement at 4,399.7 sits 20.3 points beneath the zone's lower edge.
The driver was real yields, and they moved against gold. Thursday's ten-year inflation-protected auction cleared at 1:00 PM ET with a high yield of 2.653 percent against 2.438 percent previously, a 21.5 basis point rise, with the bid-to-cover slipping to 2.240 from 2.300. That is a direct, measurable increase in the opportunity cost of holding a non-yielding asset. The dollar index sat near 100.238 in evening trade, down 0.10 percent but holding almost all of Wednesday's gains after a fresh one-and-a-half month high, while the euro broke lower as the two-year swap differential widened 15 basis points to its widest since July. A firm dollar and rising real yields together are the least favourable configuration gold can face. It settled higher anyway. That is the bull case in one sentence.
A broken uptrend at a neutral reading
Gold trades 23.90 percent beneath its 52-week high of 5,781.8 and 15.18 percent above its 52-week low of 3,819.9. The 13-week high and the one-month high are both 4,755.0. The one-month low is 4,273.3, which Thursday's 4,294.5 low approached within 21.2 points and held. Two lows in the same region inside a month are the raw material of a base. They are not yet a base, because a base needs a higher high as well, and 4,755.0 is far above.
The moving-average stack is tangled. The settlement sits above the 5-day average at 4,371.1 by 28.6 points and above the 50-day at 4,342.0 by 57.7 points. It sits below the 100-day at 4,410.1 by 10.4 points, below the 20-day at 4,490.0 by 90.3 points and below the 200-day at 4,648.4 by 248.7 points. The year-to-date average is 4,667.0. A stack in that order cannot be read directionally. What it identifies is the battleground: the 100-day at 4,410.1 is the nearest average in either direction, and Friday is likely to be decided within a few points of it.
The indicators agree on the absence of trend. The 14-day relative strength index is 46.50. The 14-day stochastic fast line reads 32.00 percent, in the lower portion of the range. The 14-day directional index is 16.66, beneath the 20 threshold, with positive direction at 15.98 against negative at 17.16, nearly equal. Historic volatility is 18.97 percent on the 14-day, low, and far beneath crude's 37.88. The composite reads 16 percent sell at minimum strength with its trend component on hold, a three-way tie with both equity contracts. The five-day change is negative 25.5 points, or 0.58 percent. This is a market that has finished falling and has not started rising.
The levels, top to bottom
Resistance begins at the 100-day average, 4,410.1, then the session high at 4,423.3, which is the upper edge of the short entry band. The first pivot resistance at 4,450.5 is the invalidation reference. The 20-day average at 4,490.0 and the second pivot resistance at 4,501.3 sit 11.3 points apart, a band more substantial than either level alone, and the third pivot resistance is 4,579.3. Beyond that only 4,755.0 matters, the lower high of the current swing.
Support starts at the prior settlement, 4,387.5, which the evening session traded beneath. The pivot point at 4,372.5 and the 5-day average at 4,371.1 converge inside 1.4 points, the first meaningful support and the first target. Then the 50-day at 4,342.0, the first pivot support at 4,321.7, the session low at 4,294.5 and the one-month low at 4,273.3. The second pivot support is 4,243.7 and the third 4,192.9.
The 14-day average true range is 105.2 points, 2.39 percent of the settlement, and the average daily range 104.4 points. A one-ATR day from the settlement spans 4,294.5 to 4,504.9, and the lower bound of that envelope is Thursday's low almost exactly. Thursday's range exceeded the average by 23.6 points. December open interest is 313,365 contracts, which after a 23.90 percent drawdown from the high is consistent with a market that has stabilised, although open interest alone cannot settle that question. The fund proxy is context only. It shows call gamma of negative 291 million against put gamma of positive 207 million, next-expiry gamma at 2.64 percent and volume of 14,945,073 shares, a mildly supportive configuration into an expiration. No fund figure becomes a futures level.
The trade map for Friday
The primary setup is a short from 4,410 to 4,425 on a retest of the band where Thursday's recovery stalled, with the stop at 4,455, above the first pivot resistance at 4,450.5. The first target is 4,372, where the pivot point and the 5-day average converge; the second is 4,322, the first pivot support; the third is 4,295, Thursday's session low, only on momentum through the second.
From the 4,417.5 midpoint the risk is 37.5 points. The first target returns 45.5 points, about 1.2 times that risk. The second returns 95.5 points, or 2.5 times, and the third 122.5 points, or 3.3 times. Filled at the bottom of the zone, the first target pays 38 points against 45 of risk, a ratio of 0.84, so an entry near 4,410 does not clear one unit of risk on the first objective. Half size. The reasons are a counter-trend entry, a tentatively timed overnight central bank decision, and equity expiration flows that move the dollar, and therefore gold, without conveying direction. Friday is, per the options positioning data rather than a verified calendar and unconfirmed, a quarterly equity index expiration of exceptional size. Gold settles at 1:30 PM ET, ahead of the equity close. The metal's session is decided before the largest flows print.
The overnight is the more consequential half. Japanese inflation at 7:30 PM ET, headline expected at 2.0 percent and core at 1.8 percent, and a Bank of Japan decision at 11:30 PM ET on a tentative statement time, expected to lift the rate to 1.25 percent from 1.00 percent, are carried on the news calendar and unconfirmed against a primary source. A Japanese increase lifts global real yields at the margin and firms the yen against the dollar. Those two effects push gold in opposite directions. In US hours, industrial production and capacity utilisation print at 9:15 AM ET, expected at 0.3 percent and 76.4 percent, the one verified Friday entry, and Federal Reserve commentary from Bowman at 9:30 AM ET and Schmid at 11:45 AM ET is carried on the news calendar only and unconfirmed. Hawkish commentary that lifts real yields is the clearest route to 4,294.5; softer commentary is the clearest route through 4,450.5.
Scenario ranges are analyst judgment. The low-range case runs 4,370 to 4,430, the most likely case 4,340 to 4,450 and the high-range case 4,290 to 4,510. The most likely path is simple. It opens near 4,382, tests the 4,371 to 4,373 confluence in European hours and holds it, then works back toward 4,410.1 into the 9:15 AM ET data. Rejection there, the base case given the composite reading and the real-rate direction, turns the session toward 4,372 and 4,321.7. Acceptance above 4,423.3 opens 4,450.5. Roughly one time in five, 4,372.5 fails in European hours and price reaches 4,321.7 without the upside test occurring at all. Then the weekend. Trade closes Friday at 5:00 PM ET and reopens Sunday at 6:00 PM ET, 49 hours of weekend exposure to an unresolved Middle East standoff that gold has ignored all year.
A two percent gap lower that closes green is either the end of the decline or the last comfortable short, and 4,410.1 decides which.
The complete data picture
Every number behind Friday’s plan, charted first, then the full level map, then the complete numeric reference underneath.
Full numeric reference, every remaining figure from the session review
Level notes
4,410.1 is the 100-day moving average and the nearest resistance of any kind, sitting just 10.4 points above the settlement. It was pierced intraday and not held on a settlement basis. This is the single most important level for Friday.
4,423.3 is the session high, 23.6 points above the settlement, and the upper edge of the primary entry band for the short setup.
4,450.5 is the first pivot resistance and the invalidation reference for the primary setup. A reclaim of this level would mean the reversal bar is extending rather than stalling.
4,490.0 is the 20-day moving average, 90.3 points above the settlement, and the first level whose recovery would materially change the structural read.
4,501.3 is the second pivot resistance, sitting almost on top of the 20-day average. The convergence of a pivot objective and a major average within 11.3 points makes this band more substantial than either level alone.
4,579.3 is the third pivot resistance, the extended mechanical objective, which would require more than one and a half average ranges in a session.
4,755.0 is both the 13-week high and the 1-month high, and it defines the lower high in the current swing sequence. It is not a Friday level, but it is the price that would have to break for gold's downtrend to be formally over.
4,387.5 is the prior settlement and the level the overnight session is currently trading beneath. It is minor but immediate.
4,372.5 is the pivot point, computed from Thursday's verified session bar, and it converges with the 5-day moving average at 4,371.1 to within 1.4 points. That convergence makes the 4,371 to 4,373 band the first meaningful support and the first target for the primary setup.
4,342.0 is the 50-day moving average, 57.7 points below the settlement.
4,321.7 is the first pivot support and the second target of the primary setup.
4,294.5 is Thursday's session low, the deepest support with direct evidence behind it, and the third target of the primary setup.
4,273.3 is the 1-month low, 21.2 points beneath Thursday's low. The pairing of these two levels is the base-building evidence described above, and a decisive break of both would end that argument.
4,243.7 is the second pivot support, the first mechanical objective beneath the one-month low.
4,192.9 is the third pivot support and the deepest level with mechanical basis for Friday.
2.1 Intraday and Session Review
The session's gap was set at the open. The December contract opened at 4,301.4 against a prior settlement of 4,387.5, a gap of 86.1 points or 1.96 percent lower, carrying the full weight of Wednesday's rate decision into the Globex reopen.
The settlement at 4,399.7 gave back a portion of that, finishing 23.6 points below the high and 105.2 points above the low, or 81.7 percent of the way up the range.
The close quality is constructive in isolation and ambiguous in context. A market that gaps down two percent on a hawkish central bank and closes green has absorbed the news. But the settlement finished 10.4 points beneath the 100-day average at 4,410.1, having pierced it intraday, which means the recovery reached resistance and stopped rather than breaking through.
The overnight session that opened at 6:00 PM ET has traded a narrow 4,380.5 to 4,388.5, the upper figure from the intraday chart against a 4,387.9 high on the published quote, and sits near 4,382, roughly 18 points below the Thursday settlement. Volume is thin at 2,065 contracts. The contract enters Friday having given back part of the recovery without threatening it.
2.2 Daily Structure
Gold's daily structure is a completed downtrend searching for a base. The 52-week high is 5,781.8 and the settlement at 4,399.7 sits 23.90 percent beneath it. The 52-week low is 3,819.9, with the settlement 15.18 percent above it. The 13-week high and the 1-month high are both 4,755.0, and the 1-month low is 4,273.3, which Thursday's session low of 4,294.5 approached without breaching.
That last relationship is the most important structural fact available. Thursday's low came within 21.2 points of the one-month low and held. The contract has now built two lows in the same region within a month, which is the raw material of a base. It is not yet a base, because a base requires a higher high as well, and 4,755.0 remains far above.
The five-day change is negative 25.5 points or 0.58 percent, so the week has been modestly lower despite Thursday's reversal.
2.3 4-Hour and Swing Structure
The swing sequence on the daily scale is lower-high and roughly equal-low. The lower high is 4,755.0 from within the last month; the roughly equal low is the pairing of the 4,273.3 one-month low with Thursday's 4,294.5. A structure of that shape resolves either into a double-bottom reversal or into a final break of support, and nothing in Thursday's session settles which.
The daily candle Thursday is a large bullish reversal bar: a 128.8 point range, an open near the low, a settlement near the high, a 98.3 point body, a 6.9 point lower shadow beneath the open and a 23.6 point upper shadow above the settlement, so the settlement finished 105.2 points off the low. Bars of that shape carry weight when they form at support, which this one did. The qualification is that the high at 4,423.3 pushed 13.2 points through the 100-day average at 4,410.1 without holding, and the settlement finished 10.4 points beneath that average.
2.4 Moving Averages
The stack is tangled, which is the clearest single evidence that gold has no trend at present. The settlement at 4,399.7 sits above the 5-day average at 4,371.1 by 28.6 points and above the 50-day at 4,342.0 by 57.7 points. It sits below the 100-day at 4,410.1 by 10.4 points, below the 20-day at 4,490.0 by 90.3 points, and below the 200-day at 4,648.4 by 248.7 points. The year-to-date average is 4,667.0.
An interleaved stack of that kind, with price above the shortest and the 50-day but below the 20-day, the 100-day and the 200-day, cannot be read directionally. What it does identify precisely is the battleground: the 100-day average at 4,410.1 sits just 10.4 points above the settlement, and it is the nearest average in either direction. Friday's session is likely to be decided within a few points of it.
2.5 Oscillator and Trend Readings
The directional system confirms the absence of trend rather than the presence of one. The 14-day average directional index is 16.66, well beneath the 20 threshold that distinguishes trend from noise, with positive direction 15.98 against negative direction 17.16 and the two nearly equal. Historic volatility is 18.97 percent on the 14-day, which is low, and materially lower than crude's 37.88 percent.
The multi-indicator composite reads 16 percent sell with strength classified as minimum and direction classified as weakest, and the composite trend component registers hold rather than a directional signal.
2.6 Volatility and Expected Range
The 14-day average true range is 105.2 points, equal to 2.39 percent of the settlement, and the 14-day average daily range is 104.4 points or 2.37 percent.
A one average-true-range day from the 4,399.7 settlement spans 4,294.5 to 4,504.9.
4.1 Dollar and Real Yields
This is the dominant driver and it is currently negative for gold. The ten-year inflation-protected auction on Thursday at 1:00 PM ET cleared at a 2.653 percent high yield against 2.438 percent at the previous auction, with the bid-to-cover slipping to 2.240 from 2.300. A 21.5 basis point rise in the real yield demanded at auction, alongside softer cover, is a direct and measurable increase in the opportunity cost of holding a non-yielding asset. Gold's opening gap lower, set at the reopen after Wednesday's decision and before this auction printed, is the mechanical expression of the same rate logic.
The dollar index sits near 100.238 in evening trade after the 4:00 PM ET equity close, down 0.102 or 0.10 percent on the day but holding almost all of the gains it took on Wednesday's decision, having set a fresh one-and-a-half month high earlier in the session before easing. The euro broke lower after the decision as the two-year swap differential widened 15 basis points to its widest since July. A firm dollar and rising real yields together constitute the least favourable macro configuration gold can face, and the fact that gold still settled higher is the bull case in a single sentence.
4.2 Fed and Monetary Policy
The Federal Reserve raised its target range 25 basis points to 3.75 to 4.00 percent on Wednesday, the first increase since July 2023, unanimously and with no dissents. The projection set was more hawkish than the decision: twelve of eighteen officials expect one further increase this year, four expect two, two expect none, and the projections show no cut next year. A sixteen-to-two majority projected at least one more increase in 2026.
For gold this is straightforwardly negative in the conventional framework, and Thursday's gap lower confirms the market applied that framework first. The counter-argument, which the recovery embodies, is that a central bank hiking into a geopolitically unstable environment with crude near multi-year highs raises the odds of a policy error, and policy-error risk is historically gold-supportive. Both readings are live.
4.3 Geopolitical Backdrop
The geopolitical environment is unusually charged and gold is not currently responding to it, which is itself the observation. A Saudi pipeline remains largely out of service with repairs estimated at three to five weeks, a maritime security incident was reported in the Strait of Hormuz at 3:30 PM ET, Israel's prime minister used a campaign launch at 3:51 PM ET to call for toppling the Iranian government, and the US sanctioned a cryptocurrency exchange at 1:30 PM ET for enabling the Iranian government. Against this, gold has fallen 23.90 percent from its 52-week high.
The interpretation that fits the evidence is that gold's 2026 decline has been a real-rate story rather than a risk story, and that the safe-haven bid has been comprehensively overwhelmed by the opportunity cost of holding it. That relationship would invert quickly if an escalation were severe enough to change the rate path rather than merely the risk premium, which is the specific scenario that would produce an upside gap.
4.4 China and Structural Demand (Central Bank Buying, PBOC, ETF Flows)
The news calendar carries the People's Bank of China one-year and five-year reference-rate settings on September 19 at 9:00 PM ET, currently 3.00 percent and 3.50 percent, and a state visit by China's president to the United States beginning September 24; neither appears in the verified calendar, so both dates are unconfirmed. Neither is a direct gold input, though the state visit has the potential to shift the broader risk environment.
4.5 Energy and Cross-Asset
The cross-asset picture on Thursday was dominated by crude, and gold was a follower rather than a leader. Crude's November contract settled at 97.23 after a 3.41 percent intraday washout and recovery, and the decline in oil eased the inflation path enough to drive a simultaneous rally in equities and bonds. The broad equity index closed at 7,635.65 for a 1.11 percent gain, the technology index at 29,436.60 for 1.70 percent, and, having fallen 12.81 percent on the day, the volatility index closed near 15.45.
The notable relationship is that gold and crude share the same daily-bar shape: both printed lows well beneath the prior settlement and both settled in the upper fifth of their ranges. Gold finished 81.7 percent up its range and crude 83.4 percent up its own. That correlation on the day suggests a common cause, most plausibly a broad unwinding of the risk premium followed by a broad re-establishment of it later in the session, a sequence the daily bars are consistent with but do not prove.
4.6 Institutional Positioning (COT, ETF Holdings, Speculator Length)
What is available is open interest of 313,365 contracts on the December contract. Open interest holding at that level after the 23.90 percent drawdown from the high is consistent with a market that fell hard and has since stabilised rather than one in active liquidation, although open interest alone cannot settle that question.
Options positioning context
The fund tracks bullion at roughly a one-to-eleven ratio with a management-fee drag and no clean basis to the futures contract, so no level in this outlook is translated from the fund into a futures price, and no fund-derived number appears in the published post.
The 52-week range is 333.81 to 509.70. Net negative call gamma against net positive put gamma describes a dealer book with more exposure to upside acceleration than to downside acceleration, which is a mildly supportive configuration into an expiration.
First, the high and low volatility point labels are inverted, showing a high point of 408 beneath a low point of 440; both are excluded from level structure.
Night Session (6:00 PM ET Thursday to 3:00 AM ET Friday, Globex/Asia)
Neutral to mildly negative with a monetary catalyst that is unusually relevant to gold. The reopened session has held 4,380.5 to 4,388.5 on thin volume. The news calendar carries Japanese inflation at 7:30 PM ET with headline expected at 2.0 percent and core at 1.8 percent, and the Bank of Japan decision at 11:30 PM ET on a tentative statement time with a hike to 1.25 percent from 1.00 percent expected; neither appears in the verified calendar, so both dates and clocks are unconfirmed. A Japanese hike matters more to gold than it appears: it lifts global real yields at the margin and firms the yen against the dollar, and those two effects push gold in opposite directions. Expected Globex range 4,355 to 4,415.
London Session (3:00 AM to 8:00 AM ET Friday)
Typically the session with the heaviest physical gold flow and the one most sensitive to dollar direction. Scheduled European data is second-tier: the news calendar carries UK retail sales and German producer prices at 2:00 AM ET just ahead of the window and euro-area inflation expectations at 4:00 AM ET, none of which appears in the verified calendar, so the times are unconfirmed; the last of the three has some relevance through the real-rate channel. The level to monitor through this window is the 4,371 to 4,373 band where the pivot point and the 5-day average converge. Expected range 4,360 to 4,420.
Morning Session (8:20 AM to 12:00 PM ET Friday, COMEX Open)
Industrial production and capacity utilisation, the one Friday entry in the verified calendar, print at 9:15 AM ET, expected at 0.3 percent and 76.4 percent on the news-feed consensus. The news calendar carries Federal Reserve Governor Bowman at 9:30 AM ET and Schmid at 11:45 AM ET, neither of which appears in the verified calendar, so both times are unconfirmed. Hawkish commentary that lifts real yields further is the clearest route to a retest of 4,294.5; commentary that softens the projected path is the clearest route through 4,450.5. The level map is 4,410.1 as the decision line, 4,423.3 as the supply edge, and 4,372.5 as the first support.
Afternoon Session (12:00 PM to 1:30 PM ET Friday, COMEX Settlement)
Friday is, per the options positioning data rather than a verified calendar and unconfirmed, a quarterly equity index expiration of exceptional size, with roughly twenty percent of all listed US options expiring or rolling and a delta-notional total set to exceed June's record. Gold settles at 1:30 PM ET, ahead of the equity close, so the metal's session is decided before the largest expiration flows print. Gold has no direct role in that expiration, but the associated positioning flows move the dollar, and the dollar moves gold. Afternoon direction in the metal is therefore more likely to be imported from the currency market than generated domestically. A standing weekly positioning report carries a customary 3:30 PM ET Friday timing, unconfirmed for this week and absent from the verified calendar, which would fall after the 1:30 PM ET gold settlement but ahead of the 4:00 PM ET equity close.
Night Session Forward (Sunday 6:00 PM ET reopen)
Trade closes Friday at 5:00 PM ET and reopens Sunday at 6:00 PM ET, carrying roughly 49 hours of weekend exposure to an unresolved Middle East situation. Gold's response function to geopolitical developments has been weak all year, so the asymmetry is smaller than crude's, but it is not zero: an escalation severe enough to alter the expected rate path rather than merely the risk premium would gap the metal higher.
Expected Range (Friday Full Session)
Low-range scenario: 4,370 to 4,430
Mid-range scenario (most likely): 4,340 to 4,450
High-range scenario: 4,290 to 4,510
Most Likely Path
The most probable Friday path opens near 4,382, tests the 4,371 to 4,373 confluence of the pivot point and the 5-day average during European hours, and holds it. From there the session works back toward the 4,410.1 hundred-day average into the 9:15 AM ET data, and the outcome of that test defines the day. Rejection there, which is the base case given the composite reading and the real-rate direction, turns the session down toward 4,372 and then 4,321.7. Acceptance above 4,423.3 instead opens 4,450.5 and puts the reversal-continuation case back in play. The lower-probability path, roughly one in five, is a direct failure of 4,372.5 in European hours that carries to 4,321.7 without the upside test occurring at all.
Friday Economic Calendar
The verified calendar carries one Friday entry, industrial production and capacity utilisation, and no gold-specific entry; the news calendar adds two monetary appearances that matter through the real-rate channel and are unconfirmed against a primary source.
The overnight block is the more consequential of the two halves, and every item in it comes from the news calendar, is absent from the verified calendar, and is therefore unconfirmed. Japanese inflation is carried at 7:30 PM ET Thursday, with headline expected at 2.0 percent against 1.9 percent prior and core at 1.8 percent, and Australia's central bank governor is carried at the same hour. The Bank of Japan decision, carried at 11:30 PM ET on a tentative statement time, is expected on the feed's consensus to raise the rate to 1.25 percent from 1.00 percent. A second major central bank tightening in the same week reinforces the global real-rate direction that has driven gold's decline, and it is the single most relevant scheduled item for the metal.
European hours bring UK retail sales and German producer prices at 2:00 AM ET, followed by euro-area inflation expectations at 4:00 AM ET, all three on the same unconfirmed news-feed basis, the last of which carries modest relevance through inflation-adjusted yields.
The US session brings industrial production and capacity utilisation at 9:15 AM ET, the one Friday entry in the verified calendar, expected at 0.3 percent and 76.4 percent respectively on the news-feed consensus, then, on the news calendar only and unconfirmed against a primary source, Federal Reserve Governor Bowman at 9:30 AM ET and Schmid at 11:45 AM ET. Those two would be the first official comments since Wednesday's increase and they are the identifiable first-order event for gold on Friday, because the metal's direction is currently a real-yield function and those two speakers are the nearest available input to the expected path.
The structural event of the day belongs to equities rather than metals: the September quarterly expiration, carried in the options positioning data rather than a verified calendar and unconfirmed, with roughly twenty percent of total US options expiring or rolling. Gold's exposure to it is indirect, running through the dollar.
Beyond Friday, the verified calendar carries the weekly petroleum status report on Wednesday, September 23, several US releases on September 24 and durable goods on September 25. The news calendar adds global flash purchasing-manager surveys and a five-year note auction on September 23, the Chinese state visit beginning September 24 and the next rate decision on October 28; none of those four appears in the verified calendar, which covers through October 21, so they are unconfirmed.
Primary Trade Setup
Direction: Short
Rationale: Thursday's recovery stalled at the 100-day average and the session high without settling above either, while the real-rate direction moved decisively against the metal at Thursday's inflation-protected auction and the multi-indicator composite reads 16 percent sell. The counter-trend bounce runs into the 100-day average, the session high and the first pivot resistance at 4,450.5, all inside a 40 point span, which is a dense supply band to absorb.
Entry Zone: 4,410 to 4,425
Stop Loss: 4,455, above the first pivot resistance at 4,450.5
Target 1 (T1): 4,372 (the pivot point at 4,372.5 converging with the 5-day average at 4,371.1)
Target 2 (T2): 4,322 (the first pivot support at 4,321.7)
Target 3 (T3, extended): 4,295 (Thursday's session low at 4,294.5, only on momentum extension through T2)
Risk-to-Reward: Approximately 1:1.2 to T1, 1:2.5 to T2, 1:3.3 to T3 from the midpoint of the entry zone. Filled at the bottom of the zone the ratio to T1 falls to 0.84, so an entry near 4,410 does not clear one unit of risk on the first objective
Sizing: Half the normal allocation. Counter-trend entry, tentatively timed overnight central bank decision, and expiration-driven dollar flows that can move gold without conveying direction.
Invalidation: A decisive settlement above 4,450.5 negates the thesis. That would mean the Thursday reversal bar is extending rather than stalling, and it would put the 20-day average at 4,490.0 and the second pivot resistance at 4,501.3 in play as the next objectives.
Macro override: Dovish commentary from Bowman or Schmid, carried on the news calendar at 9:30 AM ET and 11:45 AM ET and unconfirmed against the verified calendar, that softens the projected rate path would lift gold through the entry zone before the setup could work, as would a Middle East escalation severe enough to change the expected policy path rather than merely the risk premium. In the opposite direction, a Bank of Japan hike, carried on the news calendar at 11:30 PM ET on a tentative statement time and unconfirmed against the verified calendar, that lifts global real yields further, or hawkish Federal Reserve commentary, would carry the metal toward the targets faster than the entry zone could be reached on a retest.
Sources and methodology
This outlook is built from our session review of the December COMEX gold contract, prepared after Thursday's close on September 17, 2026. Computed pivot levels come from Thursday's session high, low and settlement as read from the daily bar, which does not order the low and the high within the session. Gold settles at 1:30 PM ET, ahead of the equity close. The gold fund proxy is used as qualitative context only and is never converted into futures prices. Indicator readings are limited to the values preserved for this session: the moving averages, the 14-day true range and daily range, the 14-day directional index, 14-day historic volatility, the 14-day relative strength value, the 14-day stochastic percent K and the composite reading.
Scenario ranges are analyst judgment; they are not statistically derived and carry no calibration. Contract months are kept separate throughout. Scheduled items marked unconfirmed come from a news calendar and were not verified against a primary source.
Thursday’s outlook for this contract is here. Outlooks for ES, NQ, GC and CL are collected on the market outlook page, and our forward trading record is on the performance statement.



