
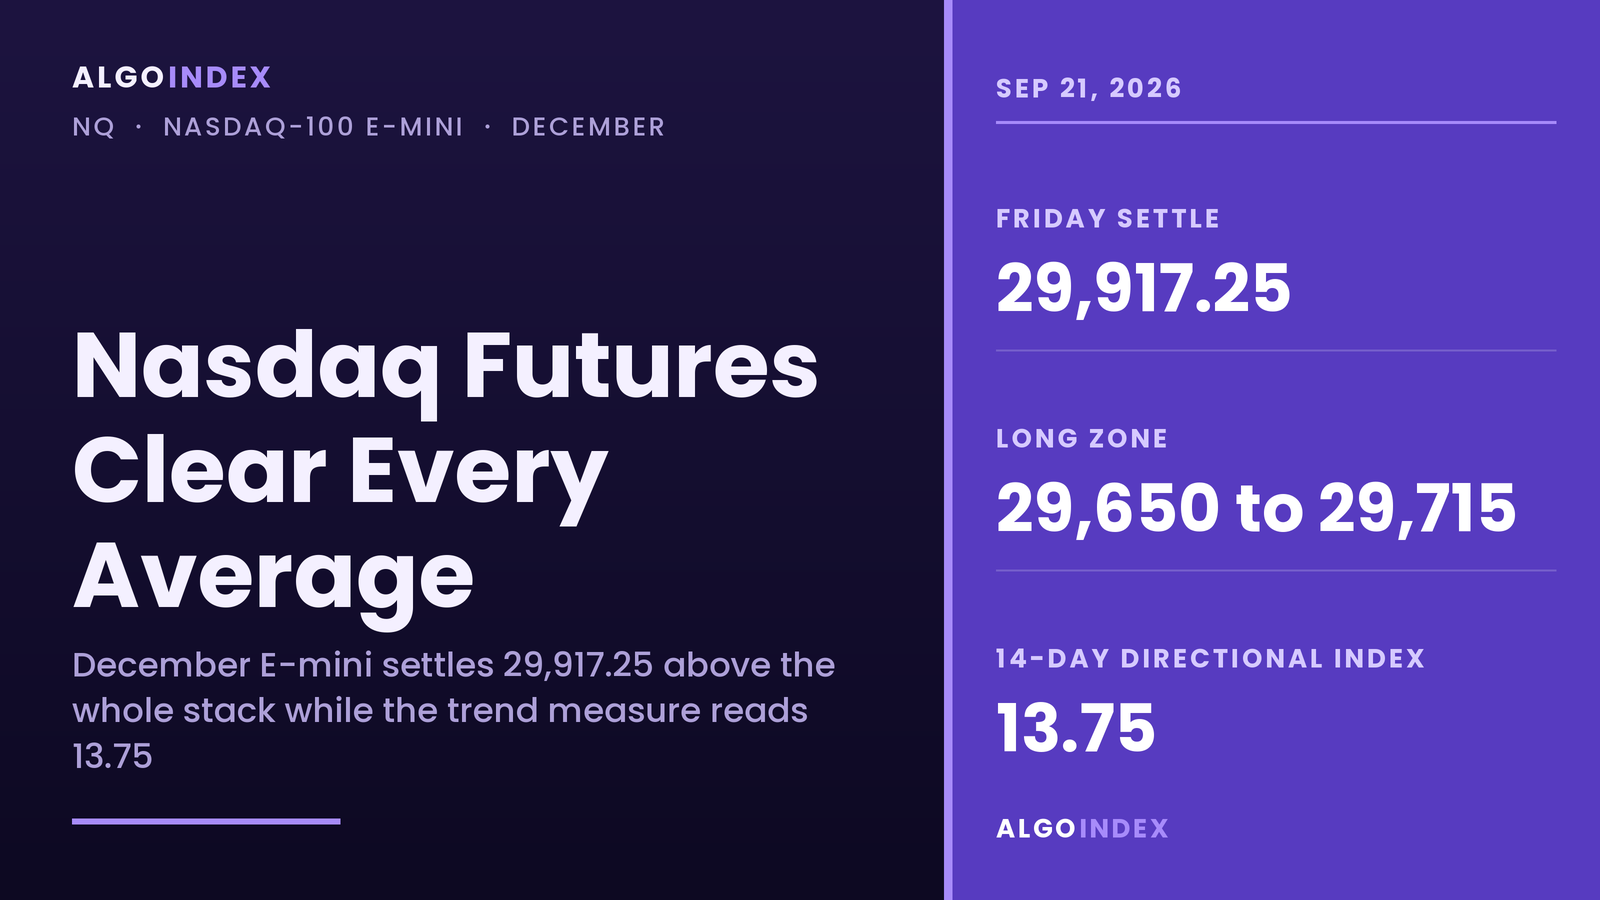
On the open Friday, December Nasdaq-100 futures printed 29,723.75, 19.25 points beneath Thursday's 29,743.00 settlement. The contract sank to 29,648.00, turned, and advanced 193.50 from its own open to settle at 29,917.25, up 174.25 or 0.59 percent. The high printed at 29,993.25. The close landed 78.0 percent of the way up a 345.25 point range measured from the low, 269.25 above that low and 76.00 beneath the high. Volume printed 495,894 contracts against open interest of 252,220.
Semiconductors did the lifting. Per the desk note captured at 5:14 PM ET, the sector fund gained 3 percent, MU rose 4 percent, SNDK 11 percent, AMD 3 percent and AVGO 3 percent, several extending the prior session's momentum, and the Nasdaq-100 cash index closed up 0.67 percent against 0.17 percent for the broad index and a 0.18 percent decline in the industrial average. This was the strongest of the four contracts we cover. The settlement sits above every moving average in the stack, from the 5-day at 29,522.65 to the 200-day at 27,858.27, and 64.42 above its own pivot point at 29,852.83. Monday's first question is whether a market that has cleared every average can produce a trend reading, because the 14-day directional index still says 13.75.
December Nasdaq-100 futures settled at 29,917.25, up 0.59 percent, the strongest advance of the four contracts we cover. It sits above every moving average and 64.42 above the pivot point at 29,852.83. It was a quarterly expiration session (per the positioning note captured for this run, unconfirmed against the verified forward calendar) and the cash index finished above its published call-side hedging boundary at 29,450. Overhead is tight. Resistance starts at Friday's 29,993.25 high, then the first pivot resistance at 30,057.67, the computed target price at 30,096.03 and the one-month high at 30,109.25. Support begins at the pivot point, with the 13-week retracement at 29,837.51 beneath it, then Thursday's 29,743.00 close and the first pivot support at 29,712.42, and a three-value confluence at 29,650.57, 29,649.25 and 29,648.00 inside 2.57 points beneath that. Beneath is denser. The primary setup is a long from 29,650 to 29,715, stop 29,570, targets 29,850, 29,993 and 30,096, into a Monday with no United States data on the captured calendar.
The long that never filled
Thursday's outlook set a long from 29,566 to 29,623 with a stop at 29,470 and targets at 29,758, 29,941 and 30,109. Friday's low printed at 29,648.00. That is above the top of the zone, so the entry never filled and the stop was never in play. The high at 29,993.25 then ran through the first target at 29,758 and the second at 29,941 and stopped short of the third at 30,109.25. We record that as a setup that did not activate. Direction right, entry too deep, no fill. The daily bar does not order its low and its high, and this run captured the completed bar and the published level ladder with no time-stamped intraday series, so nothing here asserts the sequence inside the session. For the scoring it does not matter. No print reached the zone.
Rotation carried the index. Per the desk note captured at 5:14 PM ET the correlation index fell 15 percent to a reading of 9, an unusually low value, and a reading that low means single names are moving on their own fundamentals with index beta a secondary force. Against that, the captured market wrap headline described ten-year Treasury yields rising during the session, with no level or quote time captured, and the Federal Reserve projections published at 2:00 PM ET on Wednesday, September 16 show twelve of eighteen officials expecting one further 25 basis point increase this year, four expecting two and two expecting none; the rate decision itself was not captured in this run. A technology index closed up 0.67 percent on a day the long end was described as rising. That is a divergence. It says the bid is running on the earnings and capital-expenditure narrative, and the vulnerability is symmetrical: if the narrative pauses, there is no rates support underneath.
Every average beneath price, and still no trend
Start with the stack. The 5-day average sits at 29,522.65, the 20-day at 29,633.89, the 50-day at 29,570.21, the 100-day at 29,760.29, the 200-day at 27,858.27 and the year-to-date average at 28,022.73. The settlement is 394.60 above the 5-day, 283.36 above the 20-day, 347.04 above the 50-day, 156.96 above the 100-day, 2,058.98 above the 200-day and 1,894.52 above the year-to-date average. Nothing sits overhead. The four short averages span 29,522.65 to 29,760.29, a 237.64 point band that is well under one 14-day average true range of 442.54. Price is above the band. A snapshot of current averages does not say how long price spent inside that band or when it left, so this outlook states only the present configuration. The 100-day sitting above the 20-day and the 50-day is the residue of an earlier decline, and it is why two crossover studies still register sell.
Now the counterweight. The 14-day directional index reads 13.75, well beneath the conventional 25 threshold, with a positive directional component of 18.90 against a negative of 20.62; other horizons were not captured in this run. The negative side still leads. The multi-indicator composite reads 40 percent buy at weak strength, with direction rated strengthening and the composite trend indicator on hold; short-term studies average 80 percent buy, medium-term 25 percent buy and long-term hold. The 20-to-100 day and 50-to-100 day crossovers register sell, seven studies register buy and three sub-studies hold, and the component-by-component table was not captured, so the individual studies are not named. Higher prices without a trend. A move above the averages from that condition is either the start of a trend or a failure, and the directional measure will not say which until after the fact.
Position in range argues for strength. The 9-day and 14-day raw stochastic both read 85.72 percent, the top sixth of both windows; readings on the 20-day, 50-day and 100-day horizons were not captured. The 9-day percent K at 58.12 sits above its percent D of 38.71 and the 14-day percent K at 56.78 above its percent D of 37.37, with no earlier values captured, so this outlook states that K exceeds D and does not assert when a crossing occurred. Both fast lines lead. The 14-day relative strength reads 54.63, up 2.70 on the session, against the neutral 50 midpoint; other horizons were not captured, nor was the price level for a 70 reading. The settlement sits 4.68 percent beneath the 52-week high of 31,385.50 and 27.69 percent above the 52-week low of 23,429.00. High in the range. The one-month high is 30,109.25, only 192.00 above the settlement, and the one-month low 29,053.00, 864.25 beneath it. That puts price roughly 82 percent of the way up the one-month range, in its upper quarter, and roughly 64 percent of the way up the 13-week range between 27,482.00 and 31,293.50. Period performance mostly agrees. It reads up 0.78 percent over five sessions, up 1.11 percent over twenty, down 1.06 percent over fifty, up 7.21 percent over one hundred and up 14.47 percent year to date; the 200-session change was not captured. The negative fifty-session figure inside an otherwise positive series matches the compressed averages. Historic volatility on the 14-day horizon reads 12.94 percent.
Overhead the map is tight. Friday's high at 29,993.25 is the first reference, 76.00 above the settlement. Then the first pivot resistance at 30,057.67, 140.42 above the settlement, the computed target price at 30,096.03, and the one-month high at 30,109.25, the level that decides whether this advance extends. Above that the second pivot resistance at 30,198.08 and the one standard deviation resistance at 30,215.76 pair inside 17.68 points, then the two standard deviation resistance at 30,339.41, the third pivot resistance at 30,402.92 and the three standard deviation resistance at 30,434.29, 31.37 above it. The 13-week high at 31,293.50 and the 52-week high at 31,385.50 finish the ladder.
Beneath price the first references are the pivot point at 29,852.83 and the 38.2 percent retracement from the 13-week high at 29,837.51, 15.32 beneath it, a two-value pairing. Then the 100-day average at 29,760.29 and Thursday's 29,743.00 close, the level the session gapped beneath and recovered. The first pivot support at 29,712.42 sits 6.66 above the 38.2 percent retracement from the four-week high at 29,705.76, and together they form the upper edge of the entry zone. Beneath the zone comes the tightest grouping in this outlook: the 14-day relative strength 50 threshold at 29,650.57, the 18-day moving average crossing at 29,649.25, 1.32 beneath it and 0.75 beneath the zone's 29,650 lower edge, and Friday's low at 29,648.00, 1.25 beneath the crossing and 2.00 beneath the edge. Three values inside 2.57 points. The 9-day and 40-day crossing levels were not captured in this run. Further down sit the one standard deviation support at 29,618.74, the 50 percent retracement of the four-week range at 29,581.13, the second pivot support at 29,507.58 paired with the two standard deviation support at 29,495.09 twelve and a half points beneath, the three standard deviation support at 29,400.21, the 50 percent retracement of the 13-week range at 29,387.75, the third pivot support at 29,367.17, 33.04 beneath that outer band, and the 38.2 percent retracement from the 13-week low at 28,937.99.
Six billion dollars of longer-dated calls
Flow was the story. Market commentary reported Nasdaq real-time hedging flow at plus 6 billion dollars of delta on the day, driven by longer-dated call buying, and noted a continuing divergence against the broad index, which registered minus 5 billion dollars of index delta dominated by same-day expiry flow. Six billion of longer-dated calls is duration-bearing positioning for upside; same-day expiry flow is gone by the close. The same commentary described technology names with call-skew percentiles above 90 while their implied-volatility ranks sit at or beneath 7. Upside calls are richly bid relative to downside puts, and options overall are priced near the cheapest levels of the past year. That combination is why traders have been expressing upside through calls.
The positioning levels are cash-domain and stay that way. Published against a reference price of 29,446, the prior session close, the primary gamma concentration strike sits at 29,500 and the call-side hedging boundary at 29,450, both listed strikes. The put-side support base sits at 28,500. The modeled gamma-flip level sits at 28,933 and the modeled volatility threshold at 29,240; neither is a listed strike, both are model outputs, and both move as positioning changes. The key strikes published for the cash index are 29,500, 29,450, 29,550 and 29,000. The cash close near 29,643, derived from the published 0.67 percent change on 29,446 and carrying that rounding, finished above both the call-side boundary and the gamma concentration strike. Trading above the call-side boundary is the configuration in which dealer hedging tends to stop dampening upside. The gamma tilt reads 1.505, a call-heavy profile, gamma notional positive at 22.337 million dollars, and the 25 delta risk reversal minus 0.048. The measured futures-to-cash basis is approximately 274 points, against 297 the prior session, and no positioning level is converted into a futures price here.
The fund proxy tells a rougher version of the same story. It closed at 722.06 against a previous close of 716.92, up 0.72 percent, on volume of 36,358,508 shares, with a 52-week high of 748.64 and a 52-week low of 555.60. Its published levels put the primary gamma concentration and the call-side hedging boundary both at 720, the put-side support base at 700, the modeled gamma flip at 715 and the modeled volatility threshold at 717; the key-strike list was not captured. It closed above 720. Gamma notional on the fund reads negative at minus 208.953 million dollars, call open interest 5.72 million against put open interest of 7.839 million, and next-expiry gamma accounts for 25.58 percent of the total; the fund's risk reversal was not captured. One field is excluded on purpose. The fund's two volatility-point fields rendered inverted, with the low volatility point at 900 above the high volatility point at 720, so both are treated as low confidence and sit outside the level structure.
Volatility kept compressing. Per the desk note captured at 5:14 PM ET the volatility index closed with a 14 handle, down 4 percent, its own volatility measure closed at 87, down 0.4 percent per the ES package's capture of the same note, and fixed-strike volatility dropped one to three points across the surface. Implied volatility for the broad index for Monday was quoted at 6.5 percent in the ES package's capture, implying an intraday range of roughly 41 basis points. A quiet expectation. The session was a quarterly options expiration (per the positioning note captured for this run, unconfirmed against the verified forward calendar), and expiration-day flow is mechanical; it carries no directional information. Session volume of 495,894 against open interest of 252,220 is a turnover ratio close to two to one. That is roll and expiration mechanics, and it argues for discounting the volume figure as a conviction signal. The weekly commitments data for the week ending September 15, covering the Nasdaq contract and the volatility index, was published at 4:21 PM ET, after the settlement. This run captured the existence of those releases and none of their component figures. No claim is made about speculator net length. Crude fell 1.18 percent on the November contract per the crude package's capture, and the captured sentiment summary carried the headline that technology led as oil eased. The dollar index and digital-asset moves were NOT CAPTURED IN THIS RUN.
The trade map for Monday
The primary setup is a long from 29,650 to 29,715, bidding a pullback into the band that holds the first pivot support at 29,712.42, the four-week 38.2 percent retracement at 29,705.76 and the relative strength 50 threshold at 29,650.57, with the 18-day crossing at 29,649.25 and Friday's low at 29,648.00 adjacent beneath the lower edge. The stop is 29,570, beneath the 50 percent retracement of the four-week range at 29,581.13 and the one standard deviation support at 29,618.74. The first target is 29,850, the pivot point at 29,852.83 with the 13-week retracement at 29,837.51 beneath it. The second is 29,993, Friday's high at 29,993.25. The third is 30,096, the computed target price at 30,096.03, with the first pivot resistance at 30,057.67 beneath and the one-month high at 30,109.25 above, reached only if momentum extends through the second on expanding volume.
From the 29,682.50 midpoint the risk is 112.50 points, approximately 1:1.5 to the first target, 1:2.8 to the second and 1:3.7 to the third, each rounded to one decimal. That is 25 percent of the 14-day average true range of 442.54. Tight by this contract's standards, and the weekend gap exposure adds to the mismatch between stop distance and volatility. The whole structure sits inside one average day of movement. A projection of one 14-day average true range from the settlement spans 29,474.71 to 30,359.79, and that band contains the entry zone and all three targets, so the trade requires no multi-day extension. Gap levels run both ways. An upside gap through 29,993.25 and toward 30,057.67 would put the one-month high at 30,109.25 directly in play; a downside gap beneath the pivot point at 29,852.83 would expose the 29,712.42 to 29,648.00 entry zone quickly. Two full days of headline exposure separate Friday's settlement from the first Monday print. For this index that exposure is concentrated in technology and trade-policy news. Asian hours are where any semiconductor supply-chain or export-control headline is priced first, and that is the most likely source of a gap in this contract. The Sunday reopen at 6:00 PM ET is likely to be thin through the first hours of Globex trade. The cash open at 9:30 AM ET Monday provides the session's first liquid directional test of the map.
Monday's slate has no United States economic data release on the calendar captured for this run, consistent with the weekly commentary published at 4:11 PM ET Friday describing the week ahead as a quiet calendar against fragile sentiment. That statement is scoped to what this run's capture shows; it makes no exhaustive claim about every possible release. The Chinese one-year and five-year loan prime rates will already have been published at 9:00 PM ET Saturday, with calendar forecasts of 3 percent and 3.5 percent against previous values of 3.00 percent and 3.50 percent, per the shared news-feed calendar capture in the CL and GC packages, unconfirmed against the verified forward calendar. The European Central Bank's Kazimir speaks at 4:30 AM ET, Goolsbee at 6:30 AM ET ahead of the cash open, the Bank of Canada's Macklem at 11:20 AM ET, and the Reserve Bank of Australia's Hunter at 3:00 PM ET and Bullock at 11:10 PM ET, all per the news-feed calendar captured for this run, unconfirmed against the verified forward calendar. Speakers only. Tuesday, September 22 is the first-order event. Williams speaks at 10:05 AM ET, Jefferson at 10:20 AM ET, Barkin at 1:00 PM ET, and a two-year note auction lands at 1:00 PM ET carrying a previous high yield of 4.204 percent and a previous bid-to-cover of 2.600, per the news-feed calendar captured for this run, unconfirmed against the verified forward calendar. For a long-duration index the front-end auction is the most direct scheduled risk of the week. A weak result that lifts the front end works against the duration in this contract. The next rate statement is October 28 at 2:00 PM ET, per the news-feed calendar captured for this run, unconfirmed against the verified forward calendar.
The scheduled geopolitical item with the most Nasdaq-specific weight is the Chinese state visit to the United States, carried as an all-day item for Thursday, September 24, per the news-feed calendar captured for this run, unconfirmed against the verified forward calendar. Reporting on its agenda, and the session's trade-policy, export-control and regulatory headlines, were NOT CAPTURED IN THIS RUN. The Middle East items from the crude package's shared source pass, the report at 7:58 AM ET on September 17 that China privately asked Iran to restrain Yemen's Houthis, and the two post-settlement reports of a Houthi statement on Saudi mediation at 3:23 PM ET and of an explosion heard in Jazan and Abha at 4:31 PM ET, reach this index only through crude and rates. As analyst judgment, with no captured reporting behind it, export controls on semiconductors remain the tail risk that matters most here, because they act directly on the revenue that drove Friday's leadership. No mega-cap earnings appear on the captured calendar inside the forecast window. The verified forward calendar lists Micron's fiscal fourth-quarter results after the close on Wednesday, September 30, with the call at 4:30 PM ET, as the nearest listed technology report, and corporate artificial-intelligence capital-expenditure disclosures during the session were NOT CAPTURED IN THIS RUN with their figures.
Scenario ranges are analyst judgment. The low-range case runs from the first pivot support at 29,712.42 to the first pivot resistance at 30,057.67, a width of 345.25, or 0.86 times the 14-day average daily range of 400.38. The most likely case runs from Friday's low at 29,648.00 to the first pivot resistance at 30,057.67, 409.67 wide, essentially one average daily range. That is the base case. The high-range case runs from the second pivot support at 29,507.58 to the second pivot resistance at 30,198.08, 690.50 wide or 1.72 times the average range. Friday's own 345.25 point range came in at 86 percent of that average, a slightly quieter than typical session. The most likely path opens Monday near Friday's settlement, holds the pivot point at 29,852.83 through Asian and European hours, and works the 29,993.25 to 30,057.67 band during the United States morning as the market tests whether the move above the average band extends. A pullback inside that path finds the first pivot support at 29,712.42 and, deeper, the three-value confluence at 29,650.57, 29,649.25 and 29,648.00. That is where the setup bids. The alternative path, which the flat directional index and the two long-horizon sell studies make real, fails at the session high, loses the pivot point and returns to the band spanned by the current averages between 29,522.65 and 29,760.29.
Every average now sits beneath the price, and the trend measure has yet to notice.
The complete data picture
Every number behind Monday’s plan, charted first, then the full level map, then the complete numeric reference underneath.
Full numeric reference, every remaining figure from the session review
Level notes
29,993.25 is Friday's session high, the highest print of the completed session, 76.00 above the settlement and the first captured reference overhead. It is the second Primary Setup target.
30,057.67 is Pivot R1, the first pivot resistance of Monday's ladder, 140.42 above the settlement.
30,096.03 is the computed target price published alongside Monday's ladder, sitting between the first pivot resistance and the one-month high, and the third Primary Setup target.
30,109.25 is the one-month high, the highest print of the past month, 192.00 above the settlement and the level that defines whether this advance extends.
30,198.08 is Pivot R2, the second pivot resistance of Monday's ladder.
30,215.76 is the 1 standard deviation resistance, the first standard deviation band, 17.68 above the second pivot resistance at 30,198.08, a tight overhead pairing.
30,339.41 is the 2 standard deviations resistance, the second standard deviation band.
30,402.92 is Pivot R3, the third and outermost pivot resistance.
30,434.29 is the 3 standard deviations resistance, the outer statistical band, 31.37 above the third pivot resistance at 30,402.92. Above the ladder sit the 13-week high at 31,293.50 and the 52-week high at 31,385.50.
29,852.83 is the Pivot Point, the mechanical midpoint of Monday's ladder, 64.42 beneath the settlement and the first reference beneath it. Holding above it keeps the constructive read intact. It is the first Primary Setup target.
29,837.51 is the 38.2 percent retracement from the 13-week high, sitting 15.32 beneath the pivot point of 29,852.83, a two-value pairing.
29,760.29 is the 100-day moving average, 156.96 beneath the settlement and the highest average in the stack.
29,743.00 is Thursday's previous close, the settlement the session gapped beneath at the open and then recovered.
29,712.42 is Pivot S1, the first pivot support of Monday's ladder, 6.66 above the four-week 38.2 percent retracement, the upper edge of the Primary Setup entry zone.
29,705.76 is the 38.2 percent retracement from the four-week high.
29,650.57 is the 14-day relative strength 50 threshold, the neutral momentum reference.
29,649.25 is the 18-day moving average crossing, sitting 1.32 beneath the relative strength 50 threshold and 1.25 above the session low, the tightest three-value confluence in this outlook, and 0.75 beneath the 29,650 lower edge of the Primary Setup entry zone, adjacent below it.
29,648.00 is Friday's session low, the lowest print of the completed session, 2.00 beneath the lower edge of the Primary Setup entry zone.
29,633.89 is the 20-day moving average, 283.36 beneath the settlement.
29,618.74 is the 1 standard deviation support, the intraday invalidation reference.
29,581.13 is the 50 percent retracement of the four-week range, the structural basis for the Primary Setup stop.
29,570.21 is the 50-day moving average and 29,522.65 the 5-day moving average, the lower edge of the 237.64 point band spanned by the current short averages.
29,507.58 is Pivot S2, paired with the 2 standard deviations support at 29,495.09 twelve and a half points beneath.
29,400.21 is the 3 standard deviations support and 29,387.75 the 50 percent retracement of the 13-week range.
29,367.17 is Pivot S3, the outermost pivot support, 33.04 beneath the third standard deviation support at 29,400.21. Further down sit the one-month low at 29,053.00, the 38.2 percent retracement from the 13-week low at 28,937.99, the year-to-date average at 28,022.73, the 200-day average at 27,858.27, the 13-week low at 27,482.00 and the 52-week low at 23,429.00.
1. Session summary
December Nasdaq futures settled at 29,917.25, up 174.25 on the session, a gain of 0.59 percent from Thursday's 29,743.00 close. The contract opened at 29,723.75, which is 19.25 beneath the prior settlement, traded down to 29,648.00, then advanced 193.50 from its own open to settle at 78.0 percent of the session range measured from the low of 29,648.00 and the high of 29,993.25. Volume printed 495,894 contracts against open interest of 252,220.
The contract-domain check passes cleanly and deserves an explicit note, because this is the instrument where the roll has caused trouble before. The chart series and the provider agree on all five fields for the December contract: open 29,723.75, high 29,993.25, low 29,648.00, close 29,917.25, change plus 174.25 or 0.59 percent. No continuous-series ambiguity exists tonight and every level in this outlook is computed from December.
This was the strongest of the four instruments this desk covers. Technology led a mostly higher equity session: the Nasdaq-100 cash index closed up 0.67 percent while the broad index gained 0.17 percent and the industrial average fell 0.18 percent. Semiconductors were the engine, with the sector exchange-traded fund up 3 percent and MU up 4 percent, SNDK up 11 percent, AMD up 3 percent and AVGO up 3 percent. The correlation index fell 15 percent to a reading of 9, which is the arithmetic of a dispersion market where single names move on their own fundamentals and index beta recedes. Against that, the captured market wrap headline described ten-year Treasury yields rising during the session (no level or quote time was captured), and the Federal Reserve projections published Wednesday show twelve of eighteen officials expecting one further 25 basis point increase this year, so this advance happened in spite of the rates backdrop.
The structural picture is the most constructive in the package. The settlement sits above every single moving average: 394.60 above the 5-day at 29,522.65, 283.36 above the 20-day at 29,633.89, 347.04 above the 50-day at 29,570.21, 156.96 above the 100-day at 29,760.29, 2,058.98 above the 200-day at 27,858.27 and 1,894.52 above the year-to-date average at 28,022.73. It also closed 64.42 above its own pivot point of 29,852.83. The 9-day and 14-day raw stochastic both read 85.72 percent, placing price in the top sixth of both ranges.
The contradiction, and it is real, is that none of this is a trend by the directional measure. The 14-day directional index reads 13.75, well beneath the conventional 25 threshold, and its negative directional component of 20.62 still exceeds its positive component of 18.90. The multi-indicator composite reads only 40 percent buy at weak strength, though its direction is rated strengthening, and two medium-and-long crossover studies still register sell. This is a market making higher prices without yet making a trend, 4.68 percent beneath its 52-week high of 31,385.50 and 192.00 beneath its one-month high of 30,109.25. The Primary Setup buys a pullback into the 29,715 to 29,650 entry zone, which holds the first pivot support and a Fibonacci retracement, with the 18-day average crossing and the session low adjacent beneath its lower edge.
2.1 Intraday and Session Review
The December contract opened at 29,723.75, gapping 19.25 beneath Thursday's 29,743.00 settlement, and extended to a session low of 29,648.00 before turning higher. The high of 29,993.25 and that low bracket a 345.25 point range, which is 1.154 percent of the settlement and beneath the 14-day average daily range of 400.38.
The settlement at 29,917.25 sits 269.25 above the session low and 76.00 beneath the session high, placing the close at 78.0 percent of the session range measured from the low. Combined with the 193.50 point advance from the open, that is an upper-quartile close on a day that opened beneath the prior settlement, the same reversal signature gold produced and a stronger one in point terms.
This run captured the completed daily bar and the published level ladder and no time-stamped intraday series, so the sequencing of the move within the session is not something this outlook asserts. What the completed bar supports is the open-to-settle relationship and the closing position in the range, both recorded above, and the relationship between the session and the headline flow: the semiconductor strength and the technology leadership were described in the desk commentary captured after the close at 5:14 PM ET, while the weekly commitments data for the week ending September 15 was published at 4:21 PM ET, after the close.
The settlement 64.42 above the pivot point of 29,852.83 carries into Monday as the mechanical fact that matters. Nasdaq enters the new week on the stronger side of its own computed midpoint, as does gold, while crude enters it on the weaker side.
2.2 Daily Structure
The settlement sits 4.68 percent beneath the 52-week high of 31,385.50 and 27.69 percent above the 52-week low of 23,429.00, both measured on the provider's basis from the high and the low respectively. That distribution is the inverse of gold's: Nasdaq is far closer to its yearly high than to its yearly low, and the pullback from the high has been shallow by the standards of this contract's range.
The intermediate markers place the settlement near the top of its recent range. The one-month high is 30,109.25, only 192.00 above the settlement, and the one-month low is 29,053.00, 864.25 beneath it. The 13-week high is 31,293.50 and the 13-week low 27,482.00. Price sits in the upper quarter of the one-month range and roughly 64 percent of the way up the 13-week range.
Position by horizon confirms it on the two captured readings. The 9-day and 14-day raw stochastic both read 85.72 percent, in line with each other; readings on the 20-day, 50-day and 100-day horizons were not captured in this run. A market pressing the upper part of its short lookback windows is a genuine strength signal and also the condition in which pullbacks start.
2.3 4-Hour and Swing Structure
The swing sequence is constructive. The most recent significant swing low is the one-month low at 29,053.00 and the most recent swing high is the one-month high at 30,109.25; the settlement at 29,917.25 sits 864.25 above that low and 192.00 beneath that high, roughly 82 percent of the way up the one-month range. Nothing in the retracement map has been threatened: the 38.2 percent retracement measured from the four-week high sits at 29,705.76 and the 50 percent retracement of the four-week range at 29,581.13, both beneath the settlement and both inside or beneath the Primary Setup entry zone.
The Fibonacci grid gives the deeper structure. The 38.2 percent retracement from the 13-week high sits at 29,837.51, just 15.32 beneath the pivot point of 29,852.83; the 50 percent retracement of the 13-week range at 29,387.75; the 38.2 percent retracement from the 13-week low at 28,937.99. The proximity of the 13-week 38.2 percent level at 29,837.51 to the pivot point at 29,852.83 is a useful pairing on any pullback.
The oscillator readings captured are the 9-day and 14-day stochastics. The 9-day percent K at 58.12 currently sits above its percent D of 38.71, and the 14-day percent K at 56.78 above its percent D of 37.37. Earlier K and D values were not captured, so this outlook states that K exceeds D on both captured horizons and does not assert when a crossing occurred; the 20-day and 50-day values were not captured. That is the same configuration gold shows on its captured horizons, from a higher base. The 14-day relative strength reads 54.63 compared with the neutral 50 midpoint, and rose 2.70 points on the session; other horizons of relative strength were not captured, nor was the price level for a 70 reading.
2.4 Moving Averages
The settlement is above every average in the stack, which is the single cleanest statement in this outlook. The 5-day sits at 29,522.65, the 20-day at 29,633.89, the 50-day at 29,570.21, the 100-day at 29,760.29, the 200-day at 27,858.27 and the year-to-date average at 28,022.73.
The current 5-day, 20-day, 50-day and 100-day averages span 29,522.65 to 29,760.29, a 237.64 point band that is well under one average true range, and the settlement is above that band. A snapshot of current averages does not establish how long price spent inside that band or when it left, so this outlook states only the present configuration. The 100-day at 29,760.29 sitting above the 20-day and 50-day is the residue of an earlier decline and is the reason two crossover studies still register sell.
Of the published crossing thresholds, the one captured is the 18-day average crossing at 29,649.25; the 9-day and 40-day crossing levels were not captured in this run. The 18-day crossing at 29,649.25 sits 1.25 points above the session low at 29,648.00 and 1.32 beneath the 14-day relative strength 50 threshold at 29,650.57, a three-value confluence inside 2.57 points that sits immediately beneath the Primary Setup entry zone, with the two lower values adjacent below the zone's 29,650 edge.
Period performance shows where the strength is concentrated: up 0.78 percent over five sessions, up 1.11 percent over twenty, down 1.06 percent over fifty, up 7.21 percent over one hundred and up 14.47 percent year to date; the 200-session change was not captured. The negative fifty-session figure inside an otherwise positive series is consistent with the compressed configuration of the averages.
2.5 Oscillator and Trend Readings
The directional index framework is the counterweight to everything above. The 14-day index reads 13.75 with a positive directional component of 18.90 against a negative of 20.62. Directional index readings on other horizons were not captured in this run.
The reading to take from that is specific: this market is not trending by the captured measure, and the directional tilt is still mildly negative even as price prints above every average. A move above the averages from such a condition is either the start of a trend or a failure, and the directional measure will not distinguish between them until after the fact.
Historic volatility on the 14-day horizon reads 12.94 percent; other horizons were not captured in this run.
The multi-indicator composite reads 40 percent buy with strength rated weak and direction rated strengthening, and the composite trend indicator registers hold. By horizon, short-term studies average 80 percent buy, medium-term 25 percent buy and long-term register hold. In detail as captured: the 20-to-100 day crossover and the 50-to-100 day crossover register sell, seven studies register buy and three sub-studies register hold; the component-by-component table was not captured in this run, so the individual buy and hold studies are not named. Three holds and two sells against seven buys. The two sells are both long-horizon crossovers that reflect the earlier decline and say nothing about current price.
2.6 Volatility and Expected Range
The 14-day average true range reads 442.54, or 1.48 percent of price; readings on other horizons were not captured in this run, so no statement is made about volatility contraction over the quarter.
The 14-day average daily range reads 400.38; other horizons were not captured. Friday's realised range of 345.25 came in at 86 percent of the 14-day average, so Friday was a slightly quieter than typical session.
A projection of one 14-day average true range of 442.54 from the settlement spans 29,474.71 to 30,359.79. That band contains the entire Primary Setup, both the entry zone and all three targets, which is the accurate way to describe the structure: this is a trade inside one average day of movement and it requires no multi-day extension.
4.1 Mag7 Earnings and AI Capex Cycle
No mega-cap earnings appear on the calendar captured for this run inside the forecast window. The verified forward calendar lists Micron's fiscal fourth-quarter results after the close on Wednesday, September 30, with the call at 4:30 PM ET, as the nearest listed technology report.
Corporate artificial-intelligence capital-expenditure disclosures during the session were NOT CAPTURED IN THIS RUN with their figures, so no revenue, spending, capacity or valuation numbers are stated here. The captured evidence of the theme is indirect: the semiconductor leadership recorded in section 4.2 and the longer-dated call buying recorded in the options positioning context.
The read for this index is unchanged in shape: the capital-expenditure cycle underwriting semiconductor demand is the single largest structural exposure in the Nasdaq-100, a story separate from rates, and the specific financing figures that would size that exposure are not in this run's capture.
4.2 Semiconductor Cycle and Tech Sector Rotation
Semiconductors were the session's leadership and the numbers are specific. The sector exchange-traded fund gained 3 percent, with MU up 4 percent, SNDK up 11 percent, AMD up 3 percent and AVGO up 3 percent, several extending the prior session's momentum.
Market commentary describing the options surface noted that technology names carry call-skew percentiles above 90 while their implied-volatility ranks sit at or beneath 7. In plain terms, upside calls are richly bid relative to downside puts, yet options overall are priced near the cheapest levels of the past year. That combination is why traders have been expressing upside through calls, and it is visible in the flow described in the options positioning context.
Rotation within the index was genuine and uneven. The correlation index fell 15 percent to a reading of 9, an unusually low value. A dispersion market rewards single-name selection and mutes index-level directional conviction, which is consistent with a strong cash index close alongside a directional index reading of 13.75.
4.3 Fed Policy and Real Yields (Duration Sensitivity)
This is the headwind, and for a long-duration index it is the most important macro input in this outlook. The Federal Reserve projections published at 2:00 PM ET on Wednesday, September 16 show twelve of eighteen officials expecting one further 25 basis point increase this year, four expecting two and two expecting none; the rate decision itself was not captured in this run and is not characterised here. The captured market wrap headline described ten-year Treasury yields rising during Friday's session; no yield level or quote time was captured in this run, so no level is stated here.
A technology index closing up 0.67 percent on a day the headline described the long end rising is a notable divergence, and it is the clearest evidence in this package that the current bid is driven by the earnings and capital-expenditure narrative, with discount rates working against it. The vulnerability is symmetrical: if the narrative pauses, there is no rates support underneath.
The forward policy calendar is speaker-heavy. Goolsbee speaks Monday at 6:30 AM ET; Tuesday brings Williams at 10:05 AM ET, Jefferson at 10:20 AM ET, Barkin at 1:00 PM ET and a two-year note auction at 1:00 PM ET with a previous high yield of 4.204 percent, per the news-feed calendar captured for this run, unconfirmed against the verified forward calendar. The next rate statement is October 28 at 2:00 PM ET, per the news-feed calendar captured for this run, unconfirmed against the verified forward calendar.
4.4 Geopolitical Backdrop
The scheduled geopolitical item with the most Nasdaq-specific weight is the Chinese state visit to the United States, carried as an all-day calendar item for Thursday, September 24, per the news-feed calendar captured for this run, unconfirmed against the verified forward calendar. Reporting on the agenda for that visit, and the session's trade-policy, export-control and regulatory headlines, were NOT CAPTURED IN THIS RUN and are not described here.
The Middle East items captured in the shared source pass for the crude package, the report that China privately asked Iran to restrain Yemen's Houthis (7:58 AM ET, September 17) and the two post-settlement reports of a Houthi statement on Saudi mediation (3:23 PM ET) and an explosion heard in Jazan and Abha (4:31 PM ET), reach this index only through crude and rates.
As analyst judgment, with no captured reporting behind it, export controls on semiconductors remain the tail risk that matters most here, because they act directly on the revenue that drove Friday's leadership.
4.5 Cross-Asset and Volatility
Volatility continued to compress. Per the desk note captured at 5:14 PM ET, the volatility index closed with a 14 handle, down 4 percent on the session, and its own volatility measure closed at 87 (down 0.4 percent per the ES package's capture of the same note). The same commentary described fixed-strike volatility dropping one to three points across the surface. Implied volatility for the broad index for Monday was quoted at 6.5 percent in the ES package's capture, implying an intraday range of roughly 41 basis points, which is a very quiet expectation.
The session was a quarterly options expiration day in the equity complex (per the positioning note captured for this run, unconfirmed against the verified forward calendar). Expiration-day flow is mechanical and carries no directional positioning information.
Elsewhere: crude fell 1.18 percent on the November contract per the crude package's capture, and the captured sentiment summary carried the headline that technology led as oil eased. The dollar index and digital-asset moves were NOT CAPTURED IN THIS RUN.
4.6 Institutional Positioning
The weekly commitments data for the week ending September 15, covering both the Nasdaq contract and the volatility index, was published at 4:21 PM ET Friday, after the settlement. This run captured the existence of those releases and none of their component figures, so this outlook makes no claim about speculator net length or the direction of the week's change. That is recorded as a coverage gap; no estimate is substituted.
What this run does hold is contract-level participation. Session volume of 495,894 against open interest of 252,220 gives a turnover ratio close to two to one. Volume at nearly double open interest on a quarterly expiration day (per the positioning note captured for this run, unconfirmed against the verified forward calendar) is consistent with roll and expiration mechanics, says nothing about fresh directional accumulation, and argues for discounting the volume figure as a conviction signal.
Options positioning context (fund proxy)
This run uses the listed Nasdaq-100 exchange-traded fund as the positioning proxy, alongside the cash index positioning table, because that is the dataset available for this instrument. Both are cash-domain readings. The futures-to-cash basis measured for this session is approximately 274 points, derived from the December settlement of 29,917.25 against a cash close derived from the published 0.67 percent change on a prior close of 29,446, and that derivation carries the rounding of the published percentage. The prior session's basis on the same method was 297 points. No positioning level below is converted into a futures price, and the level ladder above is built entirely from futures-domain pivot and standard deviation data.
Flow was the story. Market commentary reported that Nasdaq real-time hedging flow registered plus 6 billion dollars of delta on the day, driven by longer-dated call buying, and explicitly noted a continuing divergence against the broad index, which registered minus 5 billion dollars of index delta dominated by same-day expiry flow. A positive 6 billion dollar reading driven by longer-dated calls is a materially different signal from same-day expiry noise: it is duration-bearing positioning for upside.
The published positioning levels for the cash index, computed against a reference price of 29,446 which is the prior session close, read as follows. The primary gamma concentration strike sits at 29,500 and the call-side hedging boundary at 29,450, both listed strikes. The put-side support base sits at 28,500. The modeled gamma-flip level sits at 28,933 and the modeled volatility threshold at 29,240; neither is a listed strike, both are model outputs, and both move as positioning changes. The key support and resistance strikes published for the cash index are 29,500, 29,450, 29,550 and 29,000.
The important observation is that the cash close near 29,643 finished above both the published call-side hedging boundary at 29,450 and the primary gamma concentration strike at 29,500. Trading above the call-side boundary is the configuration in which dealer hedging tends to stop dampening upside, and it is consistent with the gamma tilt reading of 1.505 for the cash index, a call-heavy profile. Gamma notional for the cash index reads positive at 22.337 million dollars, while the fund proxy reads negative at minus 208.953 million dollars, and the 25 delta risk reversal reads minus 0.048 for the cash index; the fund's risk reversal was not captured.
The fund proxy itself closed at 722.06 against a previous close of 716.92, a gain of 0.72 percent on volume of 36,358,508 shares, with a 52-week high of 748.64 and a 52-week low of 555.60. Its published levels are the primary gamma concentration strike at 720, the call-side hedging boundary at 720, the put-side support base at 700, the modeled gamma-flip level at 715 and the modeled volatility threshold at 717; the fund's key-strike list was not captured. Call open interest reads 5.72 million against put open interest of 7.839 million, and next-expiry gamma accounts for 25.58 percent of the total. The fund also closed above its own published call-side boundary at 720.
One data-quality note is recorded deliberately. The fund's two volatility-point fields rendered inverted on this read, with the low volatility point at 900 sitting above the high volatility point at 720. Both fields are treated as low confidence and are excluded from the level structure entirely.
Night Session (6:00 PM ET Sunday to 3:00 AM ET Monday, Globex/Asia)
This is a Friday close, and the forecast addresses the Sunday reopen and the Monday session. Two full days of headline exposure separate Friday's 29,917.25 settlement from the first Monday print, and for this index that exposure is concentrated in technology and trade-policy news, with scheduled data a lesser factor. Gap levels in both directions are given below.
The contract reopens at 6:00 PM ET Sunday. The Chinese one-year and five-year loan prime rates will already have been published at 9:00 PM ET Saturday, with calendar forecasts of 3 percent and 3.5 percent against previous values of 3.00 percent and 3.50 percent, per the shared news-feed calendar capture in the CL and GC packages, unconfirmed against the verified forward calendar. Asian hours are where any semiconductor supply-chain or export-control headline is priced first, and that is the most likely source of a gap in this contract.
Gap levels both ways. An upside gap through the session high at 29,993.25 and toward the first pivot resistance at 30,057.67 would put the one-month high at 30,109.25 directly in play. A downside gap beneath the pivot point at 29,852.83 would expose the 29,712.42 to 29,648.00 entry zone quickly. The 14-day average true range of 442.54 means a reopen anywhere between roughly 29,474.71 and 30,359.79 is within one average day of Friday's settlement.
London Session (3:00 AM to 8:00 AM ET Monday)
European hours bring the first sustained liquidity of the week. The European Central Bank's Kazimir speaks at 4:30 AM ET (per the news-feed calendar captured for this run, unconfirmed against the verified forward calendar), the only European item on the calendar captured for Monday, and it is not a technology event. The practical reference through this window is the pivot point at 29,852.83: holding above it into the United States pre-market keeps the constructive read intact, while losing it early puts the first pivot support at 29,712.42 in play before the cash open.
Morning Session (9:30 AM to 12:00 PM ET Monday, RTH Open)
The calendar captured for Monday contains no United States economic data release. Goolsbee speaks at 6:30 AM ET, ahead of the cash open, and the Bank of Canada's Macklem speaks at 11:20 AM ET, per the news-feed calendar captured for this run, unconfirmed against the verified forward calendar. With no data anchor and a broad-index implied volatility of 6.5 percent for the session per the ES package's capture, the opening hours are likely to trade the level map and single-name news, with no macro catalyst on the slate.
The level map is tight overhead and well defined beneath. Immediately above sit the session high at 29,993.25 and the first pivot resistance at 30,057.67. Beneath sit the pivot point at 29,852.83, the first pivot support at 29,712.42 and the three-value confluence at 29,650.57, 29,649.25 and 29,648.00. A cash open that holds above 29,852.83 argues for a test of the one-month high at 30,109.25 during the week; a break beneath 29,712.42 hands the session to the entry zone.
Afternoon Session (12:00 PM to 4:00 PM ET Monday)
The afternoon carries no United States auction or data set-piece on the captured calendar, and the Reserve Bank of Australia's Hunter speaks at 3:00 PM ET, per the news-feed calendar captured for this run, unconfirmed against the verified forward calendar. Tuesday's pivot ladder is recomputed from Monday's high, low and settlement together, so its direction cannot be inferred from Monday's close alone. The references that frame Monday are the first pivot resistance at 30,057.67 above, into a week that carries three central bank speakers and a two-year auction on Tuesday (per the news-feed calendar captured for this run, unconfirmed against the verified forward calendar), and the session low at 29,648.00 beneath, below which the band spanned by the current averages between 29,522.65 and 29,760.29 comes back into contention.
Night Session Forward (6:00 PM ET Monday)
Residual bias into the Monday evening reopen carries toward Tuesday's speaker and auction sequence, with Williams at 10:05 AM ET, Jefferson at 10:20 AM ET, Barkin at 1:00 PM ET and the two-year note auction at 1:00 PM ET, per the news-feed calendar captured for this run, unconfirmed against the verified forward calendar. The Reserve Bank of Australia's Bullock speaks at 11:10 PM ET, per the news-feed calendar captured for this run, unconfirmed against the verified forward calendar. For a long-duration index, the auction is the most direct scheduled risk of the week: a weak result that lifts the front end works against the duration in this contract.
Expected Range (Monday Full Session)
Low-range scenario: the first pivot support at 29,712.42 to the first pivot resistance at 30,057.67, a width of 345.25, or 0.86 times the 14-day average daily range of 400.38
Mid-range scenario (most likely): Friday's low at 29,648.00 to the first pivot resistance at 30,057.67, a width of 409.67, essentially one 14-day average daily range
High-range scenario: the second pivot support at 29,507.58 to the second pivot resistance at 30,198.08, a width of 690.50, or 1.72 times the 14-day average daily range
Most Likely Path
The most likely path opens Monday near Friday's settlement, holds the pivot point at 29,852.83 through Asian and European hours, and works the 29,993.25 to 30,057.67 band during the United States morning as the market tests whether the move above the average band extends. A pullback inside that path finds the first pivot support at 29,712.42 and, deeper, the three-value confluence at 29,650.57, 29,649.25 and 29,648.00, which is where the Primary Setup bids. The alternative path, which the flat directional index and the two long-horizon sell studies make real, fails at the session high, loses the pivot point and returns to the band spanned by the current averages between 29,522.65 and 29,760.29. Scenario weightings are analyst judgment and carry no derived frequency.
Monday Economic Calendar
The week opens quiet by design. The forward calendar captured for this run shows no United States economic data release scheduled for Monday, September 21, consistent with the weekly commentary published at 4:11 PM ET Friday describing the week ahead as a quiet calendar against fragile sentiment. That statement is scoped to what this run's calendar capture shows and makes no exhaustive claim about every possible release.
Working through the day in order: Asian hours carry the residue of the Chinese one-year and five-year loan prime rate decisions published at 9:00 PM ET Saturday, with calendar forecasts of 3 percent and 3.5 percent per the shared news-feed calendar capture in the CL and GC packages, unconfirmed against the verified forward calendar. European morning brings the European Central Bank's Kazimir at 4:30 AM ET, per the news-feed calendar captured for this run, unconfirmed against the verified forward calendar. The United States morning has the Federal Reserve's Goolsbee at 6:30 AM ET ahead of the cash open, then the Bank of Canada's Macklem at 11:20 AM ET, per the news-feed calendar captured for this run, unconfirmed against the verified forward calendar. The afternoon carries no United States set-piece on the captured calendar; the Reserve Bank of Australia's Hunter speaks at 3:00 PM ET and Bullock at 11:10 PM ET, per the news-feed calendar captured for this run, unconfirmed against the verified forward calendar.
The single first-order event for this index falls on Tuesday, September 22, when three Federal Reserve speakers and a two-year note auction all land, with Williams at 10:05 AM ET, Jefferson at 10:20 AM ET, Barkin at 1:00 PM ET and the auction at 1:00 PM ET carrying a previous high yield of 4.204 percent and a previous bid-to-cover of 2.600, per the news-feed calendar captured for this run, unconfirmed against the verified forward calendar. For a long-duration index, the front-end auction is the most direct scheduled risk to the level map above.
Further out: Wednesday, September 23 brings United States flash purchasing managers indices at 9:45 AM ET, with the services reading forecast at 56 against a previous 56.5 and manufacturing at 53.6 against a previous 53.9, plus a five-year note auction at 1:00 PM ET, per the news-feed calendar captured for this run, unconfirmed against the verified forward calendar. Thursday, September 24 carries the Chinese state visit as an all-day item, initial jobless claims at 8:30 AM ET with a forecast of 206.5 thousand against a previous 196 thousand, new home sales at 10:00 AM ET (also on the verified forward calendar), and a seven-year note auction whose time was not captured in this run, per the news-feed calendar captured for this run, unconfirmed against the verified forward calendar. Friday, September 25 brings durable goods at 8:30 AM ET (also on the verified forward calendar) with a forecast of minus 0.3 percent, core durable goods at 8:30 AM ET forecast at 0.5 percent, and the final University of Michigan sentiment reading at 10:00 AM ET (per the news-feed calendar captured for this run, unconfirmed against the verified forward calendar). The verified forward calendar additionally lists Micron's fiscal fourth-quarter results after the close on Wednesday, September 30. The next Federal Open Market Committee rate statement is October 28 at 2:00 PM ET, per the news-feed calendar captured for this run, unconfirmed against the verified forward calendar.
Primary Trade Setup
Direction: Long
Rationale: The settlement sits above every moving average from the 5-day to the 200-day and 64.42 above its own pivot point of 29,852.83, the session closed at 78.0 percent of its range after gapping down at the open, percent K exceeds percent D on both captured stochastic horizons, and short-horizon composite studies read 80 percent buy. The current averages span 29,522.65 to 29,760.29 and the settlement is above that band; a retest of the band's upper region, where the first pivot support and the four-week retracement sit, is the cleanest entry this structure offers.
Entry Zone: 29,650 to 29,715
Stop Loss: 29,570 (beneath the 50 percent retracement of the four-week range at 29,581.13 and beneath the 1 standard deviation support at 29,618.74)
Target 1 (T1): 29,850 (the pivot point at 29,852.83, with the 38.2 percent retracement from the 13-week high at 29,837.51 beneath it)
Target 2 (T2): 29,993 (Friday's session high at 29,993.25)
Target 3 (T3, extended): 30,096 (the computed target price at 30,096.03, with the first pivot resistance at 30,057.67 beneath and the one-month high at 30,109.25 above, reached only if momentum extends through T2 on expanding volume)
Risk-to-Reward: Measured from the 29,682.50 midpoint of the entry zone against the 29,570 stop, risk is 112.50 points. Approximately 1:1.5 to T1, 1:2.8 to T2 and 1:3.7 to T3, each rounded to one decimal from the 112.50 point risk.
Invalidation: A settlement beneath 29,581.13, the 50 percent retracement of the four-week range, returns price inside the band spanned by the current averages and negates the thesis. On an intraday basis, acceptance beneath 29,618.74, the one standard deviation support, without prompt recovery is the working invalidation.
Stop distance versus volatility: The 112.50 point entry-to-stop distance is 25 percent of the 14-day average true range of 442.54, so this is a tight stop by this contract's standards, and the weekend gap exposure described in the night session above adds to the mismatch between stop distance and volatility.
Macro override: Any of the following invalidates the setup in real time regardless of price: a tightening of artificial-intelligence chip export controls on China; a hawkish surprise from the Tuesday speakers or a weak two-year auction that lifts the front end; a breakdown in the trade framework reported ahead of the Chinese state visit (per the news-feed calendar captured for this run, unconfirmed against the verified forward calendar); or a material reversal in the semiconductor complex that led Friday's advance. In the opposite direction, a decisive move through the one-month high at 30,109.25 on the Sunday reopen would remove the pullback entry entirely.
Session-timing condition: The Sunday reopen at 6:00 PM ET carries two days of unpriced exposure, and pricing is likely to be thin through the first hours of Globex trade. The cash open at 9:30 AM ET Monday provides the session's first liquid directional test of the level map above.
Sources and methodology
This outlook is built from our session review of the December E-mini Nasdaq-100 contract, NQZ26, the December '26 contract, prepared after Friday's close on September 18, 2026. Computed pivot levels come from Friday's session high, low and settlement as read from the daily bar, which the chart series reproduces on all five fields, and the daily bar does not time the low or the high, so no intraday path is asserted. Index positioning levels are quoted in cash terms as published and are never converted into futures prices; the measured futures-to-cash basis is approximately 274 points against 297 the prior session, computed against a cash close that is itself derived from the published 0.67 percent change on a 29,446 prior close and carries that rounding. Fund proxy concentrations are quoted in the fund's own price domain, and the fund's two inverted volatility-point fields are excluded from the level structure.
Scenario ranges are analyst judgment; they carry no calibration. Contract months are kept separate throughout. Scheduled items marked unconfirmed come from the news-feed calendar captured for this run and were not verified against the verified forward calendar. The dollar index, digital-asset moves, the ten-year yield level, the weekly commitments component figures, the exact volatility index close and the fund's key-strike list were not captured in this run and no figure is stated for any of them.
Thursday’s outlook for this contract is here. Outlooks for ES, NQ, GC and CL are collected on the market outlook page, and our forward trading record is on the performance statement.



