
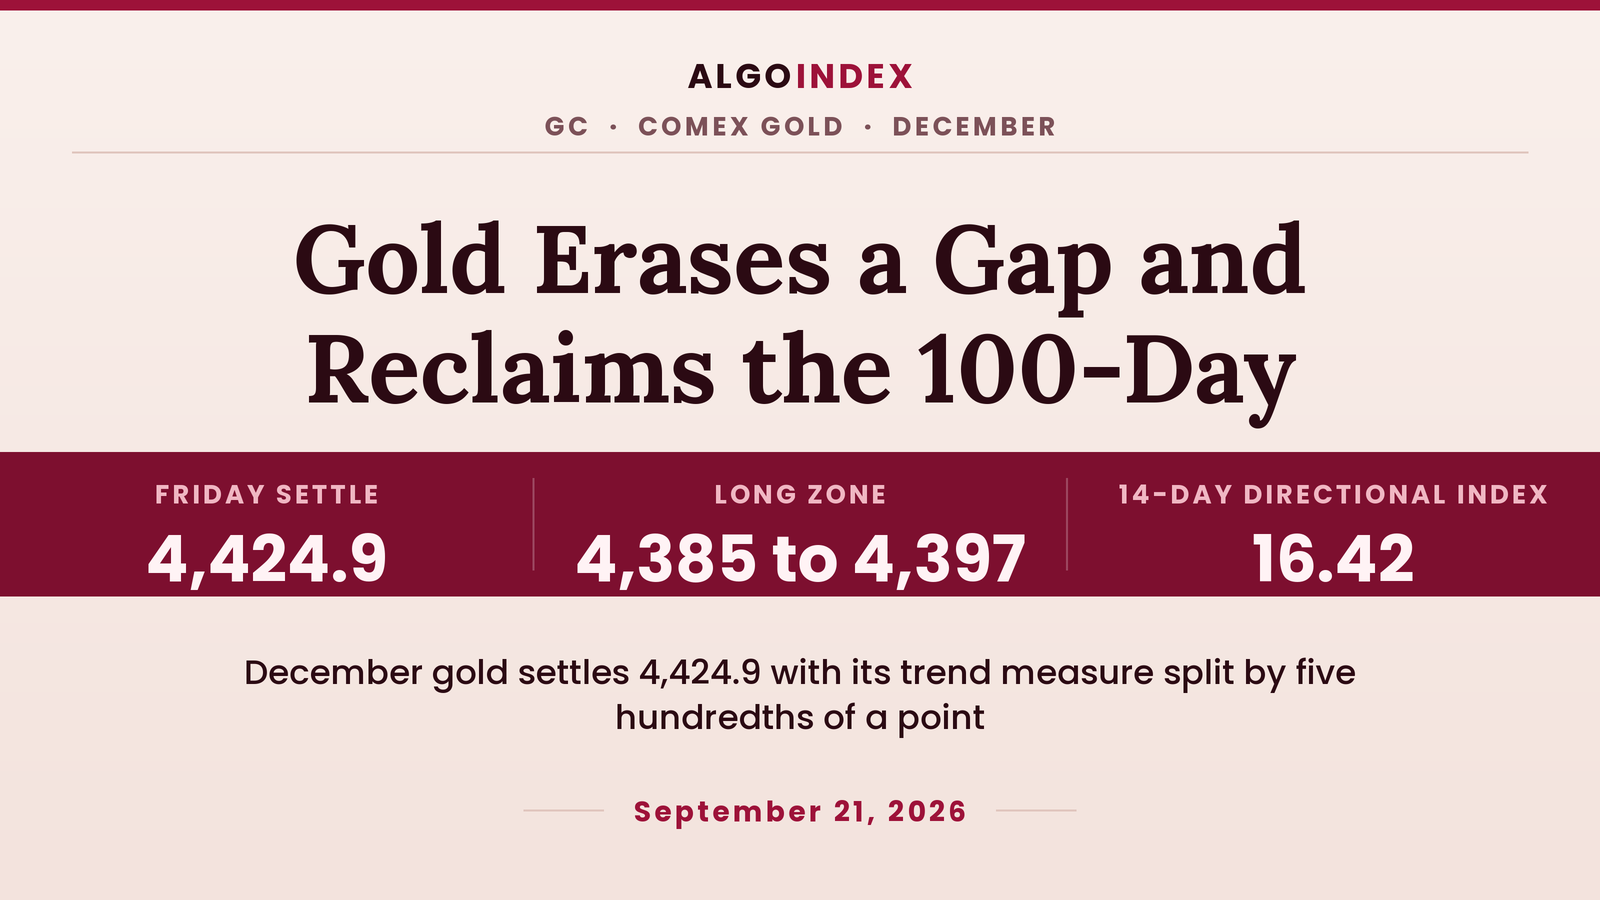
At the Friday open December gold printed 4,381.6, which is 18.1 beneath Thursday's 4,399.7 settlement. The contract slid to 4,372.2, turned, and finished 43.3 above its own open at 4,424.9, up 25.2 or 0.57 percent. The high reached 4,439.8. That settlement landed 78.0 percent of the way up a 67.6 point range measured from the low, 52.7 above the low and 14.9 beneath the high. Volume printed 138,899 contracts against open interest of 314,133.
A gap-down open that closes in the upper part of its range is a reversal signature. The documented facts are the 43.3 point rise from the open and the 78.0 percent closing position, and no comparison with earlier sessions in the corrective stretch is made, because those sessions were not captured in this run. The metal enters Monday 12.6 above its own pivot point of 4,412.3, back above the 50-day average at 4,342.8 and back above the 100-day average at 4,410.5. The damage is medium-term. All of that sits inside it: 23.47 percent beneath the 52-week high of 5,781.8, down 3.20 percent over twenty sessions, 67.2 beneath the 20-day average of 4,492.1. Monday's question is whether one reversal bar can carry that weight.
December gold settled at 4,424.9, up 0.57 percent, after opening 18.1 lower and recovering the whole deficit. It closed 12.6 above the pivot point at 4,412.3 and reclaimed the 100-day average at 4,410.5. Overhead the first references are Friday's 4,439.8 high, then the first pivot resistance at 4,452.4 with the computed target price at 4,452.0 beside it, and the 38.2 percent retracement from the 13-week high at 4,472.5. Support runs through the pivot point and the 100-day average into the grouping where the one standard deviation support at 4,387.9, the 13-week 50 percent retracement at 4,385.3 and the first pivot support at 4,384.8 sit inside 3.1 points. Three references, 3.1 points. The trend framework is a dead heat, with a 14-day directional index of 16.42 and its two directional components separated by five hundredths of a point. The primary setup is a long from 4,385 to 4,397, stop 4,358, targets 4,440, 4,452 and 4,480, into a Monday with no United States data on the captured calendar. No data anchor.
Where Friday's short finished
Thursday's outlook set a short from 4,410 to 4,425 with a stop at 4,455 and targets at 4,372, 4,322 and 4,295. Friday traded the whole band. The high at 4,439.8 printed above the top of it, so a retest fill was there. The stop at 4,455 was never reached. The low at 4,372.2 stopped short of the first target at 4,372, and the settlement at 4,424.9 finished back inside the entry band. We record that as a fill that survived and paid nothing. No target, no stop, no result. One caveat belongs with it: the daily bar does not order its low and its high, and this run captured the completed bar and the published level ladder with no time-stamped intraday series, so nothing here asserts whether the low preceded a fill or followed it.
The session's own macro read cuts both ways. Industrial production printed at 9:15 AM ET at 0.0 percent month over month against a 0.3 percent forecast, with capacity utilisation at 76.3 percent against 76.4 percent expected, and activity data beneath forecast is supportive for gold at the margin; the timing of the metal's recovery inside the session was not captured and is not asserted. Against that sits the yield side. The captured market wrap headline described ten-year Treasury yields rising during the session, with no level or quote time captured, and a rising long end raises the opportunity cost of holding an asset that pays nothing. The policy backdrop is restrictive too: the Federal Reserve projections published at 2:00 PM ET on Wednesday, September 16 show twelve of eighteen officials expecting one further 25 basis point increase this year, four expecting two and two expecting none, and the rate decision itself was not captured in this run. Gold rallied anyway. The dollar index level and its session change were NOT CAPTURED IN THIS RUN, so this outlook attributes nothing to the dollar, and what outweighed the yield move on the session was not captured either.
A dead heat inside a damaged uptrend
Start with the distances. The settlement sits 23.47 percent beneath the 52-week high of 5,781.8 and 15.84 percent above the 52-week low of 3,819.9, both measured on the provider's basis. Gold is closer to its yearly low than to its yearly high, which is an unusual sentence to write about this metal, and it frames every constructive read here as a counter-trend read until proven otherwise. The intermediate markers are tighter. The 13-week high and the one-month high are the same print at 4,755.0, 330.1 above the settlement, so the best price of the quarter was set inside the last month. The one-month low is 4,273.3, 151.6 beneath. The 13-week low is 4,015.6. Price sits roughly 31 percent of the way up the one-month range and, by the 20-day raw stochastic reading of 31.47 percent, inside the lower third of its 20-day range. Raw readings on the other horizons were not captured in this run.
The average stack is the least constructive part of this outlook. The 5-day sits at 4,379.4, the 20-day at 4,492.1, the 50-day at 4,342.8, the 100-day at 4,410.5, the 200-day at 4,648.6 and the year-to-date average at 4,667.2. That sequence climbs and falls without order, which is the arithmetic signature of a market that changed direction inside the last quarter. Read it as damage. Measured against the settlement, price is 45.5 above the 5-day, 67.2 beneath the 20-day, 82.1 above the 50-day, 14.4 above the 100-day, 223.7 beneath the 200-day and 242.3 beneath the year-to-date average. Above two, beneath two. That split is exactly what the multi-indicator composite reports when it registers a sell on the 20-day average versus price while still carrying seven buy studies. The published moving-average crossing thresholds were not captured for this contract in this run, so the 100-day average at 4,410.5 is the nearest captured trend line above the entry zone. Two speeds run through it. Period performance carries the same two speeds: down 3.20 percent over twenty sessions, up 5.32 percent over fifty, down 7.76 percent over one hundred and down 1.61 percent year to date, against a five-session gain of 0.36 percent. The 200-session change was not captured.
Momentum is where the constructive case lives. The 9-day percent K at 52.73 sits above its percent D of 37.58, and the 14-day percent K at 36.85 above its percent D of 25.09. Earlier K and D values were not captured, so this outlook states that K exceeds D on both captured horizons and does not assert when a crossing occurred; the 20-day and 50-day K and D values were not captured. Both fast lines lead. The 14-day relative strength reads 49.91 against the neutral 50 midpoint and rose 2.13 points on the session; other relative strength horizons were not captured. Now the counterweight. The 14-day directional index reads 16.42, beneath the conventional 25 threshold that denotes a trending market, with a positive directional component of 16.56 against a negative of 16.61. Five hundredths of a point separate them. That is as close to a dead heat as the measure produces, and readings on other horizons were not captured in this run. Historic volatility on the 14-day horizon reads 19.26 percent, with other horizons uncaptured, so nothing is said here about whether recent sessions have been calmer than the quarter. That figure stands alone. The composite reads 32 percent buy at weak strength, with its direction rated strengthening and its trend indicator on hold. Short-term studies average 20 percent buy, medium-term 75 percent and long-term register hold. The component-by-component table was not captured, so the individual studies are not named.
The levels, top to bottom
Overhead the map is dense and close. Friday's high at 4,439.8 comes first, 14.9 above the settlement. Then the pairing that matters most: the first pivot resistance at 4,452.4 with the computed target price at 4,452.0 sitting 0.4 beneath it, two independent computations landing within half a point. Above those sit the 38.2 percent retracement from the 13-week high at 4,472.5, the second standard deviation resistance at 4,477.2 which is 4.7 above it, and the second pivot resistance at 4,479.9, three references inside 7.4 points. Dense supply. Then the third standard deviation resistance at 4,489.0, the 20-day average at 4,492.1 whose reclaim would flip the composite's short-term sell study, the 50 percent retracement of the four-week range at 4,514.1 and the third pivot resistance at 4,520.0. The 20-day is the study to watch. Further out the ladder thins: the 38.2 percent retracement from the four-week high at 4,571.0, the 200-day average at 4,648.6, the year-to-date average at 4,667.2 and the lower high of the current swing at 4,755.0.
Beneath price the first two references sit almost on top of each other. The pivot point is 4,412.3, the mechanical midpoint of Monday's ladder and the first level a pullback contends with, and the 100-day average is 4,410.5, reclaimed on the session. Thursday's settlement at 4,399.7 follows. Then the tightest grouping in this outlook: the one standard deviation support at 4,387.9, the 50 percent retracement of the 13-week range at 4,385.3 and the first pivot support at 4,384.8, three independent references inside 3.1 points, The lowest of them sits 0.2 beneath the entry zone's 4,385 edge, adjacent below it and outside it. The 5-day average at 4,379.4 sits just under that grouping. Beneath comes a second coincidence: the second standard deviation support at 4,372.6 and Friday's low at 4,372.2, effectively the same price, 0.4 apart. Then the third standard deviation support at 4,360.8, which is the structural basis for the stop, the second pivot support at 4,344.7 with the 50-day average at 4,342.8 beside it, the third pivot support at 4,317.2 and the 38.2 percent retracement from the 13-week low at 4,298.1, beneath which the recovery thesis fails structurally.
Volatility frames all of it. The 14-day average true range is 108.7, which the provider reports as 2.50 percent of price on its own denominator and which works out to 2.46 percent against the 4,424.9 settlement; true-range readings on other horizons were not captured. The 14-day average daily range is 109.0, and Friday's realised 67.6 came in at 62 percent of it, so this was a quiet session in range terms with strong directional content. Quiet range, decisive close. A projection of one average true range from the settlement spans 4,316.2 to 4,533.6, and that envelope contains the entry zone and all three targets. Open interest of 314,133 against session volume of 138,899 puts turnover at 44 percent of open interest, ordinary two-way participation and no sign of a positioning capitulation.
Positioning itself is mostly a gap in this run. The weekly commitments data for the week ending September 15 was published at 4:20 PM ET Friday, after the settlement, and this run captured the release without its component figures, so no claim is made about money manager net length or commercial hedgers. Central bank purchase figures and fund holdings data were not captured either. What remains is the listed fund proxy, read qualitatively and never converted into a futures price; it tracks bullion at roughly a one-to-eleven ratio with a management fee drag and carries no clean basis to the contract. The fund closed at 401.35 against a previous close of 398.36, a gain of 0.75 percent on volume of 7,581,577 shares, with a 52-week high of 509.70 and a 52-week low of 333.81, so the proxy confirmed the direction and slightly exceeded the magnitude of the futures move. Direction confirmed. Call-side gamma reads negative at minus 317 million while put-side gamma reads positive at 198 million, and the share of gamma attributable to the next expiry is 23.50 percent. Negative call-side gamma is the configuration in which dealer hedging tends to amplify an upside move, a mild tailwind, and the modest next-expiry share means near-dated options are not dominating the structure. One field is excluded on purpose. The proxy's two volatility-point fields rendered inverted on this read, with the low point at 500 above the high point at 410, so both are treated as low confidence and sit outside the level structure entirely.
The trade map for Monday
The primary setup is a long from 4,385 to 4,397, bidding a pullback into the grouping where the one standard deviation support at 4,387.9 and the 13-week 50 percent retracement at 4,385.3 sit, with the first pivot support at 4,384.8 adjacent beneath the lower edge. Risk sits beneath the band. The stop is 4,358, beneath the third standard deviation support at 4,360.8, which itself sits beneath Friday's low at 4,372.2 and the effectively coincident second standard deviation support at 4,372.6. The first target is 4,440, Friday's session high at 4,439.8. The second is 4,452, where the computed target price at 4,452.0 and the first pivot resistance at 4,452.4 sit within half a point. The third is 4,480, the second pivot resistance at 4,479.9, grouped with the second standard deviation resistance at 4,477.2 and the 13-week 38.2 percent retracement at 4,472.5. Three objectives, all overhead.
From the 4,391 midpoint the risk is 33 points, approximately 1:1.5 to the first target, 1:1.8 to the second and 1:2.7 to the third. That 33 points is 30 percent of the 14-day average true range of 108.7. A tight stop by this contract's standards. It is anchored to the third standard deviation band at 4,360.8. The weekend gap exposure described below adds to the mismatch between stop distance and volatility. Gap levels run both ways at the Sunday reopen. An upside gap through the session high at 4,439.8 and toward the first pivot resistance at 4,452.4 would extend the reversal and open the 13-week 38.2 percent retracement at 4,472.5. A downside gap beneath the session low at 4,372.2, which is effectively the second standard deviation support at 4,372.6, would negate the reversal and expose the third standard deviation support at 4,360.8. Either way, the map holds. One average true range of 108.7 means a reopen anywhere between roughly 4,316.2 and 4,533.6 is within a single average day of Friday's settlement.
Two full days of headline exposure separate Friday's 4,424.9 settlement from the first Monday print, and for this metal that exposure has a scheduled component. Saturday carries the first. The Chinese central bank publishes its one-year and five-year loan prime rates at 9:00 PM ET Saturday, September 19, with calendar forecasts of 3 percent and 3.5 percent against previous values of 3.00 percent and 3.50 percent, per the news-feed calendar captured for this run, unconfirmed against the verified forward calendar. Forecast matches previous. An unchanged outcome is what the calendar's own forecast implies, while a cut would ease Chinese financial conditions and is conventionally read as supportive for physical demand in the largest consuming market. Asian hours are the natural window for that response. The unscheduled component is the Middle East. Press reports captured in the shared source pass for the crude package described China privately asking Iran to use its influence to restrain Yemen's Houthis following a Saudi appeal (7:58 AM ET, September 17). The same source pass carried reports of Saudi Arabia seeking to return roughly half the capacity of its East-West pipeline within days after a drone-strike shutdown (11:47 AM ET, September 16). Each of those reduces the haven premium. Two items ran the other way and both landed late: a report at 3:23 PM ET said a senior Houthi figure stated Saudi Arabia had requested Iranian mediation, and a report at 4:31 PM ET described an explosion heard in Jazan and Abha in Saudi Arabia. The capture records both as arriving after the session, so the settlement excludes them, and whether any post-settlement trading priced them was not captured. Other geopolitical items during the session were NOT CAPTURED IN THIS RUN.
Monday's own slate is thin. The calendar captured for this run shows no United States economic data release scheduled for September 21, consistent with the weekly commentary published at 4:11 PM ET Friday describing the week ahead as a quiet calendar against fragile sentiment, and that statement is scoped to what this run's capture shows. Working through the day: the European Central Bank's Kazimir speaks at 4:30 AM ET, the only European item captured, then the Federal Reserve's Goolsbee at 6:30 AM ET ahead of the cash open, the Bank of Canada's Macklem at 11:20 AM ET, and the Reserve Bank of Australia's Hunter at 3:00 PM ET and Bullock at 11:10 PM ET, all per the news-feed calendar captured for this run, unconfirmed against the verified forward calendar. Speakers only. With no data anchor, the United States morning is likely to trade the dollar and the level map. A session that opens inside 4,412.3 to 4,452.4 and holds it is consolidating the reversal; a decisive move through either edge sets Monday's direction. The first-order event for gold falls on Tuesday, September 22, when Williams speaks at 10:05 AM ET, Jefferson at 10:20 AM ET, Barkin at 1:00 PM ET and a two-year note auction lands at 1:00 PM ET carrying a previous high yield of 4.204 percent and a previous bid-to-cover of 2.600, per the news-feed calendar captured for this run, unconfirmed against the verified forward calendar. For this metal the auction matters directly. A weak result that pushes yields higher is a straight headwind, and a strong one is the reverse. A week of speakers without a data anchor also means commentary carries more price impact than usual.
Scenario ranges are analyst judgment and carry no derived frequency. The low-range case runs from the first pivot support at 4,384.8 to the first pivot resistance at 4,452.4, a width of 67.6, or 0.62 times the 14-day average daily range of 109.0. The most likely case runs from Friday's low at 4,372.2 to the second pivot resistance at 4,479.9, 107.7 wide, essentially one average daily range. That is the base case. The high-range case runs from the second pivot support at 4,344.7 to the third pivot resistance at 4,520.0, 175.3 wide or 1.61 times the average range. Three cases, one ladder.
The most likely path opens Monday near Friday's settlement, works back toward the pivot point at 4,412.3 and the 100-day average at 4,410.5 through Asian and European hours as the reversal is retested, finds buyers in the 4,387.9 to 4,384.8 grouping, and recovers through the United States session toward 4,439.8 and the paired references near 4,452. The alternative path gaps beneath 4,372.2 at the Sunday reopen on a hawkish surprise or a firm dollar, and never offers the pullback entry at all. The weekend exposure makes that real. Gold's other complication is the company it keeps. Crude fell 1.18 percent on the November contract to 96.08 on reports pointing toward a recovery in Middle East energy flows. Equities finished mostly higher, with the broad index up 0.17 percent, the technology index up 0.67 percent and the industrial average down 0.18 percent. That is risk-on. The session also carried a quarterly options expiration in the equity complex (per the positioning note captured for this run, unconfirmed against the verified forward calendar). A risk-on session in equities is an unhelpful backdrop for this metal, and Friday's gain came in spite of it.
Gold enters Monday above its own midpoint, with a trend measure that cannot say which side is winning.
The complete data picture
Every number behind Monday’s plan, charted first, then the full level map, then the complete numeric reference underneath.
Full numeric reference, every remaining figure from the session review
Carried below in the review's own order: the session summary from section 1, sections 2.1 to 2.6, the level notes behind sections 3.1 and 3.2, sections 4.1 to 4.6, the fund proxy context from section 5, the session-by-session forecast from section 6, the Monday calendar from section 7 and the primary setup from section 8.
Level notes (3.1 Resistance and 3.2 Support)
4,439.8 is Friday's session high, the highest print of the completed session, 14.9 above the settlement and the first Primary Setup target.
4,452.4 is Pivot R1, the first pivot resistance of Monday's ladder, effectively identical to the computed target price of 4,452.0 sitting 0.4 beneath it. Two independent computations landing within half a point is the tightest overhead pairing on the map, and 4,452 is the second Primary Setup target.
4,472.5 is the 38.2 percent retracement from the 13-week high, the first Fibonacci reference of the larger corrective move, 4.7 beneath the 2 standard deviations resistance.
4,477.2 is the 2 standard deviations resistance, the second standard deviation band of the five-period calculation.
4,479.9 is Pivot R2, the second pivot resistance, grouped with the 2 standard deviations resistance and the 13-week Fibonacci reference inside 7.4 points, a three-value overhead grouping, and the third Primary Setup target.
4,489.0 is the 3 standard deviations resistance, the outer statistical band.
4,492.1 is the 20-day moving average, the average the composite's short-term sell signal is measured against, 67.2 above the settlement. Reclaiming it would flip that study.
4,514.1 is the 50 percent retracement of the four-week range, half the four-week decline recovered.
4,520.0 is Pivot R3, the third and outermost pivot resistance of Monday's ladder. Above the ladder sit the 38.2 percent retracement from the four-week high at 4,571.0, the 200-day average at 4,648.6, the year-to-date average at 4,667.2, the 13-week and one-month high at 4,755.0 and the 52-week high at 5,781.8.
4,412.3 is the Pivot Point, the mechanical midpoint of Monday's ladder, 12.6 beneath the settlement, and the first level a pullback contends with. Holding above it keeps gold on the constructive side of its own computed reference.
4,410.5 is the 100-day moving average, a trend average the settlement reclaimed on the session, 14.4 beneath it, and the nearest captured trend line above the Primary Setup entry zone.
4,387.9 is the 1 standard deviation support, the first standard deviation band and the upper reference of the entry-zone grouping.
4,385.3 is the 50 percent retracement of the 13-week range, half of the 13-week range, effectively coincident with the first pivot support 0.5 beneath it.
4,384.8 is Pivot S1, the first pivot support of Monday's ladder. The grouping of this level with the 13-week 50 percent retracement at 4,385.3 and the 1 standard deviation support at 4,387.9 places three independent references inside 3.1 points, the tightest confluence in this outlook and the basis for the Primary Setup entry. The level sits 0.2 beneath the 4,385 lower edge of the entry zone, adjacent below it.
4,379.4 is the 5-day moving average, 45.5 beneath the settlement and the nearest average under the entry zone.
4,372.6 is the 2 standard deviations support, the second standard deviation band, sitting 0.4 above Friday's session low.
4,372.2 is Friday's session low, the lowest print of the completed session, effectively identical to the 2 standard deviations support, and the intraday invalidation reference.
4,360.8 is the 3 standard deviations support, the outer statistical band on the downside and the structural basis for the Primary Setup stop.
4,344.7 is Pivot S2, the second pivot support of Monday's ladder, with the 50-day moving average at 4,342.8 beside it.
4,317.2 is Pivot S3, the third and outermost pivot support.
4,298.1 is the 38.2 percent retracement from the 13-week low, the Fibonacci reference beneath which the recovery thesis fails structurally. Further down sit the one-month low at 4,273.3, the 13-week low at 4,015.6 and the 52-week low at 3,819.9.
1. Session summary
December gold settled at 4,424.9, up 25.2 on the session, a gain of 0.57 percent from Thursday's 4,399.7 close. The shape of the day matters more than the size of the gain. The contract opened at 4,381.6, which is 18.1 beneath Thursday's settlement, traded down to 4,372.2, then recovered through the entire opening deficit and closed at 4,424.9, which is 43.3 above its own open and 78.0 percent of the way up the session range measured from the low. A gap-down open that closes in the upper part of the session range is a reversal signature; the documented facts are the 43.3 point open-to-close rise and the 78.0 percent closing position, and no comparison with earlier sessions in the corrective stretch is made because those sessions were not captured in this run.
The contract-domain check is clean for this instrument. The December contract is the volume and open-interest leader at 138,899 and 314,133 respectively, and the chart series reproduces the provider's bar exactly: open 4,381.6, high 4,439.8, low 4,372.2, close 4,424.9, change plus 25.2 or 0.57 percent on both surfaces. Every level in this outlook is computed from December, and no cross-contract ambiguity exists tonight.
The dollar index level and its session change were NOT CAPTURED IN THIS RUN, so this outlook does not attribute the session to the dollar. The one United States activity release captured, per the shared calendar capture in the ES package, was industrial production at 9:15 AM ET, which printed 0.0 percent month over month against a 0.3 percent forecast, with capacity utilisation at 76.3 percent against a 76.4 percent forecast. Activity data beneath forecast is supportive for gold at the margin; the timing of the metal's recovery within the session was not captured and is not asserted.
The structural contradiction heading into Monday is between a constructive session and a damaged medium-term picture. Constructive: the reversal close, a short-term stochastic reading from a low base with the 9-day percent K at 52.73 above a percent D of 37.58 and the 14-day percent K at 36.85 above a percent D of 25.09, a settlement 12.6 above its own pivot point of 4,412.3, and price back above the 50-day average of 4,342.8 and the 100-day average of 4,410.5. Damaged: the contract sits 23.47 percent beneath its 52-week high of 5,781.8, it is down 3.20 percent over the last twenty sessions, it remains 67.2 beneath the 20-day average of 4,492.1 and 223.7 beneath the 200-day average of 4,648.6, and the multi-indicator composite reads only 32 percent buy with strength rated weak. The one encouraging note inside that composite is that its direction is rated strengthening.
The trend framework says neither side owns this market. The 14-day directional index reads 16.42 with a positive directional component of 16.56 against a negative component of 16.61, a separation of five hundredths of a point. That is as close to a dead heat as the measure produces, and it argues for trading the levels. The Primary Setup is a long from the 4,385 to 4,397 entry zone, built on the grouping where the first pivot support, the one standard deviation support and the 50 percent retracement of the 13-week range converge inside roughly three points, the first pivot support sitting 0.2 beneath the zone's lower edge, with objectives back at the session high and the first pivot resistance.
2.1 Intraday and Session Review
The December contract opened at 4,381.6, gapping 18.1 beneath Thursday's 4,399.7 settlement, and extended to a session low of 4,372.2 before turning. The high of 4,439.8 and that low bracket a 67.6 point range, which is 1.528 percent of the settlement and well beneath the 14-day average daily range of 109.0. This was a narrow session by gold's recent standards even though its internal structure was decisive.
The settlement at 4,424.9 sits 52.7 above the session low and 14.9 beneath the session high, placing the close at 78.0 percent of the session range measured from the low. Combined with the 43.3 point advance from the open, that is an upper-quartile close on a day that began below the prior settlement. This run captured the completed daily bar and the published level ladder, with no time-stamped intraday series, so the precise sequencing within the session is not something this outlook asserts; what the completed bar supports is the open-to-close relationship and the closing position in the range, both of which are recorded above.
The settlement 12.6 above the pivot point of 4,412.3 is the mechanical fact that carries into Monday. Gold enters the new week on the stronger side of its own computed midpoint, which is the mirror image of where crude enters it, and that divergence is one of the more useful cross-instrument observations available tonight.
2.2 Daily Structure
The settlement sits 23.47 percent beneath the 52-week high of 5,781.8 and 15.84 percent above the 52-week low of 3,819.9, both measured on the provider's basis from the high and the low respectively. Gold is closer to its yearly low than to its yearly high, which is an unusual description for this metal after the advance the market has become accustomed to, and it frames every bullish read in this outlook as a counter-trend read until proven otherwise.
The intermediate markers are tighter. The 13-week high and the one-month high are the same print at 4,755.0, so the highest value of the past quarter was set within the last month, 330.1 above the settlement. The one-month low is 4,273.3, 151.6 beneath the settlement, and the 13-week low is 4,015.6. The settlement sits inside the lower half of the one-month range and inside the lower third of the 20-day range by the raw stochastic reading of 31.47 percent, which is the arithmetic of a market that fell hard, based, and has begun to lift.
The raw stochastic reading captured is the 20-day at 31.47 percent; raw readings on the other horizons were not captured in this run, so no horizon-by-horizon comparison is made.
2.3 4-Hour and Swing Structure
The swing structure is corrective inside a larger uptrend that stalled. The most recent swing high at 4,755.0 is the one-month and 13-week high; the most recent swing low relevant to the current move is the one-month low at 4,273.3. The settlement at 4,424.9 sits 151.6 above that low and 330.1 beneath that high, roughly 31 percent of the way up the one-month range.
Fibonacci placement gives the overhead map. The 38.2 percent retracement measured from the four-week high sits at 4,571.0, the 50 percent retracement of the four-week range at 4,514.1, and the 38.2 percent retracement from the 13-week high at 4,472.5. Beneath, the 50 percent retracement of the 13-week range sits at 4,385.3, only 0.5 from the first pivot support at 4,384.8, and the 38.2 percent retracement from the 13-week low at 4,298.1. The pairing of the 13-week 50 percent retracement at 4,385.3 with the first pivot support at 4,384.8 is the single most useful confluence in this outlook and forms the spine of the Primary Setup.
The oscillator readings captured are the 9-day and 14-day stochastics. The 9-day percent K at 52.73 currently sits above its percent D of 37.58, and the 14-day percent K at 36.85 above its percent D of 25.09. Earlier K and D values were not captured, so this outlook states that K exceeds D on both captured horizons and does not assert when a crossing occurred; the 20-day and 50-day K and D values were not captured. K above D on both captured horizons is the strongest single argument here for the long side. The 14-day relative strength reads 49.91 compared with the neutral 50 midpoint, and rose 2.13 points on the session; other relative strength horizons were not captured.
2.4 Moving Averages
The average stack is the least constructive part of this outlook and it is not arranged for an uptrend. The 5-day average sits at 4,379.4, the 20-day at 4,492.1, the 50-day at 4,342.8, the 100-day at 4,410.5, the 200-day at 4,648.6 and the year-to-date average at 4,667.2. The sequence is not monotonic in either direction, which is the arithmetic signature of a market that has changed direction inside the last quarter.
Against the settlement of 4,424.9: price is 45.5 above the 5-day, 67.2 beneath the 20-day, 82.1 above the 50-day, 14.4 above the 100-day, 223.7 beneath the 200-day and 242.3 beneath the year-to-date average. Being above the 50-day and 100-day while beneath the 20-day and 200-day is precisely the mixed configuration the composite is reporting when it registers a sell on the 20-day average versus price study while still carrying seven buy studies. The published moving-average crossing thresholds were not captured for this contract in this run, so the 100-day average at 4,410.5 is the nearest captured trend line above the Primary Setup entry zone.
Period performance confirms the two-speed picture: down 3.20 percent over 20 sessions, up 5.32 percent over 50, down 7.76 percent over 100 and down 1.61 percent year to date, against a five-session gain of 0.36 percent. The 200-session change was not captured in this run.
2.5 Oscillator and Trend Readings
The directional index framework is the clearest statement of indecision available. The 14-day index reads 16.42 with a positive directional component of 16.56 against a negative of 16.61. The two directional components sit within a fraction of a point of each other, and the index value is beneath the conventional 25 threshold that denotes a trending market. Directional index readings on other horizons were not captured in this run.
Historic volatility on the 14-day horizon reads 19.26 percent; other horizons were not captured in this run, so no statement is made about whether recent sessions have been calmer than the quarter.
The multi-indicator composite reads 32 percent buy with strength rated weak and direction rated strengthening. The composite trend indicator registers hold. Grouped by horizon, the short-term studies average 20 percent buy, the medium-term 75 percent buy and the long-term register hold. Within the detail as captured: the 20-day average versus price registers sell and the 50-to-100 day crossover registers sell, against seven studies that register buy; the remaining studies register hold. The component-by-component table was not captured in this run, so the individual buy and hold studies are not named. Two sells against seven buys, with the balance on hold, nets to a weak but strengthening 32 percent.
2.6 Volatility and Expected Range
The 14-day average true range is 108.7, which the provider reports as 2.50 percent of price on its own denominator and as-of; against the 4,424.9 settlement it is 2.46 percent. True-range readings on other horizons were not captured in this run, so no statement is made about volatility expansion or contraction over the quarter.
The 14-day average daily range is 109.0; other horizons were not captured. Friday's realised range of 67.6 came in at 62 percent of the 14-day average, so Friday was a quiet session in range terms even though its directional content was strong.
A projection of one 14-day average true range of 108.7 from the settlement spans 4,316.2 to 4,533.6. A stop placed closer than roughly 109 points to entry is inside a single average day of movement, and the Primary Setup's 33 point stop distance is deliberately much tighter than that and anchored to a confluence.
4.1 Dollar and Real Yields
The dollar index level and its session change were NOT CAPTURED IN THIS RUN, so this outlook makes no statement about the dollar's path on Friday. The shared sentiment summary captured at 4:11 PM ET carried the headline that the Bank of Japan delivered a split rate increase; no further detail on that decision was captured.
The yield side is the complication. The captured market wrap headline described ten-year Treasury yields rising during Friday's session; no yield level or quote time was captured in this run, so no level is stated here. A rising long-end yield raises the opportunity cost of holding a non-yielding asset, and it is the single clearest explanation for why gold sits 23.47 percent beneath its 52-week high despite an unsettled geopolitical backdrop. Gold rallying on a day the headline described yields rising is notable precisely because the yield move argued the other way; what outweighed it on the session was not captured and is not asserted.
4.2 Fed and Monetary Policy
The monetary backdrop is restrictive, which is a structural headwind for this metal. The Federal Reserve projections published at 2:00 PM ET on Wednesday, September 16 show twelve of eighteen officials expecting one further 25 basis point increase this year, four expecting two further increases and two expecting none. The rate decision itself was not captured in this run and is not characterised here.
The forward policy calendar inside the forecast window is speaker-heavy and data-light. The Federal Reserve's Goolsbee speaks Monday at 6:30 AM ET, per the news-feed calendar captured for this run, unconfirmed against the verified forward calendar. Tuesday carries Williams at 10:05 AM ET, Jefferson at 10:20 AM ET and Barkin at 1:00 PM ET, per the news-feed calendar captured for this run, unconfirmed against the verified forward calendar. The next rate statement is October 28 at 2:00 PM ET, per the news-feed calendar captured for this run, unconfirmed against the verified forward calendar. For a market this sensitive to the path of policy, a week of speakers without a data anchor means commentary carries more price impact than usual.
4.3 Geopolitical Backdrop
The Middle East backdrop that normally underpins a gold bid is currently running in the de-escalation direction, which is part of why the metal has struggled. Press reports captured in the shared source pass for the crude package described China privately asking Iran to use its influence to restrain Yemen's Houthis following a Saudi appeal (7:58 AM ET, September 17) and Saudi Arabia seeking to return roughly half the capacity of its East-West pipeline within days after a drone-strike shutdown (11:47 AM ET, September 16). Each of those reduces the haven premium. Other geopolitical items during the session were NOT CAPTURED IN THIS RUN.
Two items ran the other way and both landed late. A report at 3:23 PM ET said a senior Houthi figure stated Saudi Arabia had requested Iranian mediation, and a report at 4:31 PM ET described an explosion heard in Jazan and Abha in Saudi Arabia. The capture records both as arriving after the session; whether any post-settlement trading priced them was not captured, so this outlook states only that the settlement excludes them.
4.4 China and Structural Demand (Central Bank Buying, PBOC, ETF Flows)
The most concrete China item inside the forecast window is a rate decision that lands over the weekend. The Chinese central bank publishes its one-year and five-year loan prime rates at 9:00 PM ET Saturday, September 19, with the forward calendar carrying forecasts of 3 percent and 3.5 percent against previous values of 3.00 percent and 3.50 percent respectively, per the news-feed calendar captured for this run, unconfirmed against the verified forward calendar. An unchanged outcome is what the calendar's own forecast implies; a cut would ease Chinese financial conditions and is conventionally read as supportive for physical demand in the largest consuming market.
The larger China item is diplomatic. The Chinese state visit to the United States is carried as an all-day calendar entry for Thursday, September 24, per the news-feed calendar captured for this run, unconfirmed against the verified forward calendar. Reporting on the agenda for that visit was NOT CAPTURED IN THIS RUN. A genuine trade de-escalation would reduce the tail-risk premium embedded in gold, and the visit is the most consequential scheduled geopolitical event on the captured calendar for this metal.
This run did not capture central bank purchase figures or exchange-traded fund holdings data, so this outlook makes no claim about official-sector buying or fund flows. That is a gap in this run's coverage and not an assessment that those flows are absent.
4.5 Energy and Cross-Asset
Crude fell on the session, with the November contract settling at 96.08, down 1.18 percent per the crude package's capture, on reports pointing toward a recovery in Middle East energy flows. The captured sentiment summary carried the headline that technology led as oil eased; no commentary connecting the crude move to inflation expectations or to the dollar was captured.
Equities finished mostly higher, with the broad index up 0.17 percent, the technology index up 0.67 percent and the industrial average down 0.18 percent, per the quote-provider commentary captured for the equity instruments. The session also carried a quarterly options expiration in the equity complex (per the positioning note captured for this run, unconfirmed against the verified forward calendar). Digital-asset moves were NOT CAPTURED IN THIS RUN. A risk-on session in equities is not a helpful backdrop for gold, and the metal's gain came in spite of it.
4.6 Institutional Positioning (COT, ETF Holdings, Speculator Length)
The weekly commitments data for the week ending September 15 was published at 4:20 PM ET Friday, after the settlement. This run captured the existence of that release but did not capture its component figures, so this outlook makes no claim about money manager net length, commercial hedger positioning or the direction of the week's change. That is recorded as a coverage gap and is not estimated.
What positioning evidence this run does hold is indirect and comes from the exchange-traded fund proxy described below, plus the December contract's open interest of 314,133 against session volume of 138,899. Volume at 44 percent of open interest is ordinary two-way participation and not a positioning washout, which is consistent with a consolidation and not a capitulation.
Options positioning context (fund proxy)
This run uses the listed exchange-traded fund proxy for the positioning dataset available on gold, and reads it qualitatively only. The fund tracks bullion at roughly a one-to-eleven ratio with a management fee drag and carries no clean basis to the futures contract, so no level in this outlook is derived from it and no fund price is translated into a futures price. The proxy is used to characterise the shape of dealer positioning and not to produce numbers.
What the proxy showed on the session: the fund closed at 401.35 against a previous close of 398.36, a gain of 0.75 percent on volume of 7,581,577 shares, so the proxy confirmed the direction and slightly exceeded the magnitude of the futures move. Its 52-week high is 509.70 and its 52-week low 333.81, which reproduces the same picture the futures give of a market well off its highs. Call-side gamma reads negative at minus 317 million while put-side gamma reads positive at 198 million, and the share of gamma attributable to the next expiry is 23.50 percent. A positioning profile with negative call-side gamma is the configuration in which dealer hedging tends to amplify an upside move, which is a mild tailwind for the constructive case, and the modest next-expiry share means the near-dated options are not dominating the structure.
One data-quality note is recorded deliberately. The proxy's two volatility-point fields rendered inverted on this read, with the low volatility point at 500 sitting above the high volatility point at 410. Those two fields are treated as low confidence for this run and are excluded from the level structure entirely. No level in this outlook depends on them.
Night Session (6:00 PM ET Sunday to 3:00 AM ET Monday, Globex/Asia)
This is a Friday close, and the forecast addresses the Sunday reopen and the Monday session. Two full days of headline exposure separate Friday's 4,424.9 settlement from the first Monday print, and for gold that exposure includes a Chinese rate decision on Saturday evening as well as the unpriced Middle East reports described above, per the news-feed calendar captured for this run, unconfirmed against the verified forward calendar. Gap levels in both directions are given below.
The contract reopens at 6:00 PM ET Sunday. The Chinese one-year and five-year loan prime rates will already have been published at 9:00 PM ET Saturday, with calendar forecasts of 3 percent and 3.5 percent against previous values of 3.00 percent and 3.50 percent, per the news-feed calendar captured for this run, unconfirmed against the verified forward calendar. Asian hours are the natural window for any physical-demand response to that decision. Bias into the reopen is mildly constructive, carrying the reversal close and the K-above-D readings on both captured stochastic horizons.
Gap levels both ways. An upside gap through the session high at 4,439.8 and toward the first pivot resistance at 4,452.4 would extend Friday's reversal and open the 38.2 percent retracement from the 13-week high at 4,472.5. A downside gap beneath the session low at 4,372.2, which is effectively the second standard deviation support at 4,372.6, would negate the reversal and expose the third standard deviation support at 4,360.8. The 14-day average true range of 108.7 means a reopen anywhere between roughly 4,316.2 and 4,533.6 is within one average day of Friday's settlement.
London Session (3:00 AM to 8:00 AM ET Monday)
European hours give the first deep liquidity of the week for the metal. The European Central Bank's Kazimir speaks at 4:30 AM ET (per the news-feed calendar captured for this run, unconfirmed against the verified forward calendar), the only European item on the calendar captured for Monday. London is where the physical market and the futures curve usually reconcile after an Asian session, and the practical reference is the pivot point at 4,412.3: holding above it through European hours keeps the constructive read intact into the United States open, while losing it puts the 100-day average at 4,410.5 and the 4,397 to 4,385 entry zone in play early.
Morning Session (9:30 AM to 12:00 PM ET Monday, US Open)
The calendar captured for Monday contains no United States economic data release. The Federal Reserve's Goolsbee speaks at 6:30 AM ET, ahead of the cash open, and the Bank of Canada's Macklem speaks at 11:20 AM ET, per the news-feed calendar captured for this run, unconfirmed against the verified forward calendar. With no data anchor, the United States morning is likely to trade the dollar and the level map and not a catalyst.
The level map for this window is well defined. Overhead sit the session high at 4,439.8 and the first pivot resistance at 4,452.4 with the computed target price at 4,452.0 beside it. Beneath sit the pivot point at 4,412.3, the 100-day average at 4,410.5 and the three-value grouping at 4,387.9, 4,385.3 and 4,384.8. A session that opens inside 4,412.3 to 4,452.4 and holds it is consolidating Friday's reversal; a decisive move through either edge sets Monday's direction.
Afternoon Session (12:00 PM to 4:00 PM ET Monday)
The afternoon carries no United States auction or data set-piece on the captured calendar, and the Reserve Bank of Australia's Hunter speaks at 3:00 PM ET, per the news-feed calendar captured for this run, unconfirmed against the verified forward calendar. The practical note is that Tuesday's pivot ladder is recomputed from Monday's high, low and settlement together, so its direction cannot be inferred from Monday's close alone; the references that frame Monday's session are the first pivot resistance at 4,452.4 above and the session low at 4,372.2 beneath, with the one-month low at 4,273.3 the structural reference below that.
Night Session Forward (6:00 PM ET Monday)
Residual bias into the Monday evening reopen carries toward Tuesday's Federal Reserve speakers, with Williams at 10:05 AM ET, Jefferson at 10:20 AM ET and Barkin at 1:00 PM ET, and the two-year note auction at 1:00 PM ET, per the news-feed calendar captured for this run, unconfirmed against the verified forward calendar. The Reserve Bank of Australia's Bullock speaks at 11:10 PM ET, per the news-feed calendar captured for this run, unconfirmed against the verified forward calendar. For gold the auction matters: a weak two-year auction that pushes yields higher is a direct headwind, and a strong one is the reverse.
Expected Range (Monday Full Session)
Low-range scenario: the first pivot support at 4,384.8 to the first pivot resistance at 4,452.4, a width of 67.6, or 0.62 times the 14-day average daily range of 109.0
Mid-range scenario (most likely): Friday's low at 4,372.2 to the second pivot resistance at 4,479.9, a width of 107.7, essentially one 14-day average daily range
High-range scenario: the second pivot support at 4,344.7 to the third pivot resistance at 4,520.0, a width of 175.3, or 1.61 times the 14-day average daily range
Most Likely Path
The most likely path opens Monday near Friday's settlement, works back toward the pivot point at 4,412.3 and the 100-day average at 4,410.5 during Asian and European hours as the reversal is retested, finds buyers in the grouping where the one standard deviation support at 4,387.9, the 13-week 50 percent retracement at 4,385.3 and the first pivot support at 4,384.8 sit within 3.1 points, and recovers through the United States session toward the session high at 4,439.8 and the paired first pivot resistance and computed target price near 4,452. The alternative path, which the weekend exposure makes real, gaps beneath 4,372.2 at the Sunday reopen on a hawkish surprise or a firm dollar and never offers the pullback entry at the grouping. Scenario weightings in this outlook are analyst judgment and not derived frequencies.
Monday Economic Calendar
The week opens with a light calendar. The forward calendar captured for this run shows no United States economic data release scheduled for Monday, September 21, consistent with the weekly commentary published at 4:11 PM ET Friday describing the week ahead as a quiet calendar against fragile sentiment. Readers should treat that as what this run's calendar capture shows and not as an exhaustive claim about every possible release.
Working through the day in order: Asian hours carry the residue of the Chinese one-year and five-year loan prime rate decisions published at 9:00 PM ET Saturday, with calendar forecasts of 3 percent and 3.5 percent, per the news-feed calendar captured for this run, unconfirmed against the verified forward calendar. European morning brings the European Central Bank's Kazimir at 4:30 AM ET, per the news-feed calendar captured for this run, unconfirmed against the verified forward calendar. The United States morning has the Federal Reserve's Goolsbee at 6:30 AM ET ahead of the cash open, then the Bank of Canada's Macklem at 11:20 AM ET, per the news-feed calendar captured for this run, unconfirmed against the verified forward calendar. The afternoon carries no United States set-piece on the captured calendar; the Reserve Bank of Australia's Hunter speaks at 3:00 PM ET and Bullock at 11:10 PM ET, per the news-feed calendar captured for this run, unconfirmed against the verified forward calendar.
The single first-order event for gold is not on Monday. It is the grouping of events on Tuesday, September 22, when three Federal Reserve speakers and a two-year note auction all land, with Williams at 10:05 AM ET, Jefferson at 10:20 AM ET, Barkin at 1:00 PM ET and the auction at 1:00 PM ET carrying a previous high yield of 4.204 percent and a previous bid-to-cover of 2.600, per the news-feed calendar captured for this run, unconfirmed against the verified forward calendar. If the auction moves the front end, that is the most direct scheduled risk to the level map above; whether the dollar or the front end drove Friday's session was not captured and is not asserted.
Further out: Wednesday, September 23 brings United States flash purchasing managers indices at 9:45 AM ET and a five-year note auction, whose 1:00 PM ET time comes from the shared news-feed calendar capture in the NQ and ES packages and is unconfirmed against the verified forward calendar. Thursday, September 24 carries the Chinese state visit as an all-day item, the Swiss National Bank rate statement at 3:30 AM ET, initial jobless claims at 8:30 AM ET with a forecast of 206.5 thousand (previous 196 thousand per the NQ capture), and a seven-year note auction listed in the NQ and ES captures without a time, per the news-feed calendar captured for this run, unconfirmed against the verified forward calendar. Friday, September 25 brings durable goods at 8:30 AM ET, also on the verified forward calendar, and the final University of Michigan sentiment reading at 10:00 AM ET (per the news-feed calendar captured for this run, unconfirmed against the verified forward calendar); the previous inflation-expectation component was not captured. The next Federal Open Market Committee rate statement is October 28 at 2:00 PM ET, per the news-feed calendar captured for this run, unconfirmed against the verified forward calendar.
Primary Trade Setup
Direction: Long
Rationale: Friday produced a gap-down open that closed at 78.0 percent of the session range with a 43.3 point advance from the open, the settlement sits 12.6 above its own pivot point of 4,412.3, and percent K currently exceeds percent D on both captured stochastic horizons, the 9-day and the 14-day. Against a directional index of 16.42 with the two directional components separated by five hundredths of a point, this is a levels market, and the tightest level grouping available sits just beneath price.
Entry Zone: 4,385 to 4,397
Stop Loss: 4,358 (beneath the third standard deviation support at 4,360.8, which itself sits beneath Friday's session low at 4,372.2 and the effectively coincident second standard deviation support at 4,372.6)
Target 1 (T1): 4,440 (Friday's session high at 4,439.8)
Target 2 (T2): 4,452 (the computed target price at 4,452.0 and the first pivot resistance at 4,452.4, two independent references inside half a point)
Target 3 (T3, extended): 4,480 (the second pivot resistance at 4,479.9, grouped with the second standard deviation resistance at 4,477.2 and the 38.2 percent retracement from the 13-week high at 4,472.5, reached only if momentum extends through T2 on expanding volume)
Risk-to-Reward: Measured from the 4,391 midpoint of the entry zone against the 4,358 stop, risk is 33 points. Approximately 1:1.5 to T1, 1:1.8 to T2 and 1:2.7 to T3.
Invalidation: A settlement beneath 4,360.8, the third standard deviation support, takes out Friday's low and the second standard deviation band together and negates the reversal thesis. On an intraday basis, acceptance beneath 4,372.2 without prompt recovery is the working invalidation.
Stop distance versus volatility: The 33 point entry-to-stop distance is 30 percent of the 14-day average true range of 108.7, so this is a tight stop by this contract's standards, and the weekend gap exposure described above and the Saturday evening Chinese rate decision add to the mismatch between stop distance and volatility.
Macro override: Any of the following invalidates the setup in real time regardless of price: a hawkish surprise from the Federal Reserve speakers that pushes the front end higher; a weak two-year auction Tuesday (per the news-feed calendar captured for this run, unconfirmed against the verified forward calendar) that lifts yields materially; a decisive dollar advance; or a formal de-escalation in the Middle East that removes the residual haven premium. In the opposite direction, confirmed escalation following the post-settlement Jazan and Abha reports would gap the contract through the upside levels and remove the entry entirely.
Session-timing condition: The Sunday reopen at 6:00 PM ET carries two days of unpriced exposure including the Saturday evening Chinese rate decision, and pricing is likely to be disorderly through the first hours of Globex trade. The cash open at 9:30 AM ET Monday provides the session's first liquid directional test of the level map above.
Sources and methodology
This outlook is built from our session review of the December COMEX gold contract, GCZ26, the December '26 contract, prepared after Friday's close on September 18, 2026. Computed pivot levels come from Friday's session high, low and settlement as read from the daily bar, which the chart series reproduces on all five fields, and the daily bar does not time the low or the high, so no intraday path is asserted. The listed fund proxy is used as qualitative context only and is never converted into futures prices; it tracks bullion at roughly a one-to-eleven ratio with a management fee drag and carries no clean basis to the contract, and its two inverted volatility-point fields are excluded from the level structure. Indicator readings are limited to the values preserved for this session.
Scenario ranges are analyst judgment; they carry no calibration. Contract months are kept separate throughout. Scheduled items marked unconfirmed come from the news-feed calendar captured for this run and were not verified against the verified forward calendar. The dollar index level and its session change, digital-asset moves, the ten-year yield level, the weekly commitments component figures, central bank purchase figures and fund holdings data, the published moving-average crossing thresholds and the other-horizon true-range, daily-range, volatility, directional and stochastic readings were not captured in this run, and no figure is stated for any of them.
Thursday’s outlook for this contract is here. Outlooks for ES, NQ, GC and CL are collected on the market outlook page, and our forward trading record is on the performance statement.



