
Thursday's ten-year inflation-protected auction cleared at 1:00 PM ET with a high yield of 2.653 percent, up from 2.438 percent at the previous sale, and the bid-to-cover slipped to 2.240 from 2.300. Real rates rose. A day earlier the Federal Reserve had lifted its target range to 3.75 to 4.00 percent, the first increase since July 2023, on a unanimous vote, with twelve of eighteen officials projecting one more increase this year. The cash index closed at 7,635.65, up 1.11 percent.
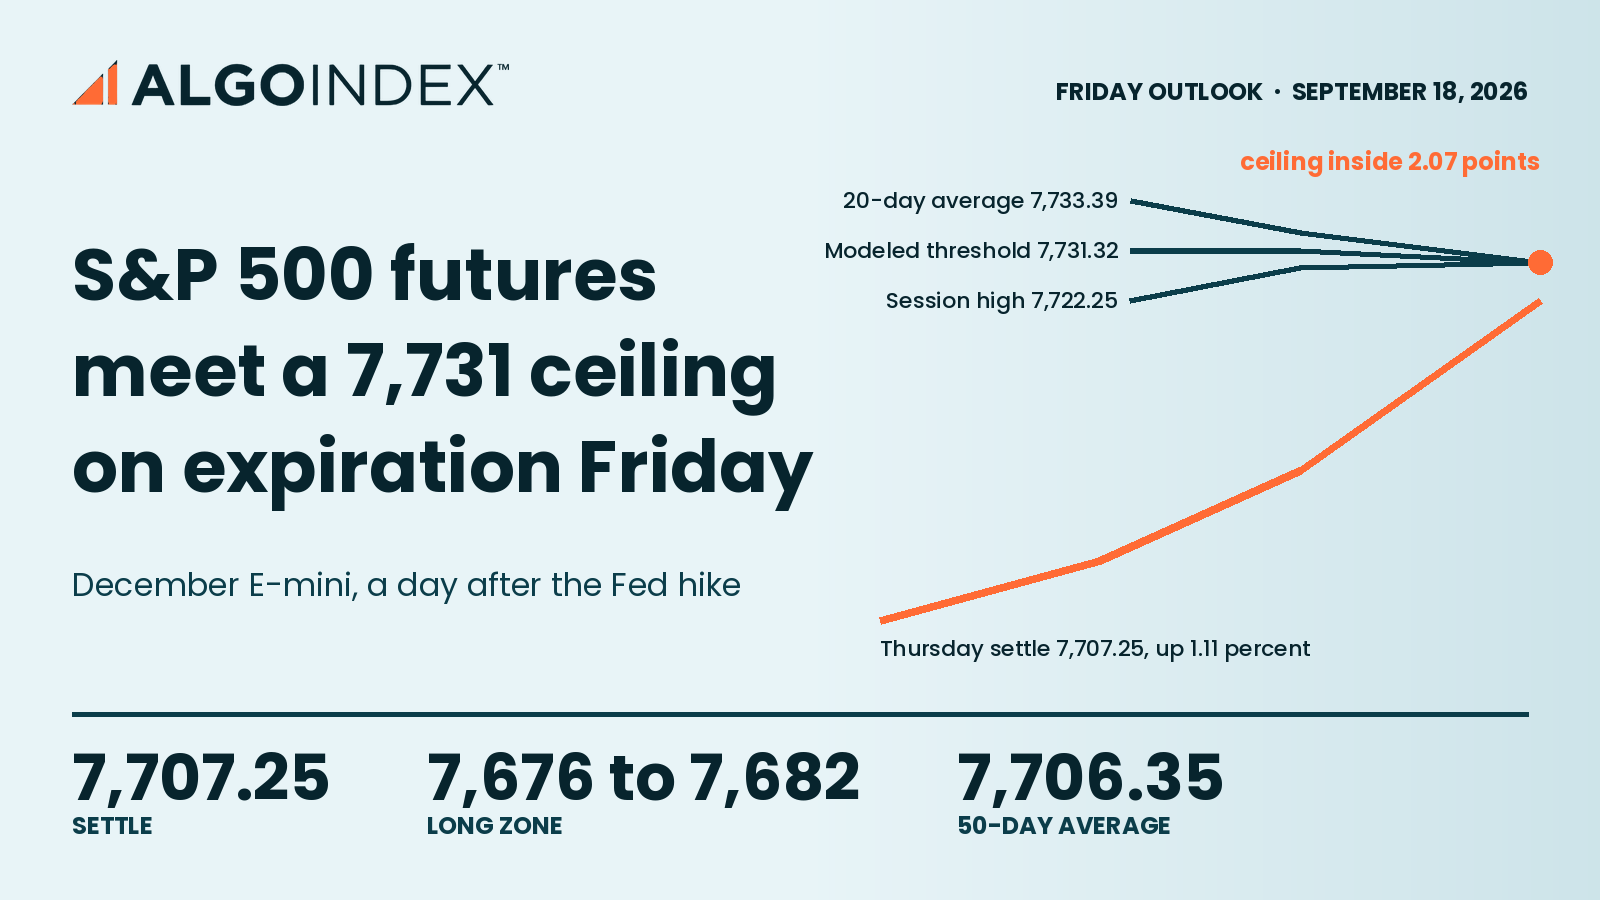
December E-mini futures settled at 7,707.25, up 84.25 points, after opening at 7,624.00, printing a low of 7,617.50 and a high of 7,722.25. The settlement landed 85.7 percent of the way up a 104.75 point range and 0.90 points above the 50-day average at 7,706.35. In the reopened evening session the contract traded 7,697.00 to 7,704.25 on 5,305 contracts and sat near 7,698. Friday's first question sits 33 points higher, where the 20-day average at 7,733.39 and a modeled volatility threshold at 7,731.32 converge inside 2.07 points.
December S&P 500 futures settled at 7,707.25, up 1.11 percent, a day after the Fed hike, as crude's decline eased the inflation path. Resistance starts at the 7,722.25 session high and thickens at 7,731 to 7,733, with the first pivot resistance at 7,747.17. Support begins at the 50-day average, 7,706.35, and the 7,676 to 7,682 band where the 5-day average and the pivot point sit 6.28 points apart. The primary setup is a long from 7,676 to 7,682, stop 7,640, targets 7,722, 7,747 and 7,787, at half size because Friday is the September quarterly expiration, carried in the options positioning data rather than a verified calendar and unconfirmed.
The short that filled and never paid
Thursday's outlook set a short from 7,690 to 7,698 with a stop at 7,738 and a first target at 7,632.33. The zone filled. Thursday's high reached 7,722.25, the stop at 7,738 was never touched, and the settlement at 7,707.25 left the position nine to seventeen points under water with no target reached. We record that plainly. A rally of 1.11 percent two days after the most hawkish monetary event of the year was not the base case, and the reason it happened matters more than the miss.
Crude did the work. November WTI washed out 3.41 percent to 94.42 and settled at 97.23, and the drop in oil eased the expected inflation path enough for stocks and bonds to rally together. The ten-year nominal yield sat near 4.950, essentially unchanged, while the dollar index held near 100.238 in evening trade, down 0.10 percent but keeping nearly all of its post-decision gains. Equities followed the inflation path. That combination only appears when the inflation component is doing the moving.
Two ceilings inside two points
Three references sit between 7,722 and 7,734. Thursday's high is 7,722.25. The modeled volatility threshold published by the options positioning data is 7,731.32 in futures terms, 7,660 in cash. The 20-day average is 7,733.39. Two independent methods identifying the same ceiling inside 2.07 points is the most actionable confluence on the board, and the reopened session stopped 27 points beneath it.
Above that band the map opens. The first pivot resistance is 7,747.17, the second 7,787.08, and the one-month high at 7,850.75 sits 1.17 points beneath the third pivot resistance at 7,851.92. The futures contract's 52-week and 13-week high is 7,905.00, 2.57 percent above the settlement; the cash index's own 52-week high is 7,816.70. A call-side hedging boundary is published at 8,100 in cash terms, far from current trade.
Beneath price the structure is dense. The 50-day average at 7,706.35 is the first reference of any kind. Then comes the 7,676 to 7,682 band, with the cash 7,500 strike, roughly 7,572 in December futures at the measured basis, far beneath it: the pivot point at 7,682.33 and the 5-day average at 7,676.05, 6.28 points apart. The first pivot support at 7,642.42 marks invalidation. Below it the 100-day average at 7,633.51 and the modeled gamma-flip level at 7,635.32 sit 1.81 points apart, a second high-quality confluence and the line beneath which the larger picture changes. Thursday's low is 7,617.50. The second pivot support at 7,577.58 and the primary gamma concentration at 7,571.32, which is the cash 7,500 strike, sit 6.26 points apart, and the third pivot support is 7,537.67.
Flow that was absorbed
The internal evidence is more mixed than the headline. Roughly ten billion dollars of negative index delta flow crossed during the day, a mix of zero-day put buying and zero-day call selling, including about twenty thousand customer-bought 7,550 puts opened near 10:00 AM ET. That implies net market-maker selling pressure. The index closed higher anyway. Because the flow was zero-day expiry, it expired at Thursday's close and supplies no inventory for Friday.
Single stocks told a different story. About three billion dollars of positive delta flow came from longer-dated call buying, more than half of it in the mega-capitalisation complex. The market hedged the index for the day and bought individual companies for the medium term. Semiconductors led with the sector fund up 3.4 percent against the technology fund's 1.7 percent, the conventional risk-on ordering. Consumer sentiment read 29 out of 100 at 10:18 AM ET, in the fear band, on a day the index gained more than a percent, which usually means a rally is not yet trusted.
Volatility reset hard. The volatility index fell 12.81 percent to close near 15.45 and its companion index closed at 88, down 8 percent. Fixed-strike volatility declined two to three points as the event premium came out. The volatility index's percentage move ran more than five times the index's, so a large share of Thursday's gain came from volatility compression. Dealer positioning is net negative: a gamma index of negative 3.02, a gamma tilt of 0.833 and gamma notional of negative 610.377 million dollars. Hedging flows will push in the direction price is already moving. Index option volume ran 850,896 calls against 1,245,000 puts, open interest 10.775 million calls against 15.153 million puts, and December futures open interest stands at 1,875,619 contracts against 565,329 in the expiring September contract.
The trade map for Friday
The primary setup is a long from 7,676 to 7,682 on a pullback into the band where the 5-day average and the pivot point converge. The stop is 7,640, beneath the first pivot support at 7,642.42. The first target is 7,722, Thursday's high; the second 7,747, the first pivot resistance; the third 7,787, the second pivot resistance, only on momentum through the second.
From the 7,679 midpoint the risk is 39 points. The first target returns 43 points, about 1.1 times that risk, the second 68 points or 1.7 times, and the third 108 points or 2.8 times. Filled at the top of the zone, the first target pays 40 points against 42 of risk, so an entry near 7,682 does not clear one unit of risk on the first objective. The position runs at half a normal allocation. Friday is, per the options positioning data rather than a verified calendar and unconfirmed, the September quarterly expiration, with roughly twenty percent of listed US options expiring or rolling and a delta-notional total set to exceed June's record. With negative dealer gamma, a directional impulse from that expiration can carry price through the entry zone or the stop without regard to the levels.
The indicators argue for patience. The 14-day relative strength index is 48.19. The 14-day stochastic reads 38.07 percent on the fast line against 25.56 on the slow, in the lower half of the range. The 14-day directional index is 16.51 with negative direction at 24.54 against positive at 14.64, and the 9-day reads 25.41 with negative direction at 25.55 against 12.63, better than two to one. The short-horizon trend system still says downtrend after a session that closed up 1.11 percent. That is the largest unresolved tension in the data. The multi-indicator composite is a 16 percent sell at minimum strength, and 14-day historic volatility is 9.75 percent, the lowest reading in the four-instrument set.
Friday's slate is light. Industrial production and capacity utilisation print at 9:15 AM ET, the one verified Friday entry, expected at 0.3 percent and 76.4 percent. Two speakers follow. Federal Reserve commentary from Bowman at 9:30 AM ET and Schmid at 11:45 AM ET is carried on the news calendar only and unconfirmed against a primary source; it would be the first official comment since the increase. Overnight, Japanese inflation at 7:30 PM ET and a Bank of Japan decision at 11:30 PM ET, expected to lift the rate to 1.25 percent from 1.00 percent, are likewise unconfirmed. Thursday's data ran hot. Initial claims printed at 196,000 against 206,500 expected, the Philadelphia index 37.8 against 32.1, housing starts 1.275 million, permits 1.394 million and pending home sales up 0.3 percent.
Scenario ranges are analyst judgment. The low-range case runs 7,680 to 7,745, the most likely case 7,665 to 7,760, and the high-range case 7,600 to 7,830, against a one-ATR envelope of 7,635.48 to 7,779.02 on a 71.77 point average true range. The at-the-money implied volatility for Friday's expiration is 13.8 percent, implying roughly 86 basis points of movement, closer to the realised 0.93 percent average range than the published 0.46 percent one-day move. The most likely path opens near 7,698, tests 7,731 to 7,733 and resolves the session on that test. Acceptance opens 7,747.17 and 7,787.08; rejection turns price back to 7,676 to 7,682, where the setup activates. Roughly one time in five, the expiration decides the direction on its own and the outer markers are 7,577 and 7,787.
The 4:00 PM ET close, into which the expiring index open interest settles, is where Friday will be decided.
The complete data picture
Every number behind Friday’s plan, charted first, then the full level map, then the complete numeric reference underneath.
Full numeric reference, every remaining figure from the session review
Level notes
7,722.25 (SPX 7,650.65) is Thursday's session high and the immediate ceiling, 15.00 points above the settlement.
7,731.32 (SPX 7,660) is the published modeled volatility threshold, quoted here as the published futures and cash pair. That pair carries the published fixed offset rather than the basis measured for this session.
7,733.39 (SPX 7,661.79) is the 20-day moving average, sitting 2.07 points above the modeled volatility threshold. The 7,731 to 7,733 band is the densest resistance on the board and the level that defines Friday's upside.
7,747.17 (SPX 7,675.57) is the first pivot resistance, computed from Thursday's verified session bar, and the primary upside objective.
7,787.08 (SPX 7,715.48) is the second pivot resistance, the extended objective, roughly 1.1 average ranges above the settlement.
7,850.75 (SPX 7,779.15) is the 1-month high, and 7,851.92 (SPX 7,780.32) is the third pivot resistance. Those two sit within 1.17 points of one another, making the band the most substantial structural resistance above the immediate zone.
7,905.00 is both the 52-week high and the 13-week high on the futures contract, 2.57 percent above the settlement.
8,171.32 (SPX 8,100) is the published call-side hedging boundary, quoted as its own pair and far above current trade.
7,706.35 (SPX 7,634.75) is the 50-day moving average, 0.90 points beneath the settlement and the first reference of any kind below price.
7,682.33 (SPX 7,610.73) is the pivot point from Thursday's verified bar and the upper edge of the primary entry zone.
7,676.05 (SPX 7,604.45) is the 5-day moving average, completing a tight two-way confluence with the pivot point inside 6.28 points. This 7,676 to 7,682 band is the entry zone for the primary setup.
7,642.42 (SPX 7,570.82) is the first pivot support and the invalidation reference for the setup.
7,635.32 (SPX 7,564) is the published modeled gamma-flip level, quoted as its own published pair.
7,633.51 (SPX 7,561.91) is the 100-day moving average, sitting within 1.81 points of that modeled gamma-flip level.
7,617.50 (SPX 7,545.90) is Thursday's session low, 6.50 points beneath the open and 89.75 points beneath the settlement.
7,577.58 (SPX 7,505.98) is the second pivot support, and 7,571.32 (SPX 7,500) is the published primary gamma concentration and put-side hedging boundary, the two sitting within 6.26 points. Both align with the cash 7,500 strike, which the data publishes as its primary gamma concentration and put-side hedging boundary.
7,537.67 (SPX 7,466.07) is the third pivot support, the deepest level with mechanical basis for Friday.
2.1 Intraday and Session Review
December opened at 7,624.00, just 1.00 point above the prior settlement of 7,623.00. The futures contract did not gap: it trades through the overnight session and simply began the day flat. Its session low printed at 7,617.50, 6.50 points beneath the open, and its high at 7,722.25; it settled at 7,707.25, some 15.00 points off the high, for a gain of 84.25 points.
The distinction between the two instruments matters and is easy to get wrong. The prior cash close was 7,551.81. The futures contract carried the same move across its overnight session, which is why its open sits flat against its own prior settlement.
The close quality is constructive. A settlement 85.7 percent of the way up the range, with the low just 6.50 points beneath the open, indicates the advance was accepted rather than faded. Sessions of this shape more often continue than reverse, with the qualification that this one terminated just beneath a dense band of overhead structure.
The reopened Globex session that began at 6:00 PM ET has traded 7,697.00 to 7,704.25 and sits near 7,698, roughly 9 points beneath the Thursday settlement on thin volume of 5,305 contracts. The contract enters Friday essentially flat against its settlement.
2.2 Daily Structure
The daily structure is an uptrend consolidating near its highs. The 52-week high and the 13-week high on the futures contract are both 7,905.00, with the settlement 2.50 percent beneath that high and the high 2.57 percent above the settlement. The 1-month high is 7,850.75 and the 52-week low is 6,466.00, which the settlement stands 19.20 percent above. The index has spent the month working sideways between roughly 7,600 and 7,850 in futures terms.
The five-day change of negative 26.00 points, or 0.34 percent, is the most instructive single figure here. Despite Thursday's 84.25 point advance, the week is still net lower. Thursday recovered the week rather than extending it, which is the same pattern the Nasdaq contract displayed and is consistent with a market that has been chopping rather than trending.
The settlement's position relative to the 50-day average deserves emphasis. At 7,707.25 against an average of 7,706.35, the contract closed 0.90 points above it. A settlement that lands within one point of a major average after an 84 point advance is a coincidence worth noting rather than reading, but it does mean the 50-day average is now the immediate reference beneath price.
2.3 4-Hour and Swing Structure
The swing sequence is a higher low against a lower high on the monthly view. Thursday's 7,617.50 low is well above the levels that defined the early part of the month, while the 7,850.75 one-month high remains 143.50 points above the settlement. The structure is a compression, and Friday's expiration is the most likely candidate to resolve it.
The daily candle is a large bullish trend bar: a 104.75 point range, a low 6.50 points beneath the open, a settlement 15.00 points beneath the high, and a body that covers most of the range. The 14-day average true range is 71.77 points, so Thursday's range exceeded the recent norm by 32.98 points, or about 46 percent more than a typical session.
2.4 Moving Averages
The stack is compressed and interleaved, which matches the choppy character the trend indicators describe. The settlement at 7,707.25 sits above the 5-day average at 7,676.05 by 31.20 points, above the 50-day at 7,706.35 by 0.90 points, above the 100-day at 7,633.51 by 73.74 points and far above the 200-day at 7,324.28 by 382.97 points. It sits below only the 20-day average at 7,733.39, by 26.14 points.
The 20-day average above and the 50-day average directly beneath, separated by just 27.04 points, form a narrow band that Friday's session will almost certainly trade through. Beneath that, the 100-day average at 7,633.51 is notable for a different reason: it sits within 1.81 points of the published modeled gamma-flip level at 7,635.32 in futures terms. A moving average and a modeled positioning threshold converging inside two points is a second high-quality confluence, and it marks the level beneath which the structural picture would change.
As with the other instruments, the published period change columns report price change across each period rather than distance from the average.
2.5 Oscillator and Trend Readings
The directional system carries the clearest warning in this outlook. The 14-day average directional index reads 16.51, beneath the trend threshold, but negative direction at 24.54 is well above positive direction at 14.64. More striking, the 9-day average directional index reads 25.41, which is above the trend threshold, with negative direction at 25.55 against positive direction at 12.63, a ratio of better than two to one. In plain terms, the short-horizon trend system is signalling a genuine downtrend even though Thursday closed up 1.11 percent. That divergence between a strong daily candle and a negative short-horizon directional reading is the single most important unresolved tension in this outlook.
The multi-indicator composite reads 16 percent sell at minimum strength, identical to the Nasdaq and gold readings.
2.6 Volatility and Expected Range
The 14-day average true range is 71.77 points, or 0.93 percent of the settlement, and the 14-day average daily range is 71.98 points, also 0.93 percent.
A one average-true-range day from the 7,707.25 settlement spans 7,635.48 to 7,779.02. Two independent forward-looking estimates are available and they differ meaningfully. The options positioning data publishes an implied one-day move of 0.46 percent with a band of 7,608.79 to 7,679.11 in cash terms, while the same source's note gives an at-the-money implied volatility of 13.8 percent for Friday's expiration, implying roughly 86 basis points of intraday movement. The second figure is the expiration-specific read and is closer to the realised 0.93 percent average range, so it is the more appropriate planning number for a triple-witching session.
4.1 Dollar, Rates, and Fed Policy
The Federal Reserve raised its target range 25 basis points to 3.75 to 4.00 percent on Wednesday, the first increase since July 2023, unanimously and with no dissents. The projections were more hawkish than the decision: twelve of eighteen officials expect one further increase this year, four expect two, two expect none, and no cut is projected for next year. A sixteen-to-two majority projected at least one more increase in 2026.
Thursday's market response was the opposite of the conventional reaction, and understanding why matters for Friday. The ten-year inflation-protected auction at 1:00 PM ET cleared at a 2.653 percent high yield against 2.438 percent previously with cover slipping to 2.240 from 2.300, so the real rate rose materially. Yet the index gained 1.11 percent. The reconciling factor is crude: with the November contract settling at 97.23 after a 3.41 percent intraday washout, the expected inflation path eased enough that the market could price a lower terminal rate despite a higher current one. Equities and bonds rallied together, which only happens when the inflation component rather than the growth component is doing the work.
The dollar index sat near 100.238 in evening trade after the 4:00 PM ET equity close, down 0.10 percent but holding nearly all of its post-decision gains after setting a fresh one-and-a-half month high, while the euro broke lower as the two-year swap differential widened 15 basis points to its widest since July. The ten-year nominal yield was near 4.950, essentially unchanged. The news calendar carries Federal Reserve Governor Bowman at 9:30 AM ET Friday and Schmid at 11:45 AM ET, which would be the first official commentary since the decision; neither appears in the verified calendar, so both times are unconfirmed.
4.2 Large-Cap Leadership and Earnings
Single-stock delta flow ran about three billion dollars positive, driven by longer-dated call buying with more than half originating in the mega-capitalisation complex. The reasoning offered alongside it is that these companies carry the fundamentals and balance sheets to perform in a higher-rate environment, which is a coherent thesis for owning them into a tightening cycle rather than despite one.
Semiconductors led the session with the sector fund gaining 3.4 percent against the technology index fund's 1.7 percent, and that two-to-one leadership ratio from the highest-beta part of the market is the signature of genuine risk appetite rather than defensive positioning.
4.3 Geopolitical Backdrop
The geopolitical situation is active and transmits to the index through crude rather than directly. A Saudi pipeline remains largely out of service with repairs estimated at three to five weeks, a maritime security incident was reported in the Strait of Hormuz at 3:30 PM ET, Israel's prime minister called at 3:51 PM ET for toppling the Iranian government, and US officials were confirmed to have met the Houthis in Oman over the weekend while China was reported to have privately asked Iran to help rein in that group at 7:58 AM ET.
Conversely, an escalation that lifts crude reverses the inflation-path relief that produced Thursday's rally. The index's Middle East exposure is therefore an overnight and weekend risk carried through the oil price, not an intraday equity risk.
The news feed carries a state visit by China's president to the United States beginning September 24, a date absent from the verified calendar and therefore unconfirmed, with several technology chief executives reported as attending the associated state dinner.
4.4 Sector Breadth and Rotation
What is available is sector-level leadership, and it is unambiguous: semiconductors at 3.4 percent led the technology index fund at 1.7 percent, which in turn led the broad index at 1.11 percent. That descending ladder from highest-beta sector to broad index is the conventional risk-on ordering.
One notable divergence is worth recording. The consumer sentiment gauge read 29 out of 100 at 10:18 AM ET, placing it in the fear band, on a session when the index gained more than a percent and the volatility index fell nearly 13 percent. Sentiment readings in the fear band alongside a strong advance usually indicate the rally is not yet trusted, which is a mildly contrarian positive.
4.5 Cross-Asset and Volatility
The volatility complex reset hard. Down 12.81 percent on the day, the volatility index closed near 15.45, and the index of volatility-of-volatility closed at 88, down 8 percent.
The at-the-money implied volatility for Friday's expiration is 13.8 percent, implying roughly 86 basis points of intraday movement. Money-market fund assets were reported at 7.92 trillion dollars at 3:33 PM ET, a large reserve of sidelined cash that has been a standing structural support for the index all year.
Crude's November contract settled at 97.23, gold's December contract at 4,399.7, and the dollar index near 100.238 in evening trade after the 4:00 PM ET equity close. Crude is the independent variable in this system at present, and the equity market's direction on Friday is partly a function of where it trades.
4.6 Institutional Positioning
Dealer positioning is net negative and therefore amplifying. Negative dealer gamma means hedging flows push in the direction price is already moving, which raises the realised range on any directional impulse. Of the six instruments in the published table, only the technology index carries positive gamma notional.
The 25-delta risk reversal reads negative 0.056, indicating puts bid over calls in relative terms. Index option volume ran 850,896 calls against 1,245,000 puts, and open interest stands at 10.775 million calls against 15.153 million puts, so the standing book is materially put-heavy. December futures open interest is 1,875,619 contracts against 565,329 in the expiring September contract.
The day's flow was the most informative element. Roughly twenty thousand customer-bought 7,550 puts in zero-day expiry opened near 10:00 AM ET, contributing to about ten billion dollars of negative index delta flow composed of zero-day put buying and zero-day call selling. Flow of that shape is tactical rather than positional, and because it was zero-day expiry it expired at Thursday's close, so it supplies no Friday expiration inventory.
Options positioning context
That check matters because every level in the table is computed against that reference.
The source's published levels, quoted as its own futures and cash pairs and carrying its fixed offset rather than the basis measured for this session, are a modeled volatility threshold at 7,731.32 and 7,660, a primary gamma concentration at 7,571.32 and 7,500, a call-side hedging boundary at 8,171.32 and 8,100, a put-side hedging boundary at 7,571.32 and 7,500, and a modeled gamma-flip level at 7,635.32 and 7,564. The two modeled thresholds are model outputs rather than listed strikes and are labelled accordingly; the gamma concentration and the two hedging boundaries sit on listed strikes.
The cash close of 7,635.65 therefore sits above the modeled gamma-flip level at 7,564 and above the gamma concentration at 7,500, but 24.35 points beneath the modeled volatility threshold at 7,660. Reclaiming that threshold is the condition the data associates with a more stable upside environment.
Call gamma reads 5 billion against put gamma of negative 2.8 billion, with next-expiry gamma at 6.01 percent. Stock volume was 2,943,402,766.
Friday's at-the-money implied volatility for the expiration is 13.8 percent, implying roughly 86 basis points of intraday movement.
Night Session (6:00 PM ET Thursday to 3:00 AM ET Friday, Globex/Asia)
Neutral drift with a genuine overnight catalyst. The reopened session has held 7,697.00 to 7,704.25 and sits near 7,698, essentially flat against the settlement. The news calendar carries Japanese inflation at 7:30 PM ET with headline expected at 2.0 percent and core at 1.8 percent, and the Bank of Japan decision at 11:30 PM ET on a tentative statement time with consensus expecting an increase to 1.25 percent from 1.00 percent; neither appears in the verified calendar, so both dates and clocks are unconfirmed. A second major central bank tightening in the same week lifts global term premium and firms the yen, both mild headwinds for equity risk. Expected Globex range 7,660 to 7,740.
London Session (3:00 AM to 8:00 AM ET Friday)
European hours are typically quiet for this contract, and Friday's European data is second-tier: the news calendar carries UK retail sales and German producer prices at 2:00 AM ET just ahead of the window, and euro-area inflation expectations at 4:00 AM ET, none of which appears in the verified calendar, so the times are unconfirmed. The material feature of this window on an expiration Friday is early rolling activity in index products, which can move price without conveying direction. The band to monitor is 7,676 to 7,682. Expected range 7,670 to 7,735.
Morning Session (9:30 AM to 12:00 PM ET Friday, RTH Open)
The cash open at 9:30 AM ET sets the session's first directional test, and it carries more weight than usual because the September quarterly expiration, carried in the options positioning data rather than a verified calendar and unconfirmed, settles into it. Industrial production and capacity utilisation, the one Friday entry in the verified calendar, print at 9:15 AM ET, expected at 0.3 percent and 76.4 percent on the news-feed consensus. The news calendar carries Federal Reserve Governor Bowman at 9:30 AM ET, which would coincide with the open, and Schmid at 11:45 AM ET; neither appears in the verified calendar, so both times are unconfirmed. The level map is the 7,731 to 7,733 band as the decision zone, 7,722.25 as the immediate ceiling beneath it, and the 7,676 to 7,682 band as support. With dealer gamma net negative, any directional impulse through those bands is likely to extend further than the compressed 9.75 percent historic volatility would suggest.
Afternoon Session (12:00 PM to 4:00 PM ET Friday)
The afternoon belongs to the expiration. Per the options positioning data rather than a verified calendar, and unconfirmed against a primary source, roughly twenty percent of all listed US options expire or roll, and in delta-notional terms this September expiration is set to surpass June's record. Large institutional rolls and position closures concentrate between 2:00 PM ET and the 4:00 PM ET cash close, into which the expiring index open interest settles. Negative dealer gamma argues for a wider close than usual, and position sizing should reflect that the final two hours can move independently of the day's established direction.
Night Session Forward (Sunday 6:00 PM ET reopen)
The Sunday 6:00 PM ET reopen follows the expiration, and post-expiration reopens often move more freely because the pinning effect of expiring open interest has been removed. Weekend exposure runs through crude and the Middle East on the chain described in section 4.3, with roughly 49 hours of unhedged time.
Expected Range (Friday Full Session)
Low-range scenario: 7,680 to 7,745
Mid-range scenario (most likely): 7,665 to 7,760
High-range scenario: 7,600 to 7,830
Most Likely Path
The most probable Friday path opens near 7,698, works toward the 7,731 to 7,733 band where the 20-day average and the modeled volatility threshold converge, and resolves the session on that test. Acceptance above it opens the first pivot resistance at 7,747.17 and then the second pivot resistance at 7,787.08, with the 7,850 to 7,852 band where the one-month high and the third pivot resistance converge as the extended objective. Rejection turns the session back toward the 7,676 to 7,682 confluence, which is where the primary setup activates, and a failure there puts the 7,633 to 7,635 band into play, where the 100-day average and the modeled gamma-flip level sit within 1.81 points. The lower-likelihood path, roughly one in five, is an expiration-driven dislocation that trades to whichever side the largest rolls push it, in which case negative dealer gamma amplifies the move and the outer markers are the 7,577 area below and 7,787 above.
Friday Economic Calendar
Friday's scheduled slate is light, and the session's defining event is structural rather than economic.
The overnight block comes entirely from the news calendar, is absent from the verified calendar, and is therefore unconfirmed. It opens with Japanese inflation at 7:30 PM ET Thursday, headline expected at 2.0 percent against 1.9 percent prior and core at 1.8 percent, with Australia's central bank governor carried at the same hour. The Bank of Japan decision, carried at 11:30 PM ET on a tentative statement time, is expected on the feed's consensus to raise the rate to 1.25 percent from 1.00 percent, and it is the most consequential scheduled item before the US open because it lifts global term premium at the margin.
European hours bring UK retail sales, UK core retail sales and German producer prices at 2:00 AM ET, followed by euro-area inflation expectations at 4:00 AM ET, all on the same unconfirmed news-feed basis. None is a direct input to this index.
The US session brings industrial production and capacity utilisation at 9:15 AM ET, the one Friday entry in the verified calendar, expected at 0.3 percent and 76.4 percent respectively on the news-feed consensus, then, on the news calendar only and unconfirmed against a primary source, Federal Reserve Governor Bowman at 9:30 AM ET and Schmid at 11:45 AM ET. Those two would be the first official comments since Wednesday's increase, and with the projection set showing twelve of eighteen officials expecting one more increase this year, any refinement of that path is the identifiable scheduled risk of the session.
The single first-order event for this index on Friday does not appear on the verified calendar. It is the September quarterly expiration, carried in the options positioning data and unconfirmed, in which roughly twenty percent of total US options expire or roll and whose delta-notional total is set to exceed June's record. With dealer gamma net negative at negative 610.377 million dollars of notional, the expiration is both the largest source of flow and the largest source of amplification available on the session.
For context on what has already happened, Thursday's completed US prints were initial jobless claims at 196,000 against a 206,500 forecast, the Philadelphia manufacturing index at 37.8 against 32.1 expected, housing starts at 1.275 million against 1.32 million, building permits at 1.394 million against 1.408 million, and pending home sales at positive 0.3 percent against negative 0.1 percent expected. The labour market print was the standout, and a claims figure that strong is not obviously compatible with a central bank that has finished tightening.
Beyond Friday, the verified calendar carries several US releases on September 24, including the quarterly international transactions report, new residential sales and the dealer financing survey, and durable goods orders on September 25. The news calendar adds global flash purchasing-manager surveys and a five-year note auction on September 23, the Chinese state visit beginning September 24, final consumer sentiment on September 25, the rate decision on October 28 and the midterm elections on November 3; none of those appears in the verified calendar, which covers through October 21, so they are unconfirmed.
Primary Trade Setup
Direction: Long
Rationale: Thursday's bar settled 85.7 percent up its range with the low just 6.50 points beneath the open, while roughly ten billion dollars of negative index delta flow was absorbed without breaking the advance. The 5-day average and the pivot point converge inside 6.28 points to form a tight, well-defined support band to work against.
Entry Zone: 7,676 to 7,682 (SPX 7,604 to 7,611)
Stop Loss: 7,640, beneath the first pivot support at 7,642.42
Target 1 (T1): 7,722 (the session high at 7,722.25, SPX 7,651)
Target 2 (T2): 7,747 (the first pivot resistance at 7,747.17, SPX 7,676)
Target 3 (T3, extended): 7,787 (the second pivot resistance at 7,787.08, SPX 7,715, only on momentum extension through T2)
Risk-to-Reward: Approximately 1:1.1 to T1, 1:1.7 to T2, 1:2.8 to T3 from the midpoint of the entry zone. Filled at the top of the zone the ratio to T1 falls to 0.95, so an entry near 7,682 does not clear one unit of risk on the first objective
Invalidation: A decisive break beneath 7,640 negates the thesis.
Macro override: The expiration is the dominant risk and it cuts both ways. With dealer gamma net negative, a directional impulse from the largest delta-notional expiration on record can carry price through either the entry zone or the stop without regard to the technical structure, so this setup should be sized at half a normal allocation. Hawkish commentary from Bowman or Schmid, carried on the news calendar at 9:30 AM ET and 11:45 AM ET and unconfirmed against the verified calendar, that lifts the expected rate path would work against the long directly, as would a Bank of Japan increase, carried on the news calendar at 11:30 PM ET on a tentative statement time and unconfirmed against the verified calendar, that lifts global term premium sharply. In the other direction, a further decline in crude extends exactly the inflation-path relief that produced Thursday's advance and would most likely carry the index through the 7,731 to 7,733 band without offering the entry zone at all.
Sources and methodology
This outlook is built from our session review of the December E-mini S&P 500 contract, prepared after Thursday's close on September 17, 2026. Computed pivot levels come from Thursday's session high, low and settlement as read from the daily bar. Every cash-index equivalent computed by us uses one measured basis of 71.60 points, the 7,707.25 settlement less the 7,635.65 cash close; where the options positioning data publishes its own futures and cash pair, that pair is quoted as published and carries its fixed 71.32 offset. The daily bar does not time the low or the high, and no intraday path is asserted. Closing figures for the S&P 500, the Nasdaq-100, the volatility index, crude and gold were checked against published closing data.
Scenario ranges are analyst judgment; they are not statistically derived and carry no calibration. Contract months are kept separate throughout. Scheduled items marked unconfirmed come from a news calendar and were not verified against a primary source.
Thursday’s outlook for this contract is here. Outlooks for ES, NQ, GC and CL are collected on the market outlook page, and our forward trading record is on the performance statement.



