
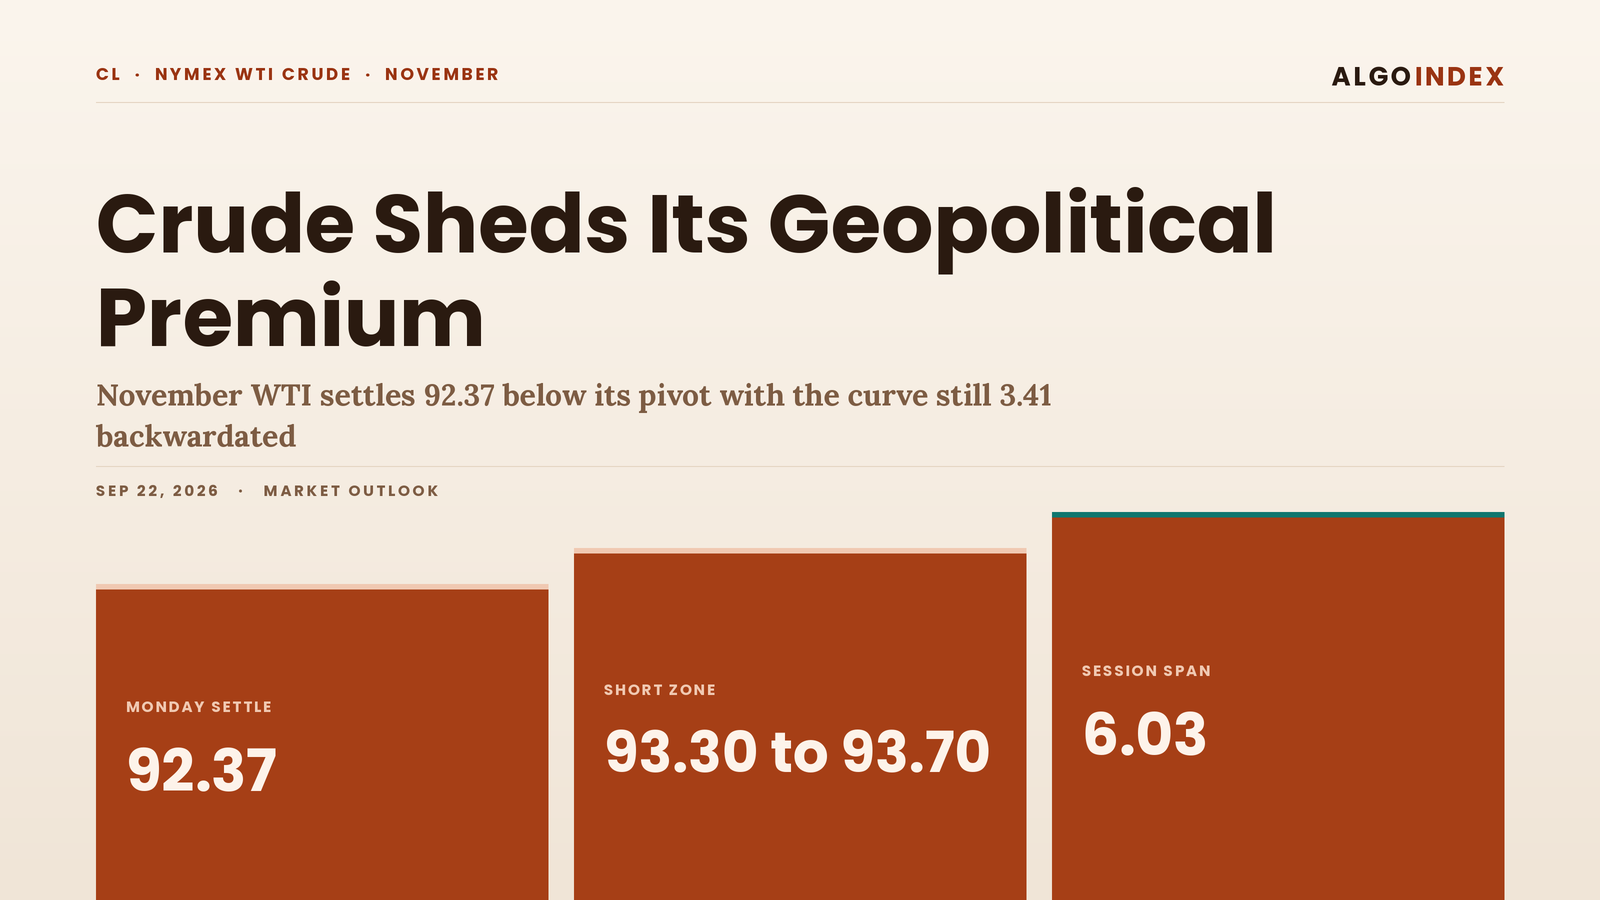
At 03:30 PM ET Libya's national oil company reported that an armed group had closed a valve on the Sharara pipeline to the Zawiya port, cutting output at that field. Crude barely flinched. The November contract had already surrendered a 6.03 dollar range, running from 97.22 down to 91.19 and settling at 92.37, roughly 6.5 percent of the settlement price traded away in a single completed session, with the close parked in the lower fifth of that span at 19.6 percent of it. A field going offline landed on that price and could not lift it.
That refusal to bid a live supply interruption is the most useful thing Monday produced, and it explains why this outlook leans lower. What pushed crude down was diplomacy. Iran's foreign minister arrived in New York for the United Nations General Assembly at 04:14 PM ET, Qatar said at 03:02 PM ET that it was working to facilitate an agreement between Iran and the United States even on a short-term basis, and a United States proposal of a five billion dollar fund to rebuild Gulf energy sites was reported at 03:11 PM ET. Separate commentary put crude and liquefied natural gas flows through the Strait of Hormuz over the prior two weeks at a six-month high. The chokepoint was busy. A market that had been paying for an interruption was handed evidence the interruption was not arriving at the feared scale.
One piece of housekeeping governs every number below. The expiring October contract comes off the board on Tuesday, September 22, and it is the contract behind the headline settle of 95.78, down 4.52 dollars or 4.51 percent. November is the tradable month, with 313,311 contracts of open interest against October's 60,372, and it settled at 92.37. The 3.41 dollars between them is backwardation, the curve paying up for prompt barrels, and it survived the whole decline. Brent settled at 100.34, down 3.53 dollars or 3.4 percent.
November WTI settled at 92.37 after a 6.03 dollar range, 1.22 dollars beneath its own 93.59 Pivot Point and 1.84 dollars beneath the 94.21 session midpoint, on a reassessment of supply risk. Demand was not the driver. The pivot is lost. Overhead the ladder runs 92.85, the 93.59 pivot, the 95.39 one standard deviation band that brackets October's 95.78 settlement, then 96.00 Pivot R1 beneath the 96.93 nine-day average crossing and Monday's 97.22 high. Beneath price sit the reopened session's 91.75 low, Monday's 91.19 low, the 90.12 half retracement and the 89.97 to 90.20 band where Pivot S1 meets the 20-day average. Tight pair. The trend measures still read upward, with a 14-day directional index of 34.85 and the positive indicator at 25.56 against 16.80, while the multi-indicator composite prints 48 percent buy and price sits above every average from the 20-day at 90.20 outward and far below the 5-day at 96.79. The primary setup is a short from 93.30 to 93.70, stop 94.85, targets 91.19, 89.97 and 87.56. Crude's one catalyst lands Wednesday.
Monday broke the long we published
Monday's outlook set a long from 94.30 to 94.90 with a stop at 92.95, targets at 96.31, 97.78 and 99.49, and a settlement-basis invalidation beneath 93.02. Monday's completed session ran from 97.22 down to 91.19 and settled at 92.37. Read those two sets of numbers together and the verdict is not in doubt. The entry band sat inside the session range, so the long filled. The 91.19 low then ran 1.76 dollars through the 92.95 stop, and the 92.37 settlement finished 0.65 dollars beneath the 93.02 level that outlook named as its invalidation. It failed on both definitions. The session high at 97.22 did clear the first target at 96.31, and the second at 97.78 was never touched, but this run captured no intraday series, so nothing here asserts whether that high printed before or after the low. We record the call as a loss at the stop.
What the level map got right was where the structure lived. The 93.02 invalidation and the 92.95 stop bracketed a zone the contract went straight through, and the reason was a headline sequence no mechanical ladder prices. Headlines outran the ladder. The same outlook argued that backwardation was a material check on any bearish reading, and that half of the thesis held: October kept a 3.41 dollar premium over November through a 4.51 percent decline in the expiring outright, which is not how a curve behaves when physical demand is the thing cracking. The flat price and the curve disagreed all session. Tuesday inherits that argument unresolved.
Trend measures that have not caught up to the price
Start with the directional framework, because it is the reading most at odds with Monday's bar. The 14-day directional index sits at 34.85 with the positive indicator at 25.56 against the negative at 16.80, and the 9-day index is higher still at 44.38, with its component indicators not captured in this run. Anything above 30 with the positive side leading is conventionally a market trending upward. That classification now sits on top of a session that gave away 6.03 dollars. The tension is arithmetic: trend measures average over two weeks and Monday happened in one.
The oscillators have already started moving. The 14-day relative strength reads 55.75 after a fall of 8.89 points, the 9-day is on the midpoint at 50.29 and the 20-day is firmest at 57.62, so the shorter the window the weaker the reading. The 14-day raw stochastic is 46.59 percent, beneath its own midpoint, while stochastic percent K at 65.35 and percent D at 75.86 remain above it. Nothing oversold yet. The whole set has rolled down from the upper band. The multi-indicator composite prints 48 percent buy with the current direction reading at its weakest, and the horizon split is the whole story: 20 percent buy on the short-term group, 25 percent on the medium-term group and 100 percent on the long-term group. Three horizons, three verdicts.
Turn to the averages and the same split appears geometrically. The 5-day sits at 96.79, well above the 92.37 settlement, while the 20-day at 90.20, the 50-day at 83.48, the 100-day at 80.91 and the 200-day at 73.47 all sit beneath it. Price therefore clears every average from the 20-day outward and has collapsed through the shortest one. That configuration describes a sharp correction inside an intact longer advance, and the 20-day at 90.20 is the first structural test that would challenge the reading. The swing frame agrees: the 101.69 quarter high stands above, the 78.54 one-month low and the 67.09 13-week low sit far below, and settlement at 92.37 rests between the 92.85 retracement of 38.2 percent from the four-week high and the 90.12 half retracement of that same advance. An unresolved pullback, not a completed reversal.
Volatility sets the scale for all of it. The 14-day average true range is 3.75 dollars, 4.06 percent of settlement, the 9-day is 4.02 dollars at 4.35 percent and the 20-day is 3.56 dollars at 3.85 percent, so recent sessions have widened against the quarter. The 14-day average daily range is 4.04 dollars at 4.37 percent against a 20-day reading of 3.71 dollars. Historic volatility runs 43.72 percent on the 14-day window and 50.25 percent on the 9-day. A one-average-true-range projection from 92.37 gives 88.62 to 96.12 for Tuesday, and a single average-true-range unit on one crude contract represents 3,750 dollars of notional movement. Crude carries the widest routine range of the four instruments in this package and the greatest overnight gap exposure to a single headline.
The levels, top to bottom
Overhead the first thing price meets is not supply at all. The 92.85 retracement, 38.2 percent from the four-week high, sits 0.48 above the settlement, which makes it the first level a rebound would meet. It reads as resistance now. Then the 93.59 Pivot Point, computed from Monday's completed session and the first mechanical test, with a settlement below it leaving the ladder tilted lower; reclaiming it is the minimum condition for a constructive Tuesday. Above that the 95.39 one standard deviation resistance, calculated on the closing price over the past five sessions, brackets the expiring October contract's 95.78 settlement, which gives the area a second reason to matter through Tuesday's expiry. Two contracts, one zone. Then 96.00 Pivot R1 sits immediately under the 96.93 level where price would cross its 9-day average, the first genuine supply grouping above the market. Monday's 97.22 high marks the upper boundary of that session's span, 99.62 Pivot R2 stacks a mechanical level against the round-number 100 handle just above, and 101.69 carries the 52-week, 13-week and 1-month high in a single price. Pivot R3 at 102.03 needs a supply shock to come into reach.
Beneath price the map is denser and it is the reason this outlook is a short. The reopened session's 91.75 low is the nearest reference the new market has set. Monday's 91.19 low is the level whose loss would extend the decline structurally, and the two sit within 56 cents of each other, which makes the 91.19 to 91.75 band the first objective. Under it the 90.12 half retracement marks the midpoint of the entire recent advance, and then the pairing that matters most: 89.97 Pivot S1 sitting 23 cents under the 20-day average at 90.20. That 89.97 to 90.20 band is the most important support in the near structure. Deeper still, 88.47 is the 38.2 percent retracement from the 13-week high, 87.56 is Pivot S2, and 83.94 Pivot S3 sits just below the 84.78 level where price would cross its 40-day average. Reaching that last rung takes a diplomatic resolution. Ordinary selling does not get there.
Refining is the counterweight, and it deserves its own paragraph. Reported United States retail diesel runs above 6.50 dollars per gallon, October diesel futures settled at 4.8895 dollars per gallon against gasoline at 3.4699 dollars, and an oil-major chief executive said at 10:57 AM ET that too much refining capacity is offline ahead of winter, with energy-press items noting a global refinery crunch pushing diesel prices to new records. Distillate tightness ahead of the northern winter argues that refiner demand for crude is not the source of Monday's weakness. That localises the move in the risk premium. Products are the tight end.
Positioning is a partial gap in this run and the gap is worth naming plainly. No commitments-of-traders data was captured, so speculative length is not quantified anywhere in this outlook, and crude carries no liquid options proxy in this workflow, which means no dealer-positioning or gamma claim appears at any point. The equity and metals outlooks in tonight's package carry a positioning layer this one lacks. What can be said comes from the curve and the open-interest split. November holds 313,311 contracts against October's 60,372 into an expiry, and the 3.41 dollar front premium survived a 4.5 percent decline in the front outright. A backwardated curve that holds through a sharp sell-off is generally consistent with physical buyers still competing for prompt barrels. A wholesale liquidation of length would look different.
The trade map for Tuesday
The primary setup is a short from 93.30 to 93.70, working a retest of the 93.59 Pivot Point. The mechanical case is plain: the November contract settled 1.22 dollars beneath that pivot after surrendering a 6.03 dollar range, which leaves the ladder tilted lower while the market trades under it, and the diplomatic thread that produced the decline has scheduled continuation at the General Assembly. Risk sits above the pivot. The stop at 94.85 sits roughly a third of the 14-day average true range of 3.75 dollars above 93.59, which places it outside routine noise for an instrument whose 14-day average daily range is 4.04 dollars. The first objective is Monday's 91.19 low, the nearest structural magnet. The second is 89.97 Pivot S1, overlapping the 20-day average at 90.20. The third is 87.56 Pivot S2, reachable only if the diplomatic track produces a concrete outcome.
Asian hours carry the highest headline sensitivity of the coming session. The reopened market has traded 91.75 to 92.04 and sits marginally below Monday's 92.37 settlement, which describes stabilisation, with the last quote near 92.06 on 680 contracts. Expected Globex range is 91.20 to 92.90, skewed lower. The General Assembly proceedings in New York run into the Asian morning, so any statement on the Iran track lands when liquidity is thinnest, and a diplomatic headline of substance would break that range in either direction within minutes. The captured calendar's first item of the new day is a European central-bank speaker at 04:30 AM ET, reported by the news-feed calendar captured for this run and unconfirmed against the verified forward calendar.
European hours set the tone for the physical distillate complex, currently the tighter half of the barrel. Expected range 91.40 to 93.20 with the 93.59 Pivot Point as the ceiling reference. The captured calendar carries that 04:30 AM ET speaker and a United Kingdom industrial orders survey at 06:00 AM ET with a consensus of minus 35 against a prior minus 25, both reported by the news-feed calendar captured for this run and unconfirmed against the verified forward calendar. Neither is a crude-specific driver. The session's direction is more likely to come from the overnight diplomatic tone than from either print.
Nine o'clock in New York is where Monday's repricing gets its first full-liquidity test, and it is also the window in which the October contract expires. Expiry-related activity in the front spread can distort the November outright for the first hour, which is reason enough to read early prints with care. Expected first-hour range 91.60 to 93.40. The captured calendar carries a European consumer confidence flash at 10:00 AM ET with a consensus of minus 16 against a prior minus 15.5, a United States central-bank speaker at 10:05 AM ET, and a United States central-bank vice chair speaking on discount window modernisation and Treasury market functioning at 10:20 AM ET. The 10:20 AM ET item reconciles to the verified forward calendar; the 10:00 AM ET and 10:05 AM ET items are reported by the news-feed calendar captured for this run and unconfirmed against the verified forward calendar. One of the three is verified.
Afternoon brings the day's only United States set-piece, a two-year note auction at 01:00 PM ET whose prior auction stopped at a 4.204 percent high yield with a 2.600 bid-to-cover, reported by the news-feed calendar captured for this run and unconfirmed against the verified forward calendar. A weak auction that pushes yields higher firms the dollar and pressures crude at the margin, and the dollar index already rose 0.20 percent on Monday on hawkish central-bank commentary. A United States central-bank speaker is carried at the same hour, also unconfirmed. Expected range into the 2:30 PM ET pit close is 91.30 to 93.30, with the settlement most likely inside 91.80 to 92.90.
Equities complicate the reading. The broad index rallied 1.5 percent on the same inputs that knocked crude down, so Monday was not a risk-off session at all. Crude fell on its own supply story while risk assets rose on the relief that story implied. Commentary in the market wrap noted that the dollar's gains were limited precisely because the crude decline eased inflation expectations, which is a loop worth holding in mind. A falling oil price softens the case for further policy tightening, which caps the dollar, which removes a little pressure from crude.
Scenario ranges here are analyst judgment and carry no derived frequency. The low-range case runs 91.60 to 93.20, the most likely case 90.80 to 93.60 and the high-range case 89.40 to 95.40, and the one-average-true-range envelope around the settlement spans 88.62 to 96.12. Three cases, one ladder. Residual bias into the Tuesday evening reopen stays lower while the November contract holds below 93.59.
The most probable Tuesday keeps November beneath the 93.59 pivot and grinds toward the 91.19 to 91.75 support band, where Monday's completed-session low and the reopened session's low sit within 56 cents of each other. A loss of 91.19 opens 90.12 and then the 89.97 to 90.20 overlap. A reclaim of 93.59 on a sustained basis instead puts 95.39 and the 96.00 Pivot R1 grouping back in play and would signal the diplomatic discount had been overdone. Supply policy stays a background variable, since the captured news feed carried no producer-group decision for Monday and energy-press commentary there noted the absence of public signalling from the two largest producers as itself notable, a characterisation that is unconfirmed against the verified calendar.
The single first-order event for crude is not on Tuesday at all. It is the weekly petroleum status report on September 23, 2026 at 10:30 AM ET, which reconciles to the verified forward calendar, and whose consensus 0.5 million barrel draw against a prior 0.640 million barrel draw is reported by the news feed and unconfirmed. A consensus draw is already in the price. A build would be the more market-moving outcome from here, and the 52-week high at 101.69, also the 13-week and 1-month high, now stands 4.47 dollars above a session high that could not reach it.
Crude enters Tuesday with a curve that still says tightness, a flat price that says the opposite, and a field in Libya offline that nobody wanted to pay for.
The complete data picture
Every number behind Tuesday’s plan, charted first, then the full level map, then the complete numeric reference underneath.
Full numeric reference, every remaining figure from the session review
Carried below in the review’s own order: the session summary from section 1, sections 2.1 to 2.6, the level notes behind sections 3.1 and 3.2, sections 4.1 to 4.6, the positioning note from section 5, the session-by-session forecast from section 6, the Tuesday calendar from section 7 and the primary setup from section 8.
Level notes (3.1 Resistance and 3.2 Support)
102.03 is Pivot R3, the extended upside projection from Monday's range, and it is only reachable on a supply shock rather than on drift.
101.69 is the 52-week, 13-week and 1-month high in a single price, the most concentrated resistance in the structure. The entire upper structure of the past quarter was therefore set within the past month, and Monday's session high of 97.22 stopped 4.47 dollars short of it.
99.62 is Pivot R2, and the round-number 100 handle sits just above it, which stacks a mechanical level against a psychological one.
97.22 is Monday's completed-session high, derived from the pivot ladder as described in section 2.1, and it marks the upper boundary of that session's span.
96.93 is the level at which price would cross its 9-day moving average, sitting immediately above 96.00 Pivot R1. Those two together form the first genuine supply grouping above the market.
96.00 is Pivot R1 and sits immediately under the 96.93 nine-day average crossing.
95.39 is the 1 standard deviation resistance band, calculated on the closing price over the past five sessions, and it also brackets the expiring October contract's 95.78 settlement, which gives the area a second reason to matter through Tuesday's expiry.
93.59 is the Pivot Point, computed from Monday's completed session, and it is the first mechanical test. A settlement below the pivot leaves the ladder tilted lower, so reclaiming it is the minimum condition for a constructive Tuesday. It is also the reference the primary short works against, with the entry zone from 93.30 to 93.70 straddling it.
92.85 is the 38.2 percent retracement from the four-week high and sits 0.48 above the 92.37 settlement, which makes it the first level a rebound would meet rather than a shelf beneath the market.
91.75 is the low of the new Globex session dated Tuesday and is the nearest reference the reopened market has established.
91.19 is Monday's completed-session low, derived from the pivot ladder, and it is the level whose loss would extend the decline structurally rather than cosmetically. It is the first target of the primary setup.
90.20 is the 20-day moving average, the first average beneath the settlement and the first structural test that would challenge the reading of Monday as a correction inside an intact longer advance.
90.12 is the 50 percent retracement from the four-week high and low, the midpoint of the entire recent advance.
89.97 is Pivot S1, sitting 23 cents under the 20-day moving average at 90.20, and that pairing makes the 89.97 to 90.20 band the most important support in the near structure. It is the second target of the primary setup.
88.47 is the 38.2 percent retracement from the 13-week high, a deeper Fibonacci shelf.
87.56 is Pivot S2, the second mechanical projection below the market, and the third target of the primary setup.
84.78 is the level at which price would cross its 40-day moving average, sitting just above 83.94 Pivot S3.
83.94 is Pivot S3 and sits just below the 84.78 forty-day average crossing, an extended downside objective that requires a diplomatic resolution rather than ordinary selling.
1. Session summary
Crude oil gave back a substantial part of its geopolitical premium on Monday. The November contract, which is the contract this outlook covers and the one the chart now tracks, settled at 92.37 after a completed session that ran from 97.22 down to 91.19, a span of 6.03 dollars, or roughly 6.5 percent of the settlement price. The expiring October contract, which comes off the board on Tuesday, September 22, settled at 95.78, down 4.52 dollars or 4.51 percent, and Brent settled at 100.34, down 3.53 dollars or 3.4 percent.
The dominant driver was a reassessment of supply risk rather than a change in demand. Press reports and news-feed items through the afternoon carried two threads that pointed the same way: diplomatic activity around the Iran conflict, with Iran's foreign minister arriving in New York for the United Nations General Assembly at 04:14 PM ET and Qatar publicly working to facilitate an agreement, and separate commentary that crude and liquefied natural gas flows through the Strait of Hormuz over the prior two weeks were running at a six-month high. A market that had been pricing a supply interruption was handed evidence that the interruption was not materialising at the scale feared.
The structural contradiction heading into Tuesday is a front curve that still says physical tightness while the flat price says the opposite. October settled 3.41 dollars above November, a backwardation that persists even as the outright collapses, and the refined products complex is tighter still, with United States diesel prices reported above 6.50 dollars per gallon at retail and an industry executive noting at 10:57 AM ET that too much refining capacity is offline ahead of winter. A counterweight arrived at 03:30 PM ET when Libya's national oil company reported that an armed group had closed a valve on the Sharara pipeline to the Zawiya port, cutting output at that field, and the flat price absorbed it without a meaningful bid.
Volatility expectations for Tuesday should be framed off a 14-day average true range of 3.75 dollars, which is 4.06 percent of settlement, and a 9-day average true range of 4.02 dollars. Crude carries the widest routine range of the four instruments in this package and the greatest overnight gap exposure to a single headline. The primary setup is a short into the Pivot Point at 93.59, working with the mechanical read that a settlement below the pivot leaves the ladder tilted lower, with an explicit acknowledgement that a diplomatic reversal or a second supply interruption inverts the thesis without warning.
2.1 Intraday and Session Review
The completed November session is recovered from the published pivot ladder rather than from an independently read bar. The outer pivot pairs agree: the third-level resistance at 102.03 less the third-level support at 83.94, divided by three, gives 6.03, and the second-level pair of 99.62 and 87.56, divided by two, gives the same 6.03. Solving against a Pivot Point of 93.59 and a settlement of 92.37 returns a session high of 97.22 and a session low of 91.19, and those two values reproduce all seven published levels. These are the completed-session inputs behind the published pivot ladder rather than an independently read bar, and no intraday series was captured for this run, so the order in which the high and the low were made is not asserted here.
Settlement at 92.37 sits 1.84 dollars below the session midpoint of 94.21, which is 94.205 before rounding, and 1.18 dollars above the low, placing the close in the lower fifth of the day's span. Computed from the same paragraph's high, low and settlement, the closing-range position is 19.6 percent. The new Globex session dated Tuesday, September 22 opened at 91.95, has traded between 91.75 and 92.04, and was last quoted near 92.06 against 680 contracts of volume. Those Globex figures belong to the new session and are not part of Monday's completed range.
2.2 Daily Structure
The November contract carries 313,311 contracts of open interest against the expiring October contract's 60,372, which is why November is treated as the tradable contract here. The 5-day change is a loss of 4.77 dollars, or 4.91 percent. The 52-week high at 101.69 was also the 13-week high and the 1-month high, so the entire upper structure of the past quarter was set within the past month, and Monday's session high of 97.22 stopped 4.47 dollars short of it. The 1-month low at 78.54 and the 13-week low at 67.09 sit far below, which frames the current price as elevated within its own three-month distribution despite the size of Monday's decline.
The forward curve remains backwardated at the front, with October 3.41 dollars over November into an expiry. Backwardation of that shape describes prompt physical tightness, and it is the single most important structural fact that Monday's flat-price decline did not erase.
2.3 4-Hour and Swing Structure
The higher-timeframe layout was read at the daily interval with the header showing the continuous crude series at 92.07, and the 30-minute layout was read with the header showing 92.06. Both reads confirm the November contract. The swing structure is defined by the 101.69 quarter high above and the 78.54 one-month low below, with the 38.2 percent retracement from the four-week high at 92.85 and the 50 percent retracement from the four-week high and low at 90.12 bracketing the current price. Settlement at 92.37 sits between those two retracements, which is the technical definition of an unresolved pullback rather than a completed reversal.
2.4 Moving Averages
The stack is in bullish order on the long horizon and broken on the short. The 5-day average sits at 96.79, well above settlement, the 20-day at 90.20 below it, the 50-day at 83.48, the 100-day at 80.91 and the 200-day at 73.47. Price is therefore above every average from the 20-day outward and decisively below the 5-day. That configuration, a collapse through the shortest average while every longer average remains beneath, is the signature of a sharp correction inside an intact longer advance rather than a trend change. The 20-day average at 90.20 is the first structural test that would challenge that reading.
2.5 Oscillator and Trend Readings
The 14-day relative strength measure reads 55.75, having fallen 8.89 points, with the 9-day at 50.29 and the 20-day at 57.62. The 14-day raw stochastic is 46.59 percent with stochastic percent K at 65.35 percent and percent D at 75.86 percent, so the faster lines remain above the raw reading and the whole set has rolled down from the upper band without reaching oversold territory.
The 14-day directional index reads 34.85 with the positive directional indicator at 25.56 against the negative at 16.80, and the 9-day directional index is higher at 44.38. A directional index above 30 with the positive indicator leading describes a market still classified as trending upward by that measure, which sits in open tension with a session that ran 6.03 dollars from high to low and settled in its lower fifth. The multi-indicator composite prints 48 percent buy with the current direction reading at its weakest, the short-term group at 20 percent buy, the medium-term group at 25 percent buy and the long-term group at 100 percent buy. That spread across horizons is the numerical form of the same tension.
2.6 Volatility and Expected Range
The 14-day average true range is 3.75 dollars, or 4.06 percent of settlement, the 9-day is 4.02 dollars at 4.35 percent, and the 20-day is 3.56 dollars at 3.85 percent. The 14-day average daily range is 4.04 dollars at 4.37 percent and the 20-day average daily range is 3.71 dollars. Historic volatility on the 14-day window is 43.72 percent and on the 9-day window 50.25 percent.
A one-average-true-range projection from the 92.37 settlement gives 88.62 to 96.12 for Tuesday. A single average-true-range unit on one crude contract represents 3,750 dollars of notional movement, which is the scale against which every distance on the level map should be read.
4.1 OPEC and Supply Policy (Quotas, Compliance, Saudi and Russia Signals)
The captured news feed carried no producer-group decision for Monday, and energy-press commentary there noted the absence of public signalling from the two largest producers as itself notable, a characterisation that is unconfirmed against the verified calendar. The news-feed calendar lists a producer-group monthly report on October 13, 2026 at 08:00 AM ET and an agency monthly oil report on October 14, 2026 at 04:00 AM ET, both reported by the news feed and unconfirmed against the verified forward calendar, and both outside the immediate window. The practical consequence for Tuesday is that supply policy is a background variable rather than a scheduled one, and the market's attention has shifted to physical flow data and diplomacy.
4.2 Inventory Data (Crude Stocks, Gasoline, Distillates, Cushing, Strategic Reserve)
The verified forward calendar carries the weekly petroleum status report on September 23, 2026 at 10:30 AM ET, and the news-feed calendar puts its consensus at a 0.5 million barrel draw against a prior 0.640 million barrel draw, a consensus figure that is reported by the news feed and unconfirmed. For Tuesday itself, the captured calendar contains European and United States speaker items plus a two-year note auction, all reported by the news feed and unconfirmed against the verified forward calendar, so the crude trade on Tuesday is a positioning and headline market ahead of that Wednesday release.
Refined products carry the tighter signal at present, with reported United States retail diesel above 6.50 dollars per gallon and October diesel futures settling at 4.8895 dollars per gallon against gasoline at 3.4699 dollars.
4.3 Geopolitical Backdrop (Middle East, Iran, Russia and Ukraine, Venezuela)
Monday's decline was a geopolitical repricing. Iran's foreign minister arrived in New York for the General Assembly at 04:14 PM ET, Qatar stated at 03:02 PM ET that it was working to facilitate an agreement between Iran and the United States even on a short-term basis, and a United States administration proposal of a five billion dollar fund to rebuild Gulf energy sites was reported at 03:11 PM ET. Running against that, an armed group closed a valve on Libya's Sharara pipeline at 03:30 PM ET, cutting output at the field. The market's decision to discount the Libyan interruption while pricing the diplomatic thread is the clearest available read on where positioning currently sits.
4.4 Demand and Refining (Refinery Utilisation, Crack Spreads, Seasonal Pattern)
The refining picture is the bullish counterweight to the crude flat price. An oil-major chief executive was quoted at 10:57 AM ET saying too much refining capacity is offline ahead of winter, and energy-press items noted a global refinery crunch pushing diesel prices to new records. Distillate tightness ahead of the northern winter argues that crude demand from refiners is not the source of Monday's weakness, which localises the move in the risk premium rather than in the barrel.
4.5 Dollar and Cross-Asset (Dollar Index, Commodities Complex, Equity Risk Appetite)
The dollar index rose 0.20 percent on Monday on hawkish central-bank commentary, which is a mild headwind for crude priced in dollars. Commentary in the market wrap noted that the dollar's gains were limited precisely because the crude decline eased inflation expectations, a feedback loop worth holding in mind: a falling oil price softens the case for further policy tightening, which in turn caps the dollar, which in turn removes a little pressure from crude. Equities rallied hard on the same inputs, with the broad index up 1.5 percent, so Monday was not a risk-off session. Crude fell on its own supply story while risk assets rose on the relief that story implied.
4.6 Institutional Positioning (Commitments Data, Money Manager against Commercial Hedger, Speculator Length)
No commitments-of-traders data was captured in this run, so speculative length is not quantified here. The available positioning inference comes from the curve and the open-interest split: November holds 313,311 contracts against October's 60,372 into an expiry, and the 3.41 dollar front premium survived a 4.5 percent decline in the front outright. A backwardated curve that holds through a sharp sell-off is generally consistent with physical buyers still competing for prompt barrels rather than with a wholesale liquidation of length.
5. No liquid options proxy
Crude has no exchange-traded fund equivalent of the proxies used for the equity and metals instruments. There is no liquid single-name options fund that serves as a reliable read on crude dealer positioning, because the available vehicle is too thin and structurally decayed by curve roll. This run therefore covers crude without a positioning dataset, and no dealer-positioning or gamma claim appears anywhere in this outlook or in the public post that accompanies it. This is stated explicitly in every edition so readers understand why this section differs from the index and metals reviews in the same package.
Positioning signal for crude comes instead from the commitments-of-traders report, money manager net length against commercial hedger net short, not captured this run; from the weekly petroleum status report on September 23, 2026 at 10:30 AM ET, which reconciles to the verified forward calendar; from producer-group signalling, with the next monthly report listed by the news feed for October 13, 2026 at 08:00 AM ET and unconfirmed against the verified forward calendar; from the front-month against second-month spread, currently 3.41 dollars of backwardation, October over November; and from refined-product cracks, with October diesel at 4.8895 dollars and gasoline at 3.4699 dollars per gallon.
Night Session (6:00 PM ET Monday to 3:00 AM ET Tuesday, Globex and Asia)
The reopened session has traded 91.75 to 92.04 and sits marginally below Monday's 92.37 settlement, which describes stabilisation rather than continuation. Asian hours carry the highest headline sensitivity of the coming session because the General Assembly proceedings in New York run into the Asian morning and any statement on the Iran track lands when liquidity is thinnest. Expected Globex range is 91.20 to 92.90, skewed lower, with the caveat that a diplomatic headline of substance would break that range in either direction within minutes. The captured calendar's first item of the new day is a European central-bank speaker at 04:30 AM ET, which is reported by the news-feed calendar and is unconfirmed against the verified forward calendar.
London Session (3:00 AM to 8:00 AM ET Tuesday)
European hours set the tone for the physical distillate complex, which is currently the tighter half of the barrel. Expected range 91.40 to 93.20 with the Pivot Point at 93.59 as the ceiling reference. The captured calendar carries a European central-bank speaker at 04:30 AM ET and a United Kingdom industrial orders survey at 06:00 AM ET with a consensus of minus 35 against a prior minus 25, both reported by the news-feed calendar and unconfirmed against the verified forward calendar. Neither is a crude-specific driver; the session's direction is more likely to come from the overnight diplomatic tone than from either print.
Morning Session (9:00 AM to 12:00 PM ET Tuesday, United States Open and Pit Session)
The pit open is where Monday's repricing gets its first full-liquidity test, and it is also the window in which the October contract expires. Expiry-related activity in the front spread can distort the November outright for the first hour, and early prints should be read with that in mind. Expected first-hour range 91.60 to 93.40. The captured calendar carries a European consumer confidence flash at 10:00 AM ET with a consensus of minus 16 against a prior minus 15.5, a United States central-bank speaker at 10:05 AM ET, and a United States central-bank vice chair speaking on discount window modernisation and Treasury market functioning at 10:20 AM ET; the 10:20 AM ET item reconciles to the verified forward calendar, while the 10:00 AM ET and 10:05 AM ET items are reported by the news-feed calendar and are unconfirmed against it.
Afternoon Session (12:00 PM to 2:30 PM ET Tuesday, NYMEX Pit Close)
The afternoon carries the only United States set-piece of the day, a two-year note auction at 01:00 PM ET whose prior auction stopped at a 4.204 percent high yield with a 2.600 bid-to-cover, reported by the news-feed calendar and unconfirmed against the verified forward calendar. A weak auction that pushes yields higher firms the dollar and pressures crude at the margin. A United States central-bank speaker is also carried at 01:00 PM ET by the news-feed calendar, unconfirmed against the verified forward calendar. Expected range into the 2:30 PM ET pit close is 91.30 to 93.30 with the settlement most likely inside 91.80 to 92.90.
Night Session Forward (6:00 PM ET Tuesday)
Residual bias into the Globex reopen is lower while the November contract holds below the 93.59 Pivot Point, with attention turning to the weekly petroleum status report on September 23, 2026 at 10:30 AM ET, which reconciles to the verified forward calendar and whose consensus 0.5 million barrel draw is reported by the news feed and unconfirmed. A consensus draw is already in the price; a build would be the more market-moving outcome from here.
Expected Range (Tuesday Full Session)
Low-range scenario: 91.60 to 93.20
Mid-range scenario (most likely): 90.80 to 93.60
High-range scenario: 89.40 to 95.40
Most Likely Path
The most probable Tuesday keeps the November contract beneath the 93.59 Pivot Point and grinds toward the 91.19 to 91.75 support band, where Monday's completed-session low and the reopened session's low sit within 56 cents of each other. A loss of 91.19 opens 90.12, the 50 percent retracement of the four-week advance, and then the 89.97 to 90.20 band where Pivot S1 and the 20-day moving average overlap. A reclaim of 93.59 on a sustained basis would instead put 95.39 and the 96.00 Pivot R1 grouping back in play and would signal that the diplomatic discount had been overdone. Scenario ranges in this outlook are analyst judgment and not derived frequencies.
Tuesday Economic Calendar
Tuesday is a light scheduled day for crude and a moderate one for the dollar. The captured calendar's overnight Asian block contains speaker items only. European hours open with a central-bank speaker at 04:30 AM ET and a United Kingdom industrial orders survey at 06:00 AM ET with a consensus of minus 35 against a prior minus 25, followed by two further European central-bank speakers at 08:30 AM ET and an international financial institution address at 09:00 AM ET, all reported by the news-feed calendar and unconfirmed against the verified forward calendar.
The United States morning carries a European consumer confidence flash at 10:00 AM ET with a consensus of minus 16 against a prior minus 15.5 and a central-bank speaker at 10:05 AM ET, both news-feed items and unconfirmed, and a central-bank vice chair speaking at 10:20 AM ET on discount window modernisation and Treasury market functioning, which reconciles to the verified forward calendar. The afternoon carries a two-year note auction at 01:00 PM ET, prior high yield 4.204 percent and prior bid-to-cover 2.600, and a further central-bank speaker at the same hour, both news-feed items and unconfirmed. A European central-bank speaker follows at 03:30 PM ET and Australian flash purchasing managers indices land at 07:00 PM ET, both news-feed items and unconfirmed.
The single first-order event for crude is not on Tuesday at all. It is the weekly petroleum status report on September 23, 2026 at 10:30 AM ET, which reconciles to the verified forward calendar, and whose consensus 0.5 million barrel draw against a prior 0.640 million barrel draw is reported by the news feed and unconfirmed. Tuesday's crude session is therefore a positioning session into that print, with headline risk from the General Assembly proceedings as the live variable.
Primary Trade Setup
Direction: Short
Rationale: The November contract settled 1.22 dollars below its own Pivot Point after surrendering a 6.03 dollar range, and the mechanical ladder is tilted lower while the market trades beneath 93.59; the diplomatic thread that produced the decline has scheduled continuation at the General Assembly.
Entry Zone: 93.30 to 93.70
Stop Loss: 94.85 (roughly a third of the 14-day average true range of 3.75 dollars above the Pivot Point, which places it outside routine noise for this instrument)
Target 1 (T1): 91.19 (Monday's completed-session low, the nearest structural magnet)
Target 2 (T2): 89.97 (Pivot S1, overlapping the 20-day moving average at 90.20)
Target 3 (T3, extended): 87.56 (Pivot S2, reachable only if the diplomatic track produces a concrete outcome)
Risk-to-Reward: Approximately 1:1.7 to T1, 1:2.6 to T2, 1:4.4 to T3
Invalidation: A sustained session above 93.59 with the front spread holding its backwardation negates the short thesis and turns attention to 95.39 and the 96.00 Pivot R1 grouping.
Macro override: A second physical supply interruption on the scale of the Libyan valve closure, a breakdown in the General Assembly diplomatic track, or an unexpected producer-group statement would invert this setup in real time. An inventory build against the draw consensus at the September 23, 2026 release at 10:30 AM ET would accelerate it.
Sources and methodology
This outlook is built from our session review of the November NYMEX WTI crude contract, CLX26, the November ’26 month, prepared after Monday's close on September 21, 2026. Every level is computed from November, which carries 313,311 contracts of open interest against the expiring October contract's 60,372; October settled at 95.78 on the same session and is carried for context only, which is why the headline WTI settle quoted elsewhere differs from the 92.37 used throughout. The completed November session is recovered from the published pivot ladder rather than from an independently read bar, and no intraday series was captured, so no intraday path is asserted. This workflow carries no positioning dataset for crude, so no gamma, dealer-positioning or options-flow claim is made at any point.
Scenario ranges are analyst judgment; they carry no calibration. Contract months are kept separate throughout. Scheduled items marked unconfirmed come from the news-feed calendar captured for this run and were not verified against the verified forward calendar; the 10:20 AM ET central-bank vice chair item and the September 23, 2026 petroleum status report at 10:30 AM ET are the two that reconcile to it. The commitments-of-traders components, the November contract's own session change, refinery utilisation and crack-spread readings, and the component directional indicators on the 9-day horizon were not captured in this run, and no figure is stated for any of them.
Monday’s outlook for this contract is here, and Monday’s gold outlook, which shares this session's macro source pass, is here. Outlooks for the equity index, technology index, gold and crude contracts are collected on the market outlook page, and our forward trading record is on the performance statement.



