
At 9:30 AM ET on Friday, per market commentary, 36,000 lots of dealer-held long puts and 24,000 lots of dealer-held short calls at the SPX 7,700 strike expired. Dealers holding long futures against those positions would begin selling as the positions rolled off, and the same commentary connected that unwind to a minus 6 billion dollar hedging-flow reading in the 45 minutes after the open. That flow was mechanical and expiration-driven, and it is the reason a flat session had a heavy start. By the close the cash index had gained 0.17 percent inside a 61 basis point intraday range.
December E-mini futures settled at 7,712.50, up 5.25 points or 0.07 percent from Thursday's 7,707.25, after opening at 7,703.50, printing a low of 7,675.00 and a high of 7,739.25. The settlement landed 58.4 percent of the way up a 64.25 point range and 3.58 points above the pivot point at 7,708.92, the thinnest margin of the four contracts we cover. Volume printed 1,288,568 contracts against open interest of 1,888,650. Monday's first question sits just overhead, where the 18-day crossing at 7,731.03, the 20-day average at 7,733.95 and the 40-day crossing at 7,734.88 stack inside 3.85 points.
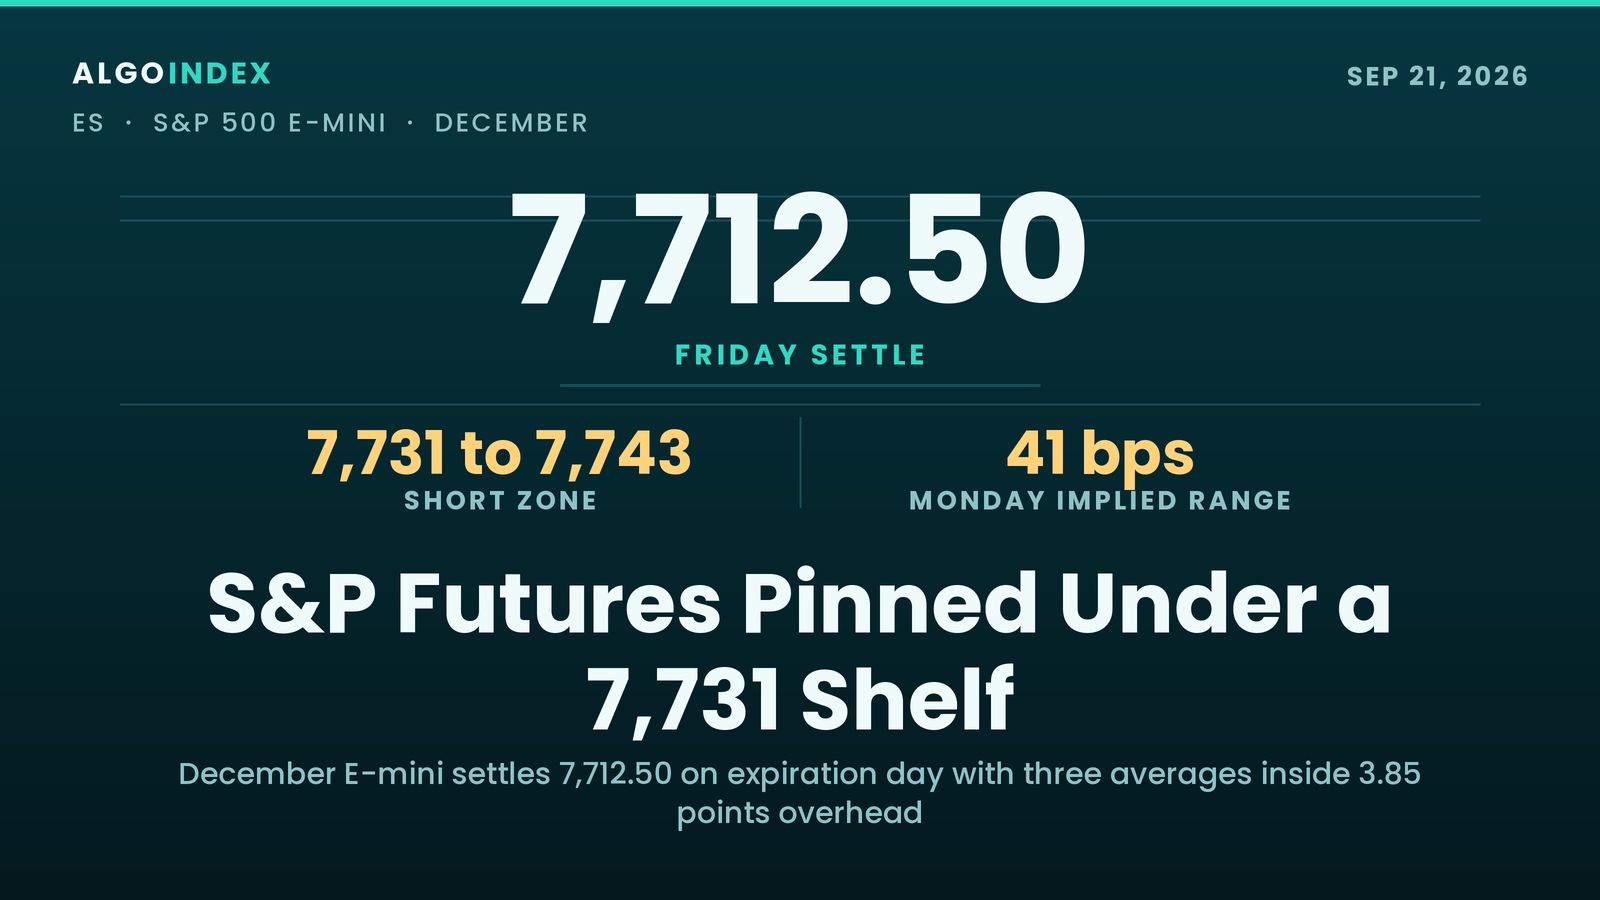
December S&P 500 futures settled at 7,712.50, up 0.07 percent. It was a quarterly expiration session (per the positioning note captured for this run, unconfirmed against the verified forward calendar) and the cash index closed within one point of its primary gamma concentration strike at SPX 7,650. Resistance starts at the 7,726.53 computed target price and thickens at 7,731.03 to 7,734.88, where three trend references sit inside 3.85 points, with Friday's high at 7,739.25 and the first pivot resistance at 7,742.83 directly above. Support begins at the four-value confluence from 7,708.92 to 7,706.57 and deepens at the 7,680.34 to 7,674.51 demand shelf. The primary setup is a short from 7,731 to 7,743, stop 7,760, targets 7,709, 7,687 and 7,675, with Monday's implied cash range quoted at roughly 41 basis points.
The long that filled and paid once
Friday's outlook set a long from 7,676 to 7,682 with a stop at 7,640 and targets at 7,722, 7,747 and 7,787. Friday's bar ran 7,675.00 to 7,739.25. The low printed at 7,675.00, just beneath the bottom of the zone, so the entry filled. The stop at 7,640 was never touched. The high at 7,739.25 cleared the first target at 7,722 and stopped short of the second at 7,747, and the 7,712.50 settlement closed the day above the zone. We record that as a call that reached its first objective and missed the rest. One caution belongs on the record: the daily bar does not order its low and its high, and this run captured the completed bar and the published level ladder with no time-stamped intraday series, so whether the fill preceded the first target is something the bar cannot prove.
What the session did prove is how little conviction it carried. The index went nowhere on a quarterly expiration (per the positioning note captured for this run, unconfirmed against the verified forward calendar). Technology rose 0.67 percent. The industrial average fell 0.18 percent, and market commentary noted its weekly decline of 1.7 percent was the largest since March. The correlation index fell 15 percent to a reading of 9, per the desk note captured at 5:14 PM ET. A single-digit reading means constituents are moving on their own fundamentals. A 0.17 percent gain in the broad index on a day when the industrial average posts its worst week in six months is a description of narrowness, not of strength. Beneath a flat headline, the index was pulling apart into leaders and laggards.
Three averages inside 3.85 points
The overhead structure is the tightest grouping in the four-instrument package. Price crosses the 18-day average at 7,731.03 (SPX 7,669). The 20-day average sits at 7,733.95 (SPX 7,672), the study driving the composite's short-term sell signal, with the settlement 21.45 beneath it. Price crosses the 40-day average at 7,734.88 (SPX 7,673). Three trend references, 3.85 points. Friday's high at 7,739.25 (SPX 7,677) and the first pivot resistance at 7,742.83 (SPX 7,681) sit directly above, and the 38.2 percent retracement from the four-week high at 7,745.41 (SPX 7,683) and the one standard deviation resistance at 7,750.49 (SPX 7,688) cap the shelf. Just beneath it, the computed target price at 7,726.53 (SPX 7,665) is the first reference overhead, 14.03 above the settlement.
Above the shelf the map thins out. The two standard deviation resistance is 7,766.22 (SPX 7,704), the second pivot resistance 7,773.17 (SPX 7,711), the three standard deviation resistance 7,778.29 (SPX 7,716) and the third pivot resistance 7,807.08 (SPX 7,745), 28.79 above that outer band. The one-month high at 7,850.75 (SPX 7,789) and the 52-week high at 7,905.00 (SPX 7,843), which is also the 13-week high, finish the ladder; the settlement sits 2.44 percent beneath the 52-week high and 19.28 percent above the 52-week low of 6,466.00. In cash terms the call-side hedging boundary is published at SPX 7,800.
Beneath price the structure is denser still. The 50 percent retracement of the four-week range at 7,712.88 (SPX 7,651) sits 0.38 from the settlement. Then a four-value confluence: the pivot point at 7,708.92 (SPX 7,647), Thursday's close at 7,707.25 (SPX 7,645), the 38.2 percent retracement from the 13-week high at 7,706.74 (SPX 7,645) and the 50-day average at 7,706.57 (SPX 7,645), all inside 2.35 points. The 9-day crossing at 7,686.59 (SPX 7,625) comes next. Then the demand shelf: the 38.2 percent retracement from the four-week low at 7,680.34 (SPX 7,618), the first pivot support at 7,678.58 (SPX 7,617), the 5-day average at 7,678.30 (SPX 7,616), Friday's low at 7,675.00 (SPX 7,613) and the one standard deviation support at 7,674.51 (SPX 7,613), five values inside 5.83 points. That is the densest demand shelf in the package. Below that sit the two standard deviation support at 7,658.78 (SPX 7,597), then the three standard deviation support at 7,646.71 (SPX 7,585), the 50 percent retracement of the 13-week range at 7,645.50 (SPX 7,584) and the second pivot support at 7,644.67 (SPX 7,583) grouped inside 2.04 points. Deeper still: the 100-day average at 7,633.62 (SPX 7,572), the third pivot support at 7,614.33 (SPX 7,552) and the one-month low at 7,575.00 (SPX 7,513), beneath which the month-long balance fails.
Call it balance. A settlement within four tenths of a point of the 50 percent retracement of its own four-week range is the cleanest statement of balance the data can make. The one-month high is 7,850.75 and the one-month low 7,575.00; the settlement sits 138.25 beneath the first and 137.50 above the second, within four tenths of a point of the exact midpoint at 7,712.88. ES closed at the centre of its distribution with no directional information in its range position at all. Nasdaq closed in the upper quarter of its one-month range and gold in the lower half of its own.
Pinned to the strike
The cash index closed at 7,650.74, within one point of the primary gamma concentration strike published at SPX 7,650, where the modeled volatility threshold also sits. That close is derived: the prior close of 7,637.76 multiplied by the quote provider's published 0.17 percent gain, which the desk note corroborates only to the nearest point at 7,651. Sitting on the largest gamma concentration is the configuration in which dealer hedging dampens movement in both directions. The gamma index reads positive at 0.735, gamma tilt 1.037, gamma notional positive at 110.179 million dollars, and the 25 delta risk reversal minus 0.042. The modeled gamma-flip level sits at SPX 7,593, the put-side support base at SPX 7,500 and the call-side hedging boundary at SPX 7,800. The positioning picture is stabilising.
Flow ran two ways at once. The desk note reported index hedging flow at minus 5 billion dollars of delta, dominated by same-day expiry activity, while single-stock flow inside the same index registered plus 3 billion dollars from longer-dated call buying. Money is being committed to individual names and withdrawn from index exposure at the same time. Semiconductors led, per the desk note captured at 5:14 PM ET: the sector fund gained 3 percent with MU up 4 percent, SNDK up 11 percent, AMD up 3 percent and AVGO up 3 percent. For a contract that trades the index, that is a structurally unhelpful condition. It caps index-level directional conviction, and it is consistent with a 16 percent buy composite here sitting alongside a 40 percent buy composite on the technology index.
Volatility compressed further. The volatility index closed with a 14 handle, down 4 percent, and its own volatility measure closed at 87, down 0.4 percent. Fixed-strike volatility dropped one to three points across the surface. Implied volatility for Monday was quoted at 6.5 percent, implying an intraday cash range of roughly 41 basis points, against a published one-day implied move of 0.51 percent and a five-day implied move of 1.26 percent. Friday realised 61 basis points. The forward estimate is materially smaller than what just printed, and that is the single strongest argument that Monday is a compression session unless a headline forces otherwise.
The directional readings pull the other way, and we state them without softening. The 9-day directional index reads 24.43 with a positive component of 14.05 against a negative of 23.46, within a fraction of the conventional 25 threshold that denotes a trending market. The 14-day reads 16.14 with components of 15.46 and 23.24. On both captured horizons the negative side leads. ES is the only one of the four instruments down over five sessions, at minus 0.19 percent, and its multi-indicator composite at 16 percent buy is the lowest of the four, with the composite trend indicator registering sell and the short-term study group averaging 40 percent sell. That combination is the one configuration in the data that argues for a downward resolution, and it is why the setup below is the only short in the package.
The trade map for Monday
The primary setup is a short from 7,731 to 7,743 (SPX 7,669 to 7,681), fading the supply shelf. The stop is 7,760 (SPX 7,698), above the one standard deviation resistance at 7,750.49 and above the 38.2 percent retracement from the four-week high at 7,745.41. The first target is 7,709 (SPX 7,647), the four-value confluence. The second is 7,687 (SPX 7,625), the 9-day crossing at 7,686.59. The third is 7,675 (SPX 7,613), the demand shelf, reached only if momentum extends through the second.
From the 7,737 midpoint of the zone the risk is 23 points, approximately 1:1.2 to the first target, 1:2.2 to the second and 1:2.7 to the third. Twenty-three points is roughly 30 percent of the 14-day average true range of 75.81, tight by this contract's standards, and the weekend gap exposure adds to the mismatch between stop distance and volatility. A specific condition applies. The cash index is pinned within one point of its primary gamma concentration strike and Monday's implied cash range is roughly 41 basis points, so a compression session that never reaches the entry zone is a realistic outcome. Gap levels run both ways. An upside gap through 7,731.03 to 7,734.88 and above 7,739.25 would negate the setup before it triggers and put 7,742.83 in play; a downside gap beneath 7,680.34 to 7,674.51 would run the targets without offering the entry.
The oscillators sit mid-range. The 14-day relative strength index reads 49.17, up 0.47 on the session, compared with the neutral 50 midpoint. The 14-day stochastic reads 39.52 percent on the fast line against 26.04 on the slow, with the raw 14-day reading at 53.19 percent; the 9-day, 20-day and 50-day values were not captured in this run. Historic volatility on the 14-day horizon is 9.77 percent. Single-digit realised volatility is a compressed condition, and compressed conditions resolve. Period performance reads down 0.19 percent over five sessions, down 0.20 percent over twenty, up 0.74 percent over fifty, up 5.40 percent over one hundred and up 9.57 percent year to date, the signature of a pause inside an uptrend.
Monday's slate is empty of United States data on the calendar captured for this run. Goolsbee speaks at 6:30 AM ET ahead of the cash open and the Bank of Canada's Macklem at 11:20 AM ET, per the news-feed calendar captured for this run, unconfirmed against the verified forward calendar; the European Central Bank's Kazimir at 4:30 AM ET and the Reserve Bank of Australia's Hunter at 3:00 PM ET and Bullock at 11:10 PM ET sit on the same unconfirmed news-feed basis. Speakers only. Before any of that, the Chinese one-year and five-year loan prime rates land at 9:00 PM ET Saturday, with calendar forecasts of 3 percent and 3.5 percent against previous values of 3.00 percent and 3.50 percent, per the shared news-feed calendar capture in the crude and gold packages, unconfirmed against the verified forward calendar. Tuesday is the week's first-order risk. Williams speaks at 10:05 AM ET, Jefferson at 10:20 AM ET, Barkin at 1:00 PM ET and a two-year note auction at 1:00 PM ET carrying a previous high yield of 4.204 percent and a previous bid-to-cover of 2.600, all per the news-feed calendar captured for this run, unconfirmed against the verified forward calendar. Rates are the weight on this index. The Federal Reserve projections published at 2:00 PM ET on Wednesday, September 16 show twelve of eighteen officials expecting one further 25 basis point increase this year, four expecting two and two expecting none, and the captured market wrap headline described ten-year Treasury yields rising during Friday's session, with no yield level or quote time captured in this run.
Scenario ranges are analyst judgment. The low-range case runs from the first pivot support at 7,678.58 to the first pivot resistance at 7,742.83, a width of 64.25 or 0.84 times the 14-day average daily range of 76.23. The most likely case runs from the one standard deviation support at 7,674.51 to the one standard deviation resistance at 7,750.49, 75.98 wide, essentially one average daily range. That is the base case. The high-range case runs from the second pivot support at 7,644.67 to the second pivot resistance at 7,773.17, 128.50 wide or 1.69 times the average range, against a one-ATR envelope of 7,636.69 to 7,788.31. The most likely path holds the balance through Asian and European hours, works up toward 7,726.53 and into the 7,731.03 to 7,734.88 shelf during the United States morning, and gets capped there by the three trend references and the session high. From there it turns back toward 7,708.92 to 7,706.57 and, on a firm downside session, toward 7,686.59. The alternative path simply pins near the settlement all session and resolves nothing. The 41 basis point implied range makes that a genuine possibility.
Two days of headlines separate Friday's 7,712.50 settlement from the first Monday print, and the cash index is sitting within one point of the strike that pins it.
The complete data picture
Every number behind Monday’s plan, charted first, then the full level map, then the complete numeric reference underneath.
Full numeric reference, every remaining figure from the session review
Level notes
7,726.53 (SPX 7,665) is the computed target price published alongside Monday's ladder, 14.03 above the settlement and the first meaningful reference overhead.
7,731.03 (SPX 7,669) is the 18-day moving average crossing, the lower edge of the supply shelf.
7,733.95 (SPX 7,672) is the 20-day moving average, the study driving the composite's short-term sell signal.
7,734.88 (SPX 7,673) is the 40-day moving average crossing. Three independent trend references inside 3.85 points with the two levels above, the tightest overhead grouping in this package and the basis for the Primary Setup entry.
7,739.25 (SPX 7,677) is Friday's session high.
7,742.83 (SPX 7,681) is Pivot R1, the first pivot resistance of Monday's ladder.
7,745.41 (SPX 7,683) is the 38.2 percent retracement from the four-week high.
7,750.49 (SPX 7,688) is the 1 standard deviation resistance, the upper boundary of the supply shelf and the level the Primary Setup stop sits above.
7,766.22 (SPX 7,704) is the 2 standard deviations resistance.
7,773.17 (SPX 7,711) is Pivot R2, the second pivot resistance of Monday's ladder.
7,807.08 (SPX 7,745) is Pivot R3, the third and outermost pivot resistance, 28.79 above the third standard deviation resistance at 7,778.29 (SPX 7,716).
7,850.75 (SPX 7,789) is the one-month high, and 7,905.00 (SPX 7,843) is the 52-week high, which is also the 13-week high; the settlement sits 2.44 percent beneath it.
7,712.88 (SPX 7,651) is the 50 percent retracement of the four-week range, within 0.38 of the settlement.
7,708.92 (SPX 7,647) is the Pivot Point, the mechanical midpoint of Monday's ladder.
7,707.25 (SPX 7,645) is Thursday's previous close.
7,706.74 (SPX 7,645) is the 38.2 percent retracement from the 13-week high.
7,706.57 (SPX 7,645) is the 50-day moving average. The pivot point at 7,708.92, the previous close at 7,707.25, the 13-week retracement at 7,706.74 and the 50-day average at 7,706.57 group inside 2.35 points, a four-value confluence and the first Primary Setup target.
7,686.59 (SPX 7,625) is the 9-day moving average crossing, the second Primary Setup target.
7,680.34 (SPX 7,618) is the 38.2 percent retracement from the four-week low.
7,678.58 (SPX 7,617) is Pivot S1, the first pivot support of Monday's ladder.
7,678.30 (SPX 7,616) is the 5-day moving average.
7,675.00 (SPX 7,613) is Friday's session low.
7,674.51 (SPX 7,613) is the 1 standard deviation support. The four-week retracement, the first pivot support, the 5-day average, the session low and this band group inside 5.83 points, the densest demand shelf in this package and the third Primary Setup target.
7,658.78 (SPX 7,597) is the 2 standard deviations support.
7,646.71 (SPX 7,585) is the 3 standard deviations support.
7,645.50 (SPX 7,584) is the 50 percent retracement of the 13-week range.
7,644.67 (SPX 7,583) is Pivot S2, grouped with the two levels above inside 2.04 points.
7,633.62 (SPX 7,572) is the 100-day moving average, 78.88 beneath the settlement.
7,614.33 (SPX 7,552) is Pivot S3, the outermost pivot support of Monday's ladder.
7,575.00 (SPX 7,513) is the one-month low, the structural reference beneath which the month-long balance fails. Further down sit the 13-week low at 7,386.00, the year-to-date average at 7,353.37, the 200-day average at 7,324.33 and the 52-week low at 6,466.00.
1. Session summary
December S&P futures settled at 7,712.50 (SPX 7,651), up 5.25 on the session, a gain of 0.07 percent from Thursday's 7,707.25 close. The cash index close used throughout is 7,650.74, a derived value: the prior close of 7,637.76 multiplied by the quote provider's published 0.17 percent gain (7,637.76 times 1.0017), which the desk note corroborates only to the nearest point at 7,651, while the positioning source's console reading of 7,658.65 conflicts with both and is excluded. The desk note gives a 61 basis point intraday cash range. The futures contract opened at 7,703.50, traded between 7,675.00 and 7,739.25, and settled 3.58 above its own pivot point of 7,708.92, effectively unchanged in mechanical terms. Volume printed 1,288,568 contracts against open interest of 1,888,650.
The contract-domain check passes on all five fields: the chart series and the provider agree on open 7,703.50, high 7,739.25, low 7,675.00, close 7,712.50 and change plus 5.25 or 0.07 percent for the December contract. The futures-to-cash basis measured for this session is 61.76, computed from the 7,712.50 settlement against the 7,650.74 cash close. The prior session's basis on the same method was 69.49. That narrowing of nearly eight points in a single session is itself a quarterly-expiration artifact, and every SPX equivalent here uses the measured 62 point offset, rounded.
ES is the weakest of the four instruments in the package by every composite measure. It is the only one of the four down over five sessions, at minus 0.19 percent. Its multi-indicator composite reads 16 percent buy, the lowest of the four, with the composite trend indicator registering sell and the short-term study group averaging 40 percent sell. The 14-day directional index reads 16.14 with a negative directional component of 23.24 against a positive component of just 15.46, and the 9-day index at 24.43 is approaching the trending threshold with the same negative skew. The settlement sits 21.45 beneath the 20-day average of 7,733.95 (SPX 7,672), the study driving that short-term sell. Against that, the cash index closed within a point of the primary gamma concentration strike published at SPX 7,650, the volatility index closed with a 14 handle down 4 percent, and implied volatility for Monday was quoted at 6.5 percent, implying an intraday range of roughly 41 basis points.
2.1 Intraday and Session Review
The December contract opened at 7,703.50 (SPX 7,642), 3.75 beneath Thursday's 7,707.25 settlement, and traded a 64.25 point range between 7,675.00 (SPX 7,613) and 7,739.25 (SPX 7,677). That range is 0.833 percent of the settlement and beneath the 14-day average daily range of 76.23. The settlement at 7,712.50 sits 37.50 above the session low and 26.75 beneath the session high, placing the close at 58.4 percent of the session range measured from the low, and only 9.00 above its own open.
One mechanical event from the session explains the shape of the morning. Market commentary reported that 36,000 lots of dealer-held long puts and 24,000 lots of dealer-held short calls at the SPX 7,700 strike expired at 9:30 AM ET. Dealers holding long futures to hedge those positions would begin selling futures as the positions expired, which the same commentary connected to a minus 6 billion dollar hedging-flow reading in the 45 minutes following the open. That flow was mechanical and expiration-driven, and it is the reason a flat session had a heavy start.
This run captured the completed daily bar and the published level ladder with no time-stamped intraday series, so the sequencing of the move beyond that documented expiration event is not asserted. The weekly commitments data for the index contract for the week ending September 15 was published at 4:21 PM ET, after the close.
The settlement 3.58 above the pivot point of 7,708.92 (SPX 7,647) is the thinnest margin of the four instruments. ES enters Monday effectively pinned to its own computed midpoint, where gold and Nasdaq enter above theirs and crude beneath.
2.2 Daily Structure
The settlement sits 2.44 percent beneath the 52-week high of 7,905.00 (SPX 7,843), which is also the 13-week high, so the highest print of the past quarter is also the highest of the year, and 19.28 percent above the 52-week low of 6,466.00, both measured on the provider's basis from the high and the low respectively. The one-month high is 7,850.75 (SPX 7,789) and the one-month low is 7,575.00 (SPX 7,513), placing the settlement 138.25 beneath the monthly high and 137.50 above the monthly low, within four tenths of a point of the exact midpoint of that range at 7,712.88. The 13-week low is 7,386.00.
That midpoint position is the defining structural fact. Nasdaq closed in the upper quarter of its one-month range and gold in the lower half of its own; ES closed at the centre of its recent distribution with no directional information in its range position at all.
The raw stochastic reading captured is the 14-day at 53.19 percent compared with the 50 percent midpoint of its range; readings on other horizons were not captured in this run.
2.3 4-Hour and Swing Structure
The swing structure is a consolidation beneath a recent high. The most recent swing high is the one-month high at 7,850.75 and the most recent swing low the one-month low at 7,575.00; the settlement sits at the midpoint between them. No retracement level of consequence has been broken in either direction.
The Fibonacci grid frames the range. The 38.2 percent retracement measured from the four-week high sits at 7,745.41 (SPX 7,683) and the 50 percent retracement of the four-week range at 7,712.88 (SPX 7,651), the latter only 0.38 from the settlement itself. The 38.2 percent retracement from the four-week low sits at 7,680.34 (SPX 7,618), the 38.2 percent retracement from the 13-week high at 7,706.74 (SPX 7,645) and the 50 percent retracement of the 13-week range at 7,645.50 (SPX 7,584). A settlement sitting within four tenths of a point of the 50 percent retracement of its own four-week range is the cleanest possible statement of a market in balance.
The oscillator reading captured is the 14-day stochastic, with percent K at 39.52 currently above its percent D of 26.04. Earlier K and D values were not captured, so this outlook states that K exceeds D on that horizon and does not assert when a crossing occurred; the 9-day, 20-day and 50-day values were not captured. K above D is the same configuration gold and Nasdaq show on their captured horizons, but from a lower K value than Nasdaq's 56.78. The 14-day relative strength reads 49.17 compared with the neutral 50 midpoint, and rose 0.47 points on the session; other relative strength horizons were not captured.
2.4 Moving Averages
The average stack is compressed to an unusual degree. The 5-day sits at 7,678.30 (SPX 7,616), the 20-day at 7,733.95 (SPX 7,672), the 50-day at 7,706.57 (SPX 7,645), the 100-day at 7,633.62 (SPX 7,572), the 200-day at 7,324.33 and the year-to-date average at 7,353.37. The 5-day, 50-day and 20-day sit inside a 55.65 point band, which is less than one 14-day average true range of 75.81, and the settlement sits inside that band.
Relative to the settlement: price is 34.20 above the 5-day, 21.45 beneath the 20-day, 5.93 above the 50-day, 78.88 above the 100-day, 388.17 above the 200-day and 359.13 above the year-to-date average. The single negative reading, against the 20-day, is what drives the composite's short-term sell signal, and reclaiming 7,733.95 would flip that study.
The published crossing thresholds group in the same narrow band and form the supply shelf this outlook trades against. Price crosses the 18-day average at 7,731.03 (SPX 7,669), the 20-day average sits at 7,733.95 (SPX 7,672) and price crosses the 40-day average at 7,734.88 (SPX 7,673). Three independent trend references inside 3.85 points is the tightest overhead grouping in the entire package. Beneath, price crosses the 9-day average at 7,686.59 (SPX 7,625).
Period performance confirms the stall: down 0.19 percent over five sessions, down 0.20 percent over twenty, up 0.74 percent over fifty, up 5.40 percent over one hundred and up 9.57 percent year to date; the 200-session change was not captured. Two consecutive negative short-horizon readings inside a strongly positive long-horizon series is the signature of a pause in an uptrend.
2.5 Oscillator and Trend Readings
The directional framework carries the clearest negative signal in the package and it deserves to be stated without softening. The 9-day directional index reads 24.43 with a positive directional component of 14.05 against a negative of 23.46. The 14-day reads 16.14 with components of 15.46 and 23.24. Readings on the 20-day, 50-day and 100-day horizons were not captured in this run.
On both captured horizons the negative directional component exceeds the positive one, and the 9-day index at 24.43 is within a fraction of the conventional 25 threshold that denotes a trending market. That combination, a short-horizon index near the threshold with a negative skew, is the one configuration in this outlook that argues for a downward resolution. It is also the reason the Primary Setup is the only short in the package.
Historic volatility on the 14-day horizon reads 9.77 percent; other horizons were not captured in this run. Single-digit realised volatility is a compressed condition, and compressed conditions resolve.
The multi-indicator composite reads 16 percent buy with strength rated weak and direction rated average, the lowest reading of the four instruments, and the composite trend indicator registers sell. By horizon, short-term studies average 40 percent sell, medium-term 75 percent buy and long-term 67 percent buy. In detail as captured: the 7-day directional indicator, the 20-day average versus price and the 20-day volatility bands register sell; six sub-studies register buy and three register hold, but the component-by-component table was not captured in this run, so the individual buy and hold studies are not named. Three sells and three holds against six buys among the sub-studies, with the trend composite registering sell on top. All three named sells are short-horizon studies, which describes a market whose near-term momentum has turned down inside a longer structure that the medium and long-term study groups, at 75 percent and 67 percent buy, still read as intact.
2.6 Volatility and Expected Range
The 14-day average true range reads 75.81, or 0.98 percent of price; readings on other horizons were not captured in this run, so no statement is made about volatility stability over the quarter.
The 14-day average daily range reads 76.23; other horizons were not captured. Friday's realised range of 64.25 came in at 84 percent of the 14-day average.
A projection of one 14-day average true range of 75.81 from the settlement spans 7,636.69 to 7,788.31 (SPX 7,575 to 7,726). The forward-looking volatility estimate is tighter still: the options surface quoted a one-day implied move of 0.51 percent and an implied volatility of 6.5 percent for Monday, implying an intraday cash range of roughly 41 basis points. That is a materially smaller expectation than the realised 61 basis point range of Friday and the single strongest argument that Monday is a compression session unless a headline forces otherwise.
4.1 Dollar, Rates, and Fed Policy
Rates are the dominant macro input and they are restrictive. The Federal Reserve projections published at 2:00 PM ET on Wednesday, September 16 show twelve of eighteen officials expecting one further 25 basis point increase this year, four expecting two and two expecting none; the rate decision itself was not captured in this run and is not characterised here. The captured market wrap headline described ten-year Treasury yields rising during Friday's session; no yield level or quote time was captured in this run, so no level is stated.
The dollar index level and its session change were NOT CAPTURED IN THIS RUN, and no causal attribution for the dollar's move is made. The one activity release captured, from this run's calendar capture, was industrial production at 9:15 AM ET, which printed 0.0 percent month over month against a 0.3 percent forecast, with capacity utilisation at 76.3 percent against a 76.4 percent forecast; other activity data released during the session were not captured. The shared sentiment summary captured at 4:11 PM ET carried the headline that the Bank of Japan delivered a split rate increase, with no further detail captured.
The combination that matters for this index is a central bank projecting further tightening into a rising long end while the one captured activity print came in beneath forecast. That is the familiar late-cycle squeeze on equity multiples, and it is the most plausible explanation for why the broad index has gone sideways for a month while the technology sub-index has not.
The forward policy calendar is speaker-dense and data-light. Goolsbee speaks Monday at 6:30 AM ET; Tuesday brings Williams at 10:05 AM ET, Jefferson at 10:20 AM ET, Barkin at 1:00 PM ET and a two-year note auction at 1:00 PM ET, per the news-feed calendar captured for this run, unconfirmed against the verified forward calendar. The next rate statement is October 28 at 2:00 PM ET, per the news-feed calendar captured for this run, unconfirmed against the verified forward calendar.
4.2 Large-Cap Leadership and Earnings
No mega-cap earnings appear on the forward calendar captured for this run inside the forecast window, so large-cap news reached the market through corporate disclosure.
Leadership was narrow and concentrated in technology and semiconductors. Per the desk note captured at 5:14 PM ET, the semiconductor sector fund gained 3 percent with MU up 4 percent, SNDK up 11 percent, AMD up 3 percent and AVGO up 3 percent. Corporate artificial-intelligence capital-expenditure disclosures and digital-asset moves during the session were NOT CAPTURED IN THIS RUN with their figures and are not described here.
That leadership is not broad. The industrial average fell 0.18 percent on the session and market commentary noted its weekly decline of 1.7 percent was the largest since March. The broad index gained 0.17 percent on the day the industrial average posted its worst week in six months.
4.3 Geopolitical Backdrop
The geopolitical items captured ran in the risk-positive direction during the week. De-escalation items, from the shared source pass for the crude package: the report at 7:58 AM ET on September 17 that China privately asked Iran to restrain Yemen's Houthis following a Saudi appeal, and the report at 11:47 AM ET on September 16 that Saudi Arabia is seeking to return roughly half its East-West pipeline capacity within days. Crude fell 1.18 percent on the November contract per the crude package's capture, and the captured sentiment summary carried the headline that technology led as oil eased.
The Chinese state visit to the United States is carried as an all-day calendar item for Thursday, September 24 (per the news-feed calendar captured for this run, unconfirmed against the verified forward calendar); reporting on its trade agenda was NOT CAPTURED IN THIS RUN.
Two items ran the other way late in the day: a report at 3:23 PM ET that a senior Houthi figure said Saudi Arabia had requested Iranian mediation, and a report at 4:31 PM ET of an explosion heard in Jazan and Abha in Saudi Arabia. The 3:23 PM ET report preceded the 4:00 PM ET cash close and the 4:31 PM ET report followed it; no reaction evidence was captured for either, so this outlook records the headline times and makes no claim about how much of either the settlement reflects.
4.4 Sector Breadth and Rotation
Breadth is the most informative reading available and it is unambiguous. Per the desk note captured at 5:14 PM ET, the correlation index fell 15 percent to a reading of 9. A single-digit correlation index means index constituents are moving on their own fundamentals, and it explains the entire shape of the session: technology up 0.67 percent, the broad index up 0.17 percent, the industrial average down 0.18 percent.
Market commentary reinforced the point directly, noting that the index hedging flow registered minus 5 billion dollars of delta on the day while single-stock flow within the same index registered plus 3 billion dollars driven by longer-dated call buying. Money is being committed to individual names and withdrawn from index exposure at the same time.
For a futures contract that trades the index, that is a structurally unhelpful condition. It caps index-level directional conviction and it is consistent with a 16 percent buy composite sitting alongside a technology index at a 40 percent buy composite.
4.5 Cross-Asset and Volatility
Volatility compressed further. The volatility index closed with a 14 handle, down 4 percent, and its own volatility measure closed at 87, down 0.4 percent. The desk note captured at 5:14 PM ET described fixed-strike volatility dropping one to three points across the surface. Implied volatility for Monday was quoted at 6.5 percent, implying an intraday range of roughly 41 basis points, and the published one-day implied move was 0.51 percent with a five-day implied move of 1.26 percent.
The session was a quarterly options expiration day (per the positioning note captured for this run, unconfirmed against the verified forward calendar), so the volume figure should not be read as conviction. Elsewhere, crude fell 1.18 percent and the captured market wrap headline described ten-year yields rising, with no level or quote time captured; the dollar index was NOT CAPTURED IN THIS RUN.
4.6 Institutional Positioning
The weekly commitments data for the week ending September 15, covering the index contract and the volatility index, was published at 4:21 PM ET Friday, after the settlement. This run captured the existence of those releases but not their component figures, so this outlook makes no claim about speculator net length or the direction of the week's change. That is recorded as a coverage gap; no estimate is substituted.
Contract-level participation reads as follows: session volume of 1,288,568 against open interest of 1,888,650, a turnover ratio of 68.2 percent. On a quarterly expiration day (per the positioning note captured for this run, unconfirmed against the verified forward calendar) that ratio is consistent with roll and expiration mechanics and says nothing about fresh directional accumulation. Open interest of 1.89 million contracts is the largest of the four instruments by a wide margin and reflects the index contract's role as the primary institutional hedging vehicle.
Options positioning context
Positioning for this instrument is read directly from the cash index, which is the advantage ES has over the other three. All values below are cash-domain.
Flow on the session was negative at the index level and positive at the single-stock level. The desk note reported index hedging flow at minus 5 billion dollars of delta, dominated by same-day expiry activity, which points to expiration unwinds. Single-stock flow within the same index registered plus 3 billion dollars driven by longer-dated call buying. The minus 6 billion dollar reading in the 45 minutes after the open is attributed in the same commentary to the mechanical hedge unwind from the 36,000 long puts and 24,000 short calls expiring at the SPX 7,700 strike at 9:30 AM ET.
The published positioning table for the cash index, computed against a reference price of 7,637 which is the prior session close, reads as follows. The primary gamma concentration strike sits at SPX 7,650 and the modeled volatility threshold also at SPX 7,650; the call-side hedging boundary sits at SPX 7,800 and the put-side support base at SPX 7,500; the modeled gamma-flip level sits at SPX 7,593. The source publishes its own futures pair for these values, quoting the primary gamma concentration strike and the modeled volatility threshold at 7,719.35, the call-side boundary at 7,869.35, the put-side base at 7,569.35 and the modeled gamma-flip level at 7,662.35. Those futures equivalents carry the source's own supplied offset of 69.35 points, whose timestamp and basis methodology were not captured; it is neither the 61.76 point basis measured for this session nor the 69.49 prior-session basis measured by our method, so it is described only as the source's supplied offset. The pair is quoted verbatim for that reason and is not reconciled against the SPX equivalents used elsewhere.
The observation that matters is the pin. The cash index closed at 7,650.74, within one point of the primary gamma concentration strike at SPX 7,650. Sitting on the largest gamma concentration is the configuration in which dealer hedging dampens movement in both directions, and it is consistent with the very low implied move for Monday. The gamma index for the cash index reads positive at 0.735, gamma tilt reads 1.037, gamma notional reads positive at 110.179 million dollars, and the 25 delta risk reversal reads minus 0.042. Call volume of 864,222 against put volume of 1,267,000 and call open interest of 10.985 million against put open interest of 15.415 million both show a put-heavy book, which is ordinary for an index used primarily for hedging.
The published implied one-day move band is SPX 7,602.98 to 7,680.92, and the key support and resistance strikes published for the cash index are 7,650, 7,600, 8,000 and 7,700. The desk note edition used here is the PM Note of Friday, September 18, 2026 at 5:14 PM ET; its standing-note level summary was not captured in this run and is not quoted.
One data-quality note is recorded deliberately. The positioning source's console reported a current price of 7,658.65 for the index against a previous close of 7,637.76, a gain of 0.27 percent, which does not reconcile with the 0.17 percent gain reported by the quote provider or with the 7,651 close stated in the desk note text. The quote provider's published change reproduces 7,650.74 by derivation and the desk note corroborates it to the nearest point at 7,651, so that derived value is used throughout, and the console reading is treated as a later or differently-timed print and excluded. A derived close is not a direct price receipt, and it is labelled as derived at its first occurrence above.
Night Session (6:00 PM ET Sunday to 3:00 AM ET Monday, Globex/Asia)
This is a Friday close, and the forecast addresses the Sunday reopen and the Monday session. Two full days of headline exposure separate Friday's 7,712.50 settlement from the first Monday print, including the post-settlement Middle East reports described in section 4.3 and a Chinese rate decision on Saturday evening, per the news-feed calendar captured for this run, unconfirmed against the verified forward calendar. Gap levels in both directions are given below.
The contract reopens at 6:00 PM ET Sunday. The Chinese one-year and five-year loan prime rates will already have been published at 9:00 PM ET Saturday, with calendar forecasts of 3 percent and 3.5 percent against previous values of 3.00 percent and 3.50 percent, per the shared news-feed calendar capture in the CL and GC packages, unconfirmed against the verified forward calendar.
Gap levels both ways. An upside gap through the supply shelf at 7,731.03 to 7,734.88 (SPX 7,669 to 7,673) and above the session high at 7,739.25 (SPX 7,677) would negate the Primary Setup before it triggers and put the first pivot resistance at 7,742.83 (SPX 7,681) in play. A downside gap beneath the demand shelf at 7,680.34 to 7,674.51 (SPX 7,618 to 7,613) would run the setup's targets without offering the entry. The 14-day average true range of 75.81 means a reopen anywhere between roughly 7,636.69 and 7,788.31 is within one average day of Friday's settlement, although the 6.5 percent implied volatility quoted for Monday argues for a materially smaller realised move than that.
London Session (3:00 AM to 8:00 AM ET Monday)
European hours bring the first sustained liquidity of the week. The European Central Bank's Kazimir speaks at 4:30 AM ET (per the news-feed calendar captured for this run, unconfirmed against the verified forward calendar), the only European item on the calendar captured for Monday. The practical reference through this window is the pivot point at 7,708.92 (SPX 7,647), which the settlement sits 3.58 above. European hours frequently define the day's balance point in this contract, and an approach toward the supply shelf during that window is the cleanest presentation the Primary Setup can get.
Morning Session (9:30 AM to 12:00 PM ET Monday, RTH Open)
The calendar captured for Monday contains no United States economic data release. Goolsbee speaks at 6:30 AM ET, ahead of the cash open, and the Bank of Canada's Macklem speaks at 11:20 AM ET, per the news-feed calendar captured for this run, unconfirmed against the verified forward calendar. With no data anchor, a 6.5 percent implied volatility and a cash index pinned to its largest gamma concentration, the opening hours are likely to be quiet by recent standards.
The level map is symmetrical and dense on both sides. Overhead: the computed target price at 7,726.53 (SPX 7,665), then the three-reference supply shelf at 7,731.03, 7,733.95 and 7,734.88 (SPX 7,669 to 7,673), then the session high at 7,739.25 (SPX 7,677) and the first pivot resistance at 7,742.83 (SPX 7,681). Beneath: the four-value confluence at 7,708.92, 7,707.25, 7,706.74 and 7,706.57 (SPX 7,647 to 7,645), then the 9-day average crossing at 7,686.59 (SPX 7,625), then the five-value demand shelf at 7,680.34 through 7,674.51 (SPX 7,618 to 7,613).
Afternoon Session (12:00 PM to 4:00 PM ET Monday)
The afternoon carries no United States auction or data set-piece on the captured calendar, and the Reserve Bank of Australia's Hunter speaks at 3:00 PM ET, per the news-feed calendar captured for this run, unconfirmed against the verified forward calendar. Tuesday's pivot ladder is recomputed from Monday's high, low and settlement together, so its direction cannot be inferred from Monday's close alone. What Monday's close does determine on its own is the 20-day study: a close above the 20-day average at 7,733.95 (SPX 7,672) would flip the composite's short-term sell study into a week carrying three central bank speakers and a two-year auction on Tuesday (per the news-feed calendar captured for this run, unconfirmed against the verified forward calendar), while a close beneath the demand shelf at 7,674.51 (SPX 7,613) would open the second pivot support grouping near 7,644.67 (SPX 7,583).
Night Session Forward (6:00 PM ET Monday)
Residual bias into the Monday evening reopen carries toward Tuesday's speaker and auction sequence, with Williams at 10:05 AM ET, Jefferson at 10:20 AM ET, Barkin at 1:00 PM ET and the two-year note auction at 1:00 PM ET, per the news-feed calendar captured for this run, unconfirmed against the verified forward calendar. The Reserve Bank of Australia's Bullock speaks at 11:10 PM ET, per the news-feed calendar captured for this run, unconfirmed against the verified forward calendar. The front-end auction is the week's most direct scheduled risk to equity multiples.
Expected Range (Monday Full Session)
Low-range scenario: the first pivot support at 7,678.58 (SPX 7,617) to the first pivot resistance at 7,742.83 (SPX 7,681), a width of 64.25, or 0.84 times the 14-day average daily range of 76.23
Mid-range scenario (most likely): the one standard deviation support at 7,674.51 (SPX 7,613) to the one standard deviation resistance at 7,750.49 (SPX 7,688), a width of 75.98, essentially one 14-day average daily range
High-range scenario: the second pivot support at 7,644.67 (SPX 7,583) to the second pivot resistance at 7,773.17 (SPX 7,711), a width of 128.50, or 1.69 times the 14-day average daily range
Most Likely Path
The most likely path holds the balance area through Asian and European hours, works up toward the computed target price at 7,726.53 (SPX 7,665) and into the supply shelf at 7,731.03 to 7,734.88 (SPX 7,669 to 7,673) during the United States morning, and is capped there by the three trend references and the session high just above. From that shelf the path works back toward the four-value confluence near 7,708.92 to 7,706.57 (SPX 7,647 to 7,645) and, on a firm downside session, toward the 9-day average crossing at 7,686.59 (SPX 7,625). The alternative path, supported by the constructive positioning and the compressed volatility, simply pins near the settlement all session and resolves nothing, which the 41 basis point implied cash range makes a genuine possibility. Scenario weightings are analyst judgment and carry no derived frequency.
Monday Economic Calendar
The week opens quiet by design. The forward calendar captured for this run shows no United States economic data release scheduled for Monday, September 21, consistent with the weekly commentary published at 4:11 PM ET Friday describing the week ahead as a quiet calendar against fragile sentiment. That statement is scoped to what this run's calendar capture shows and makes no exhaustive claim about every possible release.
Working through the day in order: Asian hours carry the residue of the Chinese one-year and five-year loan prime rate decisions published at 9:00 PM ET Saturday, with calendar forecasts of 3 percent and 3.5 percent per the shared news-feed calendar capture in the CL and GC packages, unconfirmed against the verified forward calendar. European morning brings the European Central Bank's Kazimir at 4:30 AM ET, per the news-feed calendar captured for this run, unconfirmed against the verified forward calendar. The United States morning has Goolsbee at 6:30 AM ET ahead of the cash open, then the Bank of Canada's Macklem at 11:20 AM ET, per the news-feed calendar captured for this run, unconfirmed against the verified forward calendar. The afternoon carries no United States set-piece on the captured calendar; the Reserve Bank of Australia's Hunter speaks at 3:00 PM ET and Bullock at 11:10 PM ET, per the news-feed calendar captured for this run, unconfirmed against the verified forward calendar.
The single first-order event for this index falls on Tuesday, September 22, when three Federal Reserve speakers and a two-year note auction land together, with Williams at 10:05 AM ET, Jefferson at 10:20 AM ET, Barkin at 1:00 PM ET and the auction at 1:00 PM ET carrying a previous high yield of 4.204 percent and a previous bid-to-cover of 2.600, per the news-feed calendar captured for this run, unconfirmed against the verified forward calendar.
Further out: Wednesday, September 23 brings United States flash purchasing managers indices at 9:45 AM ET, with services forecast at 56 against a previous 56.5 and manufacturing at 53.6 against a previous 53.9, plus a five-year note auction at 1:00 PM ET, per the news-feed calendar captured for this run, unconfirmed against the verified forward calendar. Thursday, September 24 carries the Chinese state visit as an all-day item, initial jobless claims at 8:30 AM ET forecast at 206.5 thousand (previous 196 thousand per the NQ capture), new home sales at 10:00 AM ET forecast at 0.615 million (also on the verified forward calendar), and a seven-year note auction whose time was not captured in this run, per the news-feed calendar captured for this run, unconfirmed against the verified forward calendar. The verified forward calendar additionally lists for that Thursday the second-quarter international transactions report at 8:30 AM ET, the senior credit officer opinion survey at 2:00 PM ET and Costco's fiscal fourth-quarter results after the close at 5:00 PM ET. Friday, September 25 brings durable goods at 8:30 AM ET forecast at minus 0.3 percent (also on the verified forward calendar) and the final University of Michigan sentiment reading at 10:00 AM ET forecast at 47.8 (per the news-feed calendar captured for this run, unconfirmed against the verified forward calendar). The next Federal Open Market Committee rate statement is October 28 at 2:00 PM ET and the United States midterm elections fall on November 3, per the news-feed calendar captured for this run, unconfirmed against the verified forward calendar.
Primary Trade Setup
Direction: Short
Rationale: ES is the only instrument of the four down over five sessions, its multi-indicator composite reads 16 percent buy with the trend composite registering sell, and the negative directional component exceeds the positive one on both captured horizons with the 9-day index at 24.43 approaching the trending threshold. The settlement sits 21.45 beneath the 20-day average, and three independent trend references group inside 3.85 points immediately overhead. That supply shelf is the highest-quality level structure in this outlook, and fading it is the cleanest expression of the near-term weakness.
Entry Zone: 7,731 to 7,743 (SPX 7,669 to 7,681)
Stop Loss: 7,760 (SPX 7,698), above the one standard deviation resistance at 7,750.49 and above the 38.2 percent retracement from the four-week high at 7,745.41
Target 1 (T1): 7,709 (SPX 7,647), the four-value confluence where the pivot point at 7,708.92, Thursday's previous close at 7,707.25, the 38.2 percent retracement from the 13-week high at 7,706.74 and the 50-day average at 7,706.57 all sit inside 2.35 points
Target 2 (T2): 7,687 (SPX 7,625), the 9-day moving average crossing at 7,686.59
Target 3 (T3, extended): 7,675 (SPX 7,613), the demand shelf where Friday's session low at 7,675.00, the one standard deviation support at 7,674.51, the first pivot support at 7,678.58, the 5-day average at 7,678.30 and the four-week 38.2 percent retracement at 7,680.34 group inside 5.83 points, reached only if momentum extends through T2
Risk-to-Reward: Measured from the 7,737 midpoint of the entry zone against the 7,760 stop, risk is 23 points. Approximately 1:1.2 to T1, 1:2.2 to T2 and 1:2.7 to T3.
Invalidation: A settlement above 7,750.49, the one standard deviation resistance, clears the entire supply shelf and negates the thesis. On an intraday basis, acceptance above 7,739.25 without prompt rejection weakens it materially.
Stop distance versus volatility: The 23 point entry-to-stop distance is roughly 30 percent of the 14-day average true range of 75.81, a tight stop by this contract's standards, and the weekend gap exposure adds to the mismatch between stop distance and volatility. A specific condition applies to this setup: the cash index is pinned within one point of its primary gamma concentration strike and Monday's implied cash range is roughly 41 basis points, so a compression session that never reaches the entry zone is a realistic outcome.
Macro override: Any of the following invalidates the setup in real time regardless of price: a decisive trade-framework announcement ahead of the Chinese state visit (per the news-feed calendar captured for this run, unconfirmed against the verified forward calendar); a dovish shift from the Monday or Tuesday speakers; a continuation of the semiconductor leadership that drags the broad index through the supply shelf; or confirmed Middle East escalation following the post-settlement reports, which would lift crude and pressure equities in the opposite direction to Friday's linkage. A reclaim of the 20-day average at 7,733.95 on a closing basis flips the composite's short-term study and counts as a structural change.
Session-timing condition: The Sunday reopen at 6:00 PM ET carries two days of unpriced exposure and pricing is likely to be thin through the first hours of Globex trade. The cash open at 9:30 AM ET Monday provides the session's first liquid directional test of the level map above.
Sources and methodology
This outlook is built from our session review of the December E-mini S&P 500 contract, ESZ26, the December '26 contract, prepared after Friday's close on September 18, 2026. Computed pivot levels come from Friday's session high, low and settlement as read from the daily bar, which the chart series reproduces on all five fields. Every cash-index equivalent computed by us uses one measured basis of 61.76 points, the 7,712.50 settlement against the derived 7,650.74 cash close, rounded to 62; the prior session's basis on the same method was 69.49. Where the options positioning data publishes its own futures and cash pair, that pair is quoted as published with its 69.35 point offset and is never mixed with the measured basis. The daily bar does not time the low or the high, and no intraday path is asserted beyond the attributed expiration event at 9:30 AM ET.
Scenario ranges are analyst judgment; they carry no calibration. Contract months are kept separate throughout. Scheduled items marked unconfirmed come from the news-feed calendar captured for this run and were not verified against the verified forward calendar. The dollar index, the ten-year yield level, the weekly commitments component figures and the exact volatility index close were not captured in this run and no figure is stated for any of them.
Friday’s outlook for this contract is here. Outlooks for ES, NQ, GC and CL are collected on the market outlook page, and our forward trading record is on the performance statement.



