
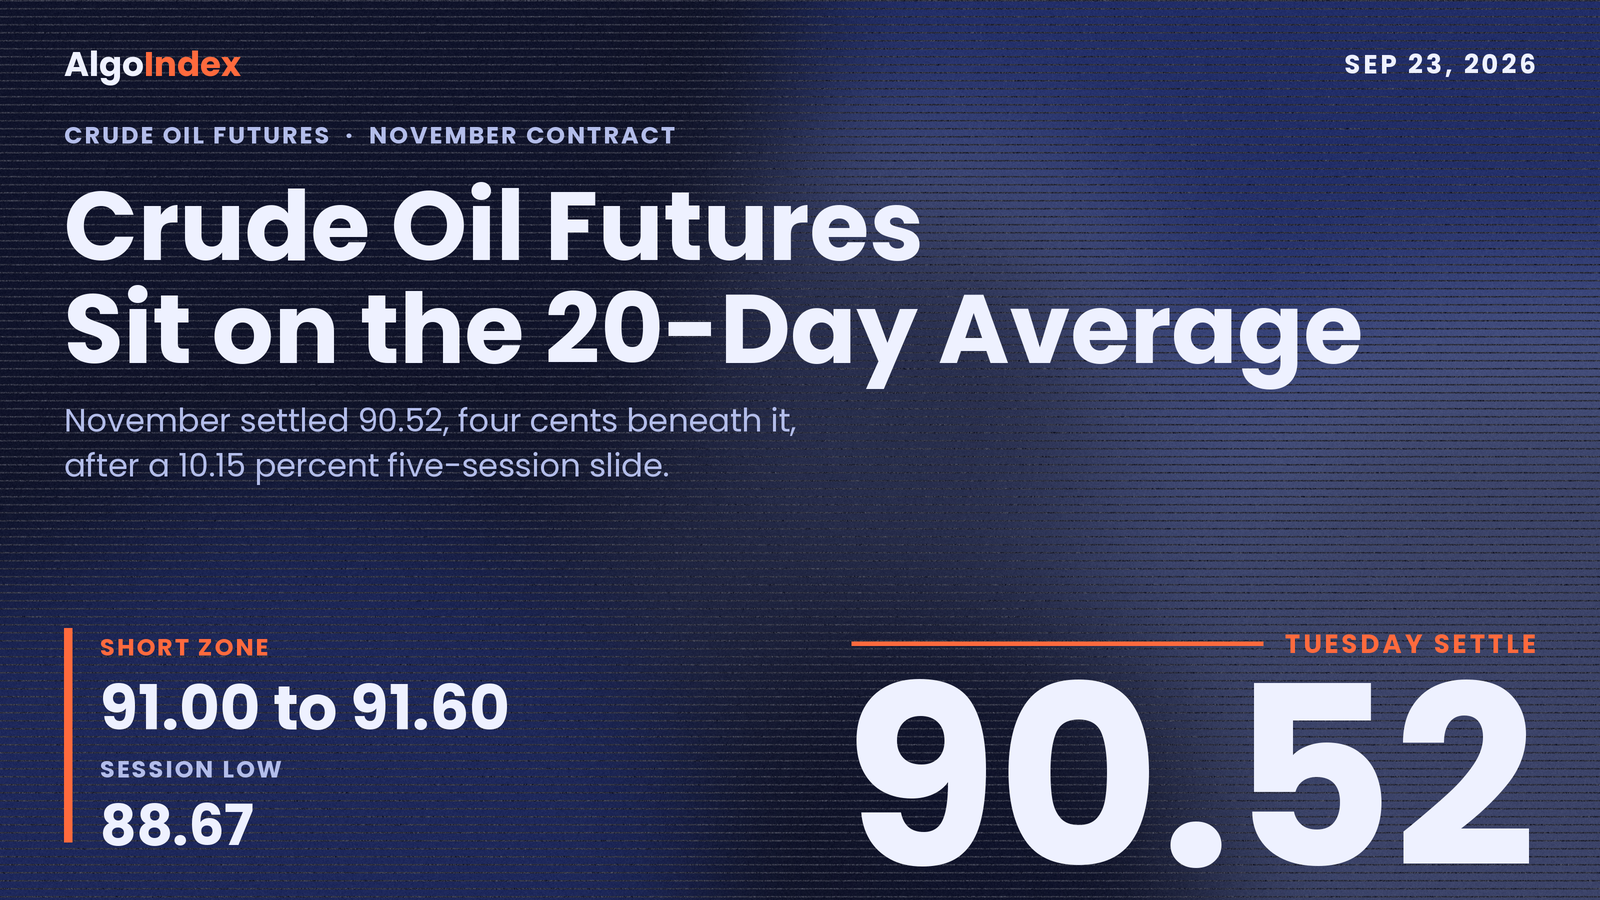
At 04:39 AM ET on Tuesday, a news-agency item said Iran has proposed reopening the Strait of Hormuz within seven days if the United States lifts its blockade of Iranian ports. By the 02:30 PM ET pit settlement the November crude contract had traded a 5.17 point band from 93.84 down to 88.67 and settled at 90.52, down 1.85 points or 2.00 percent from Monday's 92.37. Volume printed 404,225 contracts. That was the heaviest of the five sessions captured. The headline times and the price coincided, and because no time-stamped intraday series was captured, this outlook asserts no ordering between them.
Tuesday was the second leg of a slide that has now taken 10.23 points, or 10.15 percent, out of the contract in five sessions, from the 100.75 settle on 09/15 to 90.52. Every close since the 101.69 high has come in below the one before it. The afternoon brought more diplomacy. Remarks from the United Nations General Assembly rostrum, stamped between 03:32 PM and 03:41 PM ET, spoke of momentum toward an Iranian deal and of facilitating renewed flow through the Strait, and an item at 03:24 PM ET recorded a meeting between Iran's foreign minister and a United States envoy on the sidelines of the assembly. The driver was diplomatic. Every element of that sequence is unconfirmed reporting.
Expiry also handed over the front month. The October contract reached its final trading day, and the press reported it settling down 1.19 points, or 1.24 percent, so every level below belongs to November, CLX26, which now carries front-month status and 323,775 contracts of open interest at the prior reading. Wednesday's problem is a market that is stretched and still falling at once. The composite multi-indicator read has collapsed to 16 percent buy from 100 percent one week ago, yet the nine-day raw stochastic sits at 14.21 percent and the settle rests four cents beneath the 20-day average at 90.56. Then comes the 10:30 AM ET petroleum report. An industry-body estimate has already pointed to a 1.786 million barrel build against an official consensus draw of 0.69 million, a 2.476 million barrel gap. That print decides the day.
November WTI settled at 90.52 after a 5.17 point session from 93.84 to 88.67, closing at 35.8 percent of the range, four cents beneath the 20-day average at 90.56 and 49 cents beneath the 91.01 Pivot Point. Resistance arrives quickly. Overhead sit 93.35 Pivot R1, the 93.65 one standard deviation band and the 93.84 session high, then the 94.74 five-day average and the 94.94 band. Beneath sit the 90.12 half retracement and then the densest support in the instrument, 88.18 to 88.68, where the 88.67 low, the 88.68 published target price, the 88.47 retracement and 88.18 Pivot S1 stack up. Momentum is stretched. The nine-day directional index reads 40.27 with negative direction on top, while the 50-day average at 83.77 still sits 6.75 points below price. The primary setup is a short from 91.00 to 91.60, stop 93.90, targets 88.70, 87.40 and 85.85. The 10:30 AM ET petroleum report decides it.
Tuesday's short, graded against the bar
Tuesday's outlook set a short from 93.30 to 93.70, working a retest of the 93.59 Pivot Point, with a stop at 94.85, targets at 91.19, 89.97 and 87.56, and an invalidation on a sustained session above 93.59. Tuesday opened at 91.95, marked 93.84 and 88.67, and settled at 90.52. The high ran 14 cents through the top of the entry band, so the band traded. The stop was never reached. It sat 1.01 above the session high.
Settlement came in 2.78 beneath the bottom of the entry band and 67 cents beneath the first target at 91.19, and the 88.67 low printed under both 91.19 and the second target at 89.97 while stopping 1.11 short of the third at 87.56. Set against the completed bar, the published band sat inside Tuesday's range, the stop was never reached and the settle finished beyond the first objective. That comparison has one limit. No intraday series was captured, so whether 91.19 and 89.97 printed after the band traded or before it cannot be established from a daily bar, and this outlook scores no target as hit. The 93.84 high did poke 25 cents through the 93.59 pivot, and the session then settled 3.07 beneath it, short of the sustained session the invalidation required.
Our range work was too narrow on the downside. The same outlook put the most likely Tuesday at 90.80 to 93.60 and the high-range case at 89.40 to 95.40; the 88.67 low undercut the lower edge of even the widest scenario by 73 cents, and it stopped five cents above the 88.62 lower edge of the one-average-true-range envelope printed beside those scenarios. That miss goes on the record. Its macro override named an inventory build against the draw consensus as the thing that would accelerate the short, and that print is still ahead, at 10:30 AM ET on Wednesday, with the industry-body estimate already pointing to a build.
Stretched to the downside, still trending lower
Last week's bar says the most. The prior week, September 14 through September 18, spanned 101.69 at the high and 94.64 at the low, and Tuesday's 90.52 settle sits beneath the whole of it. Crude has vacated that range. The 52-week and 13-week highs are the same 101.69 print, set on 09/15/26, which puts the entire decline within seven sessions of the year's highest trade. No prior-quarter high or low was captured, so the 13-week extremes stand in: the settle is 11.17 points beneath the 101.69 high and 23.43 points above the 67.09 low of 07/02/26.
Four cents. That is the gap between the settle and the 20-day average at 90.56, the one medium-horizon line the contract is touching, and it is neither a decisive loss nor a hold. Wednesday resolves it one way or the other. The full stack runs 5-day 94.74, 20-day 90.56, 50-day 83.77, 100-day 81.00, 200-day 73.63 and a year-to-date average of 75.34, so price sits 4.22 points under the 5-day and 6.75, 9.52 and 16.89 points above the 50-day, 100-day and 200-day. The projection grid puts Wednesday's crossing prices at 95.94 for the 9-day, 92.21 for the 18-day and 85.17 for the 40-day. That gap to 95.94 is why a bounce here can travel several points without changing anything structural.
Six closes tell the swing: 100.75, 97.51, 97.23, 96.08, 92.37 and 90.52, each beneath the last. Daily travel has started to shrink, though. Monday spanned 97.22 to 91.19, a 6.03 point band, and Tuesday 5.17, a contraction of 0.86 points or 14.26 percent. Direction intact, amplitude compressing. That is a step toward exhaustion, measured against Monday; Tuesday's 5.17 still towers over the 4.12 point 14-day average daily range. The retracement grid sits close underneath. The 38.2 percent retracement from the 13-week high is 88.47, the 38.2 percent retracement from the four-week low is 87.38, and the 50 percent line of the four-week range at 90.12 is 40 cents beneath the settle, the nearest grid line of any kind.
Momentum has cratered on the short horizon. The composite multi-indicator read published for Wednesday is 16 percent buy, strength weak, direction at the weakest grade the provider publishes, although the composite indicator itself still reads buy. Beneath it the short-horizon group averages 40 percent sell. The medium-horizon group reads 25 percent buy and the long-horizon group 67 percent buy. Prior readings were 48 percent buy at Monday's close, 100 percent one week ago and 80 percent one month ago. From 100 to 16 in five sessions. Relative strength reads 45.27 on the 9-day, 51.92 on the 14-day after a 3.83 point drop, 54.70 on the 20-day, 55.74 on the 50-day and 55.19 on the 100-day, and the 14-day grid puts its neutral 50 line at 89.56, with 30 at 72.27 and 70 at 105.58. The settle sits 96 cents above neutral.
Stochastics carry the stretch. The 9-day raw reading is 14.21 percent, its smoothed line 29.01 and its signal 48.36; the 14-day raw is 29.17 percent with 48.86 and 63.71; the 20-day raw still holds 51.75. The published grid has the 14-3 day raw stochastic reaching its 20 percent threshold at 89.07 and its 30 percent threshold at 90.65. The settle sits between them.
Direction splits by horizon, and this is the sharpest disagreement in the instrument. On the 9-day the directional index reads 40.27 with negative direction at 22.72 over positive at 19.61. On the 14-day the index is 32.90, but positive direction at 23.11 still leads negative at 19.87, and on the 20-day the index is 26.05 with positive at 24.62 over negative at 18.78. Crude is trending on every horizon measured. Only the shortest has flipped lower. Historic volatility runs 48.95 percent on the 9-day, 42.08 on the 14-day and 40.73 on the 20-day.
Volatility sets the scale. The 14-day average true range stands at 3.85 points, or 4.25 percent, and the 14-day average daily range at 4.12 points, or 4.55 percent; the 9-day readings are wider at 4.15 and 4.79, while the 20-day and 50-day average true ranges read 3.64 and 3.22. Tuesday's 5.17 beat all of them. A one-range projection from 90.52 on the average true range frames Wednesday between roughly 86.67 and 94.37, and on the average daily range between roughly 86.40 and 94.64. The published deviation bands are tighter on the downside: one deviation spans 87.39 to 93.65, two spans 86.10 to 94.94 and three spans 85.11 to 95.93.
Diplomacy, a build estimate and a record crack spread
Read the headline sequence in order and the weight of it points one way. The 04:39 AM ET item carried the Iranian proposal on the Strait. At 01:52 PM ET a statement said United States officials had met an Iranian delegation for three hours. At 03:24 PM ET came the meeting between Iran's foreign minister and a United States envoy, and the rostrum remarks between 03:32 PM and 03:41 PM ET spoke of momentum for a deal and of facilitating renewed flow through the Strait, while separately raising the possibility of striking a named Iranian site. At 03:54 PM ET Iran's armed forces dismissed the remarks as domestic propaganda. All of it is unconfirmed reporting. Crude read the balance as constructive for supply and bearish for price, and the asymmetry for Wednesday follows: the de-escalation premium is now partly priced, the escalation risk is unpriced, and a headline reversal would meet a market carrying materially less protection than it held one week ago. Nothing in this run captured any Russia, Ukraine or Venezuela development.
Inventories landed after the close. The industry-body estimate, stamped 04:46 PM ET, put crude stocks up 1.786 million barrels against a forecast draw of 0.5 million and a prior build of 7.1 million. Products went the other way. Gasoline stocks were estimated down 2.16 million barrels against a prior build of 1.5 million, and distillates down 2.164 million against a prior build of 1.6 million, both stamped 04:56 PM ET. The storage hub was estimated to have built 2.082 million barrels against a prior draw of 0.246 million. Bearish crude, bullish products. Because the estimate arrived more than two hours after the 02:30 PM ET pit settlement, it corroborates Tuesday's price and cannot explain it. The official weekly petroleum status report follows at 10:30 AM ET on Wednesday, covering the week ending on the eighteenth, with a consensus draw of 0.69 million barrels against a prior draw of 0.640 million.
Refiners are the counterweight. Press commentary attributed Tuesday's partial recovery off the session low to the crude crack spread reaching a record high, which pays refiners to buy crude and turn it into gasoline and distillate, and that fits the product draws in the estimate. It is the mechanism most likely to put a base under crude on a further decline. Gasoline futures on the expiring October contract were reported up 0.51 percent even as crude fell. No refinery utilisation figure and no seasonal demand series were captured. A longer-horizon note from an energy trade source, stamped 05:01 PM ET, projected global energy demand rising 60 percent by 2060 on emerging-market growth. Background only.
Supply policy is a blank for Wednesday. No producer-group quota decision, compliance table or Saudi or Russian signal was captured, and the verified forward calendar places the next producer-group meeting on October 4. Iraq filled the gap. Ministerial comments stamped between 04:14 PM and 04:39 PM ET put current Iraqi exports above 3 million barrels per day, August exports at 70 million barrels and Kurdistan field production at 200,000 barrels per day, and flagged a plan to lift exports through the Turkish Mediterranean terminal above 600,000 barrels per day by trucking crude from southern fields to the northern hub. Incremental supply, into a market already marking its risk premium down.
The dollar pushed in the same direction. The dollar index closed at 100.601, up 0.172 points or 0.17 percent, inside a 100.307 to 100.703 range, and press commentary called it a seven-week high. The ten-year yield closed at 4.97 percent against Monday's 4.96 percent after a 4.93 to 4.98 range. Equities took the other side: the Nasdaq-100 cash index closed at a record 30,732.40, up 250.05 points or 0.82 percent, the S&P 500 cash index finished at 7,764.64 against 7,764.70, unchanged for practical purposes, and the volatility index fell 0.66 points, or 4.44 percent, to 14.21. Gold's December contract settled at 4,376.4, down 7.5 points or 0.17 percent. Brent's November contract settled at 99.25, down 1.09 points or 1.09 percent, after trading down to 97.36, and its close beneath the round 100 handle is the cleanest cross-check on the crude move. The day's market commentary and press coverage both describe a chain running from cheaper crude to easier inflation expectations to firmer equity appetite, with crude at its origin.
Positioning comes with a timing caveat. The commitments report as of September 15, 2026 is the week of the 101.69 high, so it predates the entire decline. It showed managed money long 221,896 contracts against short 115,617, a net long of 106,279, after adding 2,936 longs and 8,388 shorts on the week. Non-commercials held 371,202 long against 235,297 short, having added 21,084 long and 21,758 short. Commercials held 895,203 long against 1,060,061 short, a net short of 164,858, with 6,117 added long and 4,790 added short, and swap dealers were the most one-sided group at 118,240 long against 590,507 short. Read as a starting condition, that managed-money net long is the length that has been under pressure all week through a 10.15 percent drop, and the mechanical reason a diplomatic headline could produce an outsized move. Open interest of 323,775 on November gives the scale. No dealer-positioning dataset was read for crude: no gamma map, no options concentration levels and no flow attribution were read, none is borrowed from another instrument, and that absence carries no implied neutral reading.
The trade map for Wednesday
Overhead, the 91.01 Pivot Point is the first ceiling of consequence, 49 cents above the settle. Just beneath it the 20-day average at 90.56 has become a pivot of its own after the four-cent miss, so 90.52 to 91.01 works as one decision pocket. Above that, 93.35 Pivot R1, the 93.65 one standard deviation band and the 93.84 session high form the zone where a failed bounce would most naturally fail. The 94.74 five-day average and the 94.94 two deviation band come next. At 95.93 the three deviation band sits one cent under the 95.94 nine-day crossing price, two separately computed references landing together. Pivot R2 at 96.18 marks the top of the practically reachable band for one session, the stochastic thresholds at 96.96 and 98.54 bracket 98.52 Pivot R3, and 101.69 is the extended structural ceiling. It is no Wednesday objective.
Beneath the settle, 90.12 is the immediate support and the first line a continuation must break, with 89.07 a momentum marker under it. The group that matters is 88.18 to 88.68. There Tuesday's 88.67 low and the 88.68 published target price sit on top of each other, the 88.47 retracement from the 13-week high sits twenty cents lower, and 88.18 Pivot S1, 49 cents beneath the low, closes it out. It is the most densely confirmed support in the instrument. Lower down the structure thins: 87.39 one deviation support beside the 87.38 retracement, 86.10 and 85.84 Pivot S2, then 85.11 beside the 85.17 forty-day crossing, with 84.39 and 83.01 Pivot S3 as the extended downside. The one-month low at 78.54, set on 08/26/26, is a long way off.
The primary setup is a short from a retracement into 91.00 to 91.60, stopped above Tuesday's session high. The case rests on three readings: the composite fell from 100 percent buy one week ago to 16 percent with the weakest direction grade, the nine-day directional system flipped negative, and the settle sits four cents beneath the 20-day average after vacating the entire prior weekly range. A retracement into the pivot band offers a short at better prices than the close. The stop at 93.90 sits six cents over the 93.84 high, which also clears 93.35 Pivot R1 and the 93.65 one deviation band. The first objective is the session low and the published target price, the second the one deviation support and four-week retracement, the third 85.84 Pivot S2.
Globex has already reopened lower. The new session opened at 89.89 and has traded 89.63 to 90.00, holding beneath Tuesday's settle; no timestamped series was captured for that window, so the reopen is described here without attribution to the inventory estimate. Australian flash purchasing-manager surveys print at 07:00 PM ET with priors of 52.0 on manufacturing, 53.2 on services and 52.7 on the composite, per the news-feed calendar and unconfirmed, and the captured calendar places the Japanese flash surveys in Wednesday evening's block, also per the news-feed calendar and unconfirmed. Neither moves crude on its own. Bias is mildly lower, with 90.12 the first reference above and 89.07 beneath, and the expected Globex band is roughly 89.00 to 90.60.
London matters mainly through the dollar. European flash surveys run from 03:15 AM ET for France, 03:30 AM ET for Germany, 04:00 AM ET for the eurozone aggregate and 04:30 AM ET for the United Kingdom, with the eurozone composite forecast at 51.7 against a prior 52.0 and German manufacturing at 54.0 against 54.3, and European Central Bank speakers appear at 03:00 AM and 04:50 AM ET. A soft eurozone composite firms the dollar and adds to Tuesday's headwind; an upside surprise relieves it. Bias is neutral with a downward lean, the expected band roughly 89.20 to 90.80, and a reclaim of 91.01 in Europe would change the character of the morning.
New York is the decisive window. United States flash surveys print at 09:45 AM ET, composite forecast 54.9 against a prior 56.0, services 55.9 against 56.5 and manufacturing 53.7 against 53.9, per the news-feed calendar and unconfirmed. A Bank of England deputy speaks at 10:00 AM ET and a Federal Reserve governor at 10:05 AM ET. Then the 10:30 AM ET report. A confirmed official build would validate the bearish read and open the 88.18 to 88.68 group; a draw in line with the 0.69 million consensus would set up a squeeze toward 91.01 and then 93.35. Expected band roughly 88.40 to 92.00.
The afternoon carries a five-year note auction at 01:00 PM ET, where the prior auction stopped at a 4.393 percent high yield with a 2.370 bid-to-cover, and European Central Bank speakers at 12:00 PM and 12:30 PM ET, per the news-feed calendar and unconfirmed. Crude settles at 02:30 PM ET. A weak auction that lifts yields and the dollar together compounds pressure on the barrel, and a strong one relieves it. Absent a headline, the afternoon usually resolves toward whichever side of 91.01 the morning ended on. Expected band roughly 88.80 to 91.80.
Into the evening, residual bias depends almost entirely on where the inventory print left the contract relative to 88.18 to 88.68. Japanese flash surveys at 08:30 PM ET and Australian labour data at 09:30 PM ET, unemployment forecast at 4.5 percent and employment change at 20,000 against a prior decline of 15,800, provide the overnight texture. Thursday at 08:30 AM ET is the larger forward anchor. Weekly jobless claims print then, with a consensus of 200,000 against a prior 196,000, and Thursday also carries a state visit the market will read for trade signalling, per the news-feed calendar and unconfirmed.
Three scenarios frame the full session. They run 89.20 to 91.60 on the low-range case, 88.40 to 92.30 on the mid-range case, which is the most likely, and 87.20 to 93.40 on the high-range case. The most probable path opens the pit session beneath the 91.01 pivot and drifts through the European morning unresolved. Then the 10:30 AM ET print decides. The heaviest weight sits on an official figure confirming at least part of the estimated build, which sends the contract through 90.12 and into 88.18 to 88.68. A hold there into the 02:30 PM ET settlement, with the crack spread still at a record and products drawing, produces a close in the upper half of the 88.40 to 92.30 band, away from its extreme. An official draw larger than consensus would reclaim 91.01 quickly and set up a test of 93.35.
Crude sits on the line it has spent the month above, with a record crack spread underneath and a firmer dollar overhead, and at 10:30 AM ET one number picks the winner.
The complete data picture
Every number behind Wednesday’s plan, charted first, then the full level lists, then the complete numeric reference underneath.
Full numeric reference, every remaining figure from the session review
Carried below in the review’s own order: the session summary from section 1, sections 2.1 to 2.6, the level notes behind sections 3.1 and 3.2, sections 4.1 to 4.6, the coverage note from section 5, the session-by-session forecast from section 6, the Wednesday calendar from section 7 and the primary setup from section 8.
3.1 Resistance and 3.2 Support, level notes
101.69 is the 52-week, 13-week and one-month high in a single print, set on 09/15/26. It is the extended structural ceiling and is not a Wednesday objective.
98.54 is the 14-3 day raw stochastic 80 percent threshold and 96.96 its 70 percent threshold; together they bracket 98.52, the third standard pivot resistance.
96.18 is the second standard pivot resistance and marks the top of the practically reachable band for a single session.
95.94 is the price at which the 9-day average would be crossed on Wednesday, and the three standard deviations resistance at 95.93 sits fractionally under it, two separately computed references one cent apart.
94.94 is the two standard deviations resistance and 94.74 the 5-day average; they form the shelf above the 93.35 to 93.84 zone.
93.84 is Tuesday's session high and caps the group with the one standard deviation resistance band at 93.65 and the first standard pivot resistance at 93.35, which makes 93.35 to 93.84 the natural place for a failed bounce to fail.
91.01 is the Pivot Point, 49 cents above the settle and the level that separates a constructive Wednesday from a continuation one.
90.56 is the 20-day average, which has become a pivot in its own right after the settle closed four cents below it, so the 90.52 to 91.01 band is a single decision pocket.
90.12 is the 50 percent retracement of the four-week range, the immediate support 40 cents beneath the settle and the first line a continuation must break.
89.07 is the 14-3 day raw stochastic 20 percent threshold, a momentum marker; the 30 percent threshold sits at 90.65.
88.67 to 88.68 is the confluence where Tuesday's session low and the published target price for Wednesday sit on top of each other. The 38.2 percent retracement from the 13-week high at 88.47 sits twenty cents beneath the low, and the first standard pivot support at 88.18 sits 49 cents beneath it, closing the group. The 88.18 to 88.68 grouping is the most densely confirmed support in the instrument and is where a Wednesday decline should first be tested.
87.39 is the one standard deviation support, alongside the 38.2 percent retracement from the four-week low at 87.38, a one cent confluence.
86.10 is the two standard deviations support and 85.84 the second standard pivot support.
85.11 is the three standard deviations support, beside the 40-day average crossing price at 85.17.
84.39 is the 50 percent retracement of the 13-week range and 83.01 the third standard pivot support; together they mark the extended downside.
78.54 is the one-month low, set on 08/26/26, the deepest structural reference and a long way from Wednesday.
1. Session summary
The November crude contract settled at 90.52 on Tuesday, down 1.85 points or 2.00 percent from Monday's 92.37 close, and the decline was the second leg of a slide that has now removed 10.23 points, or 10.15 percent, from the contract in five sessions. The session traded a 5.17 point band between 93.84 and 88.67 and closed at 35.8 percent of that range, nearer the low than the high, a weak close by position even though the settle recovered 1.85 points off the session trough. Volume printed 404,225 contracts, the heaviest of the five sessions captured, and open interest stood at 323,775 at the prior reading. This is the session in which the November contract inherited front-month status: the October contract reached its final trading day on Tuesday and the press reported it settling down 1.19 points, or 1.24 percent.
The dominant driver was diplomatic rather than fundamental. A news-agency report early Tuesday said Iran has proposed reopening the Strait of Hormuz within seven days if the United States lifts its blockade of Iranian ports, and that item carried a 04:39 AM ET stamp on the news feed. A second sequence landed in the afternoon, when remarks from the United Nations General Assembly rostrum stamped between 03:32 PM and 03:41 PM ET spoke of momentum toward an Iranian deal and of facilitating renewed flow through the Strait. A separate item at 03:24 PM ET recorded a meeting between Iran's foreign minister and a United States envoy on the sidelines of the assembly. The price path and the headline times coincided; no time-stamped intraday price series was captured this run, so no causal ordering is asserted here.
The structural contradiction heading into Wednesday is between momentum and position. The composite multi-indicator read has collapsed to 16 percent buy with weak strength and the weakest direction reading published, against 100 percent buy one week ago and 48 percent buy at Monday's close. The nine-day directional index sits at 40.27 with negative direction at 22.72 above positive direction at 19.61, a trending market pointed lower on the short horizon. Yet the nine-day raw stochastic has fallen to 14.21 percent and the 14-day to 29.17 percent, the contract sits well above its 50-day average at 83.77, and the settle held above the 88.67 session low by a margin. A market can be both extended to the downside and still in an intact downtrend, and that is where crude closed.
The primary setup is a short from a retracement into the 91.00 to 91.60 band, stopped above Tuesday's session high, with the first objective at the session low and the extended objective at the second standard pivot support.
2.1 Intraday and Session Review
The completed Tuesday session opened at 91.95, already 42 cents beneath Monday's 92.37 settle, marked a high of 93.84 and a low of 88.67, and settled at 90.52. No intraday series was captured this run, so the order in which those extremes were reached is not asserted and no path claim appears anywhere in this outlook. The daily bar does establish the geometry: the high failed 90 cents beneath the 5-day average at 94.74, the settle finished 1.43 points beneath the open, and the 1.85 point distance from the low to the settle happens to equal the 1.85 point decline against Monday's settle, which is coincidence and not structure.
The session extremes are the completed-session inputs behind the published pivot ladder rather than an independently read bar, back-solved from the outer pivot pairs and verified two ways. The third resistance point minus the third support point divided by three returns 5.17, and the second resistance point minus the second support point divided by two returns the same 5.17, so the range is unambiguous. Adding three times the pivot point and subtracting the settle gives the high plus low sum, and the resulting pair of 93.84 and 88.67 reproduces all seven published rungs to the cent. The data provider's own published daily record for the contract returns 91.95, 93.84, 88.67, 90.52 on 404,225 contracts, and its performance page separately names 88.67 as the five-day period low made on 09/22/26, so the back-solve and the published record agree. Both are surfaces of the same data provider and not independent sources, so they confirm internal consistency and not the underlying quote.
Close quality was poor without being capitulatory. A settle at 35.8 percent of the day's range with the heaviest volume of the week is the shape of a market where sellers controlled the session and buyers defended a level rather than reclaimed one. The 88.67 low is the number that matters on Wednesday, because it is simultaneously the session trough, the five-day period low and a near-exact match for the published target price of 88.68 for the coming session.
2.2 Daily Structure
The prior week, September 14 through September 18, spanned 101.69 at the high and 94.64 at the low. Tuesday's settle at 90.52 is therefore below the entire prior weekly range: the contract has not merely pulled back inside a range, it has vacated the one it built the week before. The 52-week high of 101.69 and the 13-week high of 101.69 are the same print, set on 09/15/26, which places the whole of the current decline within seven sessions of the contract's highest trade of the year.
For the quarterly reference the 13-week extremes serve as the available proxy, because no prior-quarter high or low was captured this run. The 13-week high stands at 101.69 and the 13-week low at 67.09, set on 07/02/26. Tuesday's settle sits 11.17 points beneath the 13-week high and 23.43 points above the 13-week low.
The 20-day average at 90.56 is the single most interesting interaction on the daily frame. The settle at 90.52 is four cents below it, neither a decisive loss of the average nor a hold; the market sits on the line it has spent the month above. Wednesday resolves it in one direction or the other, and the resolution is worth more than the four cents suggests, because the 20-day is the only medium-horizon average the contract is currently touching. The 50-day at 83.77 sits 6.75 points lower and the 100-day at 81.00 lower still.
2.3 4-Hour and Swing Structure
The five-session sequence read from the published daily record is an unbroken series of lower closes after the 09/15 peak: 100.75, then 97.51, then 97.23, then 96.08, then 92.37, then 90.52. Daily travel narrowed across the last two sessions: Monday's range spanned 97.22 to 91.19, a 6.03 point band, and Tuesday's 93.84 to 88.67, a 5.17 point band, a contraction of 0.86 points or 14.26 percent. The lower highs and lower lows are supported by the bars while expanding travel is not: a downtrend whose direction is intact but whose daily amplitude has begun to compress, a step toward exhaustion. The counterweight is that 5.17 is still well above the 4.12 point 14-day average daily range, so the compression is against Monday and not against the contract's own recent norm.
The retracement grid published for Wednesday puts the 38.2 percent retracement from the 13-week high at 88.47 and the 38.2 percent retracement from the four-week low at 87.38. Both sit immediately beneath Tuesday's low, so the first structural shelf a continuation would reach is close. The 50 percent retracement of the four-week range at 90.12 sits 40 cents beneath the settle and is the nearest grid line of any kind.
2.4 Moving Averages
The average stack is fully positive in the medium and long horizons and has broken in the short. The 5-day average stands at 94.74, the 20-day at 90.56, the 50-day at 83.77, the 100-day at 81.00, the 200-day at 73.63, and the year-to-date average at 75.34. Tuesday's 90.52 settle sits 4.22 points beneath the 5-day and four cents beneath the 20-day, while sitting 6.75 points above the 50-day, 9.52 points above the 100-day and 16.89 points above the 200-day.
The projection grid gives the prices at which each average would be crossed on Wednesday: 95.94 for the 9-day, 92.21 for the 18-day and 85.17 for the 40-day. The gap between spot and the 9-day crossing measures how far the short end of the stack has run ahead of price, and it is the mechanical reason a bounce in this market can travel several points without changing anything structural.
2.5 Oscillator and Trend Readings
Relative strength readings sit at 45.27 on the 9-day, 51.92 on the 14-day, 54.70 on the 20-day, 55.74 on the 50-day and 55.19 on the 100-day. The 14-day reading fell 3.83 points on the session. The published 14-day relative-strength grid places the 50 percent line at 89.56, the 30 percent line at 72.27 and the 70 percent line at 105.58, so the contract settled 96 cents above the level at which the 14-day reading would print neutral.
The 9-day raw stochastic reads 14.21 percent with a smoothed line at 29.01 percent and its signal at 48.36 percent. The 14-day raw reads 29.17 percent with a smoothed line at 48.86 percent and signal at 63.71 percent. The 20-day raw is still above the midpoint at 51.75 percent. The published grid says the 14-3 day raw stochastic reaches its 20 percent threshold at 89.07 and its 30 percent threshold at 90.65, and the settle at 90.52 sits between them.
On the 9-day the directional index reads 40.27 with negative direction at 22.72 above positive direction at 19.61. On the 14-day the index reads 32.90 but positive direction at 23.11 still sits above negative direction at 19.87. On the 20-day the index reads 26.05 with positive at 24.62 over negative at 18.78. The market is strongly trending on every horizon measured, and the direction of that trend has flipped negative only on the shortest one. Historic volatility runs 48.95 percent on the 9-day, 42.08 percent on the 14-day and 40.73 percent on the 20-day.
The composite multi-indicator read published for Wednesday is 16 percent buy, with strength graded weak and direction graded weakest. The composite indicator itself still reads buy. Underneath it the short-horizon group averages 40 percent sell, the medium-horizon group 25 percent buy and the long-horizon group 67 percent buy. The prior readings were 48 percent buy at Monday's close, 100 percent buy one week ago and 80 percent buy one month ago. A fall from 100 percent buy to 16 percent buy inside five sessions is the clearest single number in the review.
2.6 Volatility and Expected Range
The 14-day average true range stands at 3.85 points, or 4.25 percent, with a 14-day average daily range of 4.12 points, or 4.55 percent. The 9-day average true range is wider at 4.15 points and the 9-day average daily range wider still at 4.79 points, while the 20-day average true range reads 3.64 and the 50-day 3.22. Tuesday's realised 5.17 point range was therefore substantially above every one of those measures.
A one-range projection from the 90.52 settle using the 14-day average true range of 3.85 points frames Wednesday between roughly 86.67 and 94.37. Using the 14-day average daily range of 4.12 the frame widens to roughly 86.40 and 94.64. The published standard-deviation bands are tighter on the downside and comparable on the upside: one deviation spans 87.39 to 93.65, two spans 86.10 to 94.94 and three spans 85.11 to 95.93.
4.1 OPEC and Supply Policy (Quotas, Compliance, Saudi and Russia Signals)
No producer-group quota decision, compliance table or Saudi or Russian policy signal was captured this run. The verified forward calendar places the next producer-group meeting on October 4, well outside the Wednesday window. This subsection rests on the absence of a captured source and not on an assessment, and nothing is asserted about producer policy for Wednesday.
What was captured on the supply side came from Iraq. Ministerial comments stamped between 04:14 PM and 04:39 PM ET put current Iraqi exports above 3 million barrels per day, August export volume at 70 million barrels, Kurdistan field production at 200,000 barrels per day, and flagged a plan to raise exports through the Turkish Mediterranean terminal above 600,000 barrels per day by trucking crude from southern fields to the northern hub. Taken together these are incremental supply headlines in a market already repricing a supply-risk premium downward.
4.2 Inventory Data (Crude Stocks, Gasoline, Distillates, Cushing, Strategic Reserve)
The industry-body inventory estimate landed after the close and is the single most actionable input for Wednesday. Crude stocks were estimated to have built 1.786 million barrels against a forecast draw of 0.5 million and a prior build of 7.1 million, stamped 04:46 PM ET. Gasoline stocks were estimated down 2.16 million barrels against a prior build of 1.5 million, and distillate stocks down 2.164 million barrels against a prior build of 1.6 million, both stamped 04:56 PM ET. The storage hub was estimated to have built 2.082 million barrels against a prior draw of 0.246 million.
That combination is bearish crude and bullish products, and it is consistent with the crack spread reaching a record high on Tuesday as reported in the press commentary. The estimate was published at 04:46 PM and 04:56 PM ET, more than two hours after the 02:30 PM ET pit settlement, so it is subsequent corroborating information and not an explanation of an earlier price outcome. The official weekly petroleum status report is scheduled for 10:30 AM ET on Wednesday with a consensus draw of 0.69 million barrels against a prior draw of 0.640 million. It covers the week ending on the eighteenth. The gap between the industry estimate of a 1.786 million build and the official consensus of a 0.69 million draw is 2.476 million barrels, and that gap is the first-order event for this instrument on Wednesday.
4.3 Geopolitical Backdrop (Middle East, Iran, Russia and Ukraine, Venezuela)
The geopolitical backdrop moved decisively toward de-escalation on Tuesday, and every element of it is unconfirmed reporting, not settled fact. The 04:39 AM ET item reported that Iran has proposed reopening the Strait of Hormuz within seven days if the United States lifts its blockade of Iranian ports. A 01:52 PM ET item recorded a statement that United States officials had met an Iranian delegation for three hours. A 03:24 PM ET item reported that Iran's foreign minister met a United States envoy on the sidelines of the General Assembly. The rostrum remarks between 03:32 PM and 03:41 PM ET spoke of momentum for a deal, of facilitating renewed flow through the Strait, and separately raised the possibility of striking a named Iranian site. Iran's armed forces responded at 03:54 PM ET dismissing the remarks as domestic propaganda.
The market read the balance of that sequence as constructive for supply and therefore bearish for price. The asymmetry for Wednesday is that the de-escalation premium is now partly priced while the escalation risk is not, so a headline reversal would be met by a market carrying materially less protection than it held one week ago. Nothing in this run captured any Russia, Ukraine or Venezuela development.
4.4 Demand and Refining (Refinery Utilisation, Crack Spreads, Seasonal Pattern)
The refining picture is the strongest part of the complex. Press commentary attributed Tuesday's partial recovery off the session low to the crude crack spread reaching a record high, which encourages refiners to buy crude and convert it into gasoline and distillate. That is consistent with the product draws in the industry-body estimate and it is the mechanism most likely to put a base under crude on a further decline. Gasoline futures on the expiring October contract were reported higher by 0.51 percent on the session even as crude fell.
No refinery utilisation figure was captured this run, and no seasonal demand series was read, so neither is asserted. A longer-horizon demand note from an energy trade source stamped 05:01 PM ET projected global energy demand rising 60 percent by 2060 on emerging-market growth, which is background and not a Wednesday input.
4.5 Dollar and Cross-Asset (Dollar Index, Commodities Complex, Equity Risk Appetite)
The dollar index closed at 100.601, up 0.172 points or 0.17 percent, having traded a 100.307 to 100.703 range, and press commentary described that as a seven-week high. A firmer dollar is a mechanical headwind for a dollar-denominated barrel, and on Tuesday it worked in the same direction as the diplomatic headlines.
The rest of the complex moved in the pattern a falling oil price produces. The ten-year yield closed at 4.97 percent, one basis point above Monday's 4.96 percent after a 4.93 to 4.98 range. The Nasdaq-100 cash index closed at 30,732.40, up 250.05 points or 0.82 percent, at a record. The S&P 500 cash index closed at 7,764.64 against 7,764.70 on Monday, unchanged for practical purposes. The volatility index closed at 14.21, down 0.66 points or 4.44 percent. Gold's December contract settled at 4,376.4, down 7.5 points or 0.17 percent. Brent's November contract settled at 99.25, down 1.09 points or 1.09 percent, having traded down to 97.36 intraday, and its close beneath the round 100 handle is the cleanest cross-check on the crude move.
The causal chain described in the day's market commentary and press coverage runs from cheaper crude to easier inflation expectations to firmer equity risk appetite, with crude as the origin of it.
4.6 Institutional Positioning (Commitments Data, Money Manager and Commercial Hedger, Speculator Length)
The positioning report as of September 15, 2026, the week of the 101.69 high and therefore before the entire decline, showed managed money long 221,896 contracts against short 115,617, a net long of 106,279. The change on the week was an addition of 2,936 to the long side against 8,388 added short. Non-commercials in aggregate held 371,202 long against 235,297 short, having added 21,084 long and 21,758 short. Commercials held 895,203 long against 1,060,061 short, a net short of 164,858, with 6,117 added long and 4,790 added short. Swap dealers were the most one-sided group at 118,240 long against 590,507 short.
The important caveat is timing. This snapshot is dated to the session of the contract high and has not been refreshed through the 10.15 percent five-session decline, so it describes the positioning that existed before the move. Read as a starting condition, a managed-money net long of 106,279 going into a 10 point drop is the length that has been under pressure all week, and it is the mechanical reason a diplomatic headline could produce an outsized move. Open interest at 323,775 on the November contract gives the scale.
5. No liquid options proxy
Crude is covered here without a positioning dataset. No dealer-positioning surface was read for this instrument, no gamma map, no options concentration levels and no flow attribution, and none is inferred from any other instrument. Every level in this outlook originates in published pivot arithmetic, published standard-deviation bands, published retracement and moving-average projections, or the back-solved session extremes described in section 2.1.
This is a statement about coverage, not about the existence of listed crude options: no such dataset was read, so no claim resting on one appears anywhere in this outlook. The equity-index outlooks for the same date carry a dealer-positioning section; its absence here is deliberate and should not be read as an implied neutral reading.
Night Session (6:00 PM ET Tuesday to 3:00 AM ET Wednesday, Globex and Asia)
The Globex reopen carries the industry-body inventory estimate released at 04:46 PM and 04:56 PM ET, and the new session has opened at 89.89 and traded between 89.63 and 90.00, holding beneath Tuesday's 90.52 settle. No timestamped series was captured for that window, so the reopen is described here and not attributed to the release. Australian flash purchasing-manager surveys print at 07:00 PM ET with prior readings of 52.0 on manufacturing, 53.2 on services and 52.7 on the composite, per the news-feed calendar and unconfirmed. The captured calendar places the Japanese flash surveys in Wednesday evening's block and not tonight's, per the news-feed calendar and unconfirmed. Neither is a crude catalyst in its own right. Bias is mildly lower with the 90.12 retracement line as the first reference above and 89.07 beneath. Expected Globex band roughly 89.00 to 90.60.
London Session (3:00 AM to 8:00 AM ET Wednesday)
European flash purchasing-manager surveys run from 03:15 AM ET for France, 03:30 AM ET for Germany, 04:00 AM ET for the eurozone aggregate and 04:30 AM ET for the United Kingdom, with the eurozone composite forecast at 51.7 against a prior 52.0 and German manufacturing at 54.0 against a prior 54.3. European Central Bank speakers appear at 03:00 AM and 04:50 AM ET. For crude the European window matters mainly through the dollar: a soft eurozone composite firms the dollar further and adds to Tuesday's headwind, while an upside surprise relieves it. Bias neutral with a downward lean, expected band roughly 89.20 to 90.80, and the 91.01 pivot as the level that would change the character of the morning if reclaimed in Europe.
Morning Session (9:00 AM to 12:00 PM ET Wednesday, United States Open and Pit Session)
This is the decisive window. United States flash purchasing-manager surveys print at 09:45 AM ET with the composite forecast at 54.9 against a prior 56.0, the services component at 55.9 against 56.5 and manufacturing at 53.7 against 53.9, per the news-feed calendar and unconfirmed. The official weekly petroleum status report follows at 10:30 AM ET with a consensus crude draw of 0.69 million barrels. A Federal Reserve governor speaks at 10:05 AM ET and a Bank of England deputy at 10:00 AM ET. The inventory print is the first-order event: the industry-body estimate pointed to a 1.786 million barrel build, so a confirmed official build would validate the bearish read and open the 88.18 to 88.68 support group, while a draw in line with consensus would set up a squeeze toward 91.01 and then 93.35. Expected band roughly 88.40 to 92.00.
Afternoon Session (12:00 PM to 2:30 PM ET Wednesday, NYMEX Pit Close)
The afternoon carries a five-year note auction at 01:00 PM ET, where the prior auction stopped at a 4.393 percent high yield with a 2.370 bid-to-cover, and European Central Bank speakers at 12:00 PM and 12:30 PM ET, per the news-feed calendar and unconfirmed. Crude's pit settlement falls inside this window at 02:30 PM ET. A weak auction that lifts yields and the dollar together compounds pressure on the barrel; a strong one relieves it. Absent a headline, the afternoon usually resolves toward whichever side of 91.01 the morning ended on. Expected band roughly 88.80 to 91.80.
Night Session Forward (6:00 PM ET Wednesday)
Residual bias into the Wednesday evening reopen depends almost entirely on where the inventory print left the contract relative to the 88.18 to 88.68 support group. Japanese flash surveys at 08:30 PM ET and Australian labour data at 09:30 PM ET, with the unemployment rate forecast at 4.5 percent and employment change at 20,000 against a prior decline of 15,800, provide the overnight texture. The larger forward anchor is Thursday at 08:30 AM ET, when weekly jobless claims print with a consensus of 200,000 against a prior 196,000, and Thursday also carries a state visit that the market will read for trade signalling, per the news-feed calendar and unconfirmed.
Expected Range (Wednesday Full Session)
Low-range scenario: 89.20 to 91.60
Mid-range scenario (most likely): 88.40 to 92.30
High-range scenario: 87.20 to 93.40
Most Likely Path
The most probable path opens the Wednesday pit session beneath the 91.01 pivot, drifts through the European morning without resolving, and then takes its direction from the 10:30 AM ET inventory print. The path that carries the most weight has the official figure confirming at least part of the industry-estimated build, sending the contract through the 90.12 retracement line and into the 88.18 to 88.68 group where the session low, the published target price and the first standard pivot support at 88.18 are stacked. A hold there into the 02:30 PM ET settlement, with the crack spread still at a record and products drawing, produces a close in the upper half of the 88.40 to 92.30 mid-range band, away from its extreme. The alternative that would invalidate this reading is an official draw larger than consensus, which would reclaim 91.01 quickly and set up a test of 93.35.
7. Wednesday Economic Calendar
The overnight block opens with Australian flash purchasing-manager surveys at 07:00 PM ET Tuesday, prior readings 52.0 manufacturing, 53.2 services, 52.7 composite, while the captured calendar places the Japanese flash surveys at 08:30 PM ET, prior manufacturing 54.9 and composite 53.5, and the Australian labour data at 09:30 PM ET, unemployment forecast 4.5 percent, in Wednesday evening's block and not Tuesday's, per the news-feed calendar and unconfirmed. The European morning carries a European Central Bank speaker at 03:00 AM ET, French flash surveys at 03:15 AM ET with the composite forecast at 48.7, German flash surveys at 03:30 AM ET with manufacturing forecast at 54.0, the eurozone aggregate at 04:00 AM ET with the composite forecast at 51.7 against a prior 52.0, United Kingdom flash surveys at 04:30 AM ET with the composite forecast at 52.0, and a further European Central Bank speaker at 04:50 AM ET.
The United States morning opens with flash purchasing-manager surveys at 09:45 AM ET, composite forecast 54.9 against a prior 56.0, services 55.9 against 56.5 and manufacturing 53.7 against 53.9, per the news-feed calendar and unconfirmed. A Bank of England deputy speaks at 10:00 AM ET and a Federal Reserve governor at 10:05 AM ET on housing. The weekly petroleum status report lands at 10:30 AM ET on Wednesday with a crude consensus draw of 0.69 million barrels against a prior draw of 0.640 million, and it covers the week ending on the eighteenth. The afternoon carries European Central Bank speakers at 12:00 PM and 12:30 PM ET and a five-year note auction at 01:00 PM ET, prior high yield 4.393 percent, prior bid-to-cover 2.370, per the news-feed calendar and unconfirmed.
The single first-order event for crude is the 10:30 AM ET petroleum status report. No mega-cap earnings are scheduled after Wednesday's close on the captured calendar, and no structural expiry falls on Wednesday; the October crude contract expired on Tuesday, which is why this outlook is written on the November contract. The next first-order grouping beyond Wednesday is Thursday, carrying jobless claims at 08:30 AM ET, a Swiss rate statement at 03:30 AM ET, a Norwegian policy rate at 04:00 AM ET, new home sales at 10:00 AM ET, a seven-year note auction at 01:00 PM ET and a state visit running all day, per the news-feed calendar and unconfirmed.
8. Primary Trade Setup
Direction: Short
Rationale: The composite multi-indicator read has fallen from 100 percent buy one week ago to 16 percent buy with the weakest direction grade published, the nine-day directional system has flipped negative, and the settle sits four cents beneath the 20-day average after vacating the entire prior weekly range; a retracement into the pivot band offers a short at better prices than the close.
Entry Zone: 91.00 to 91.60
Stop Loss: 93.90 (above the completed session high of 93.84, which also sits above the first standard pivot resistance at 93.35 and the one standard deviation resistance at 93.65)
Target 1 (T1): 88.70 (the session low at 88.67 and the published target price at 88.68)
Target 2 (T2): 87.40 (one standard deviation support at 87.39 and the 38.2 percent retracement from the four-week low at 87.38)
Target 3 (T3, extended): 85.85 (the second standard pivot support at 85.84)
Risk-to-Reward: Approximately 1:1 to T1, 1:1.5 to T2, 1:2.1 to T3
Invalidation: A settle above 93.84 negates the thesis outright. Short of that, the edge is removed by acceptance, distinguished from a touch by an explicit observation window: two consecutive 30-minute closes above 91.01 with the 20-day average at 90.56 also held from above. A single trade through 91.01 that is rejected inside one 30-minute bar is the entry condition of the setup; only the second consecutive close above it converts one into the other.
Macro override: A confirmed reversal in the Iranian diplomatic track, or any report of renewed disruption to Strait transit, would restore the supply-risk premium removed over five sessions, against a positioning base that was net long 106,279 contracts of managed money as of September 15. In that scenario the short is wrong immediately, and the 96.18 second standard pivot resistance becomes reachable in a single session given a 14-day average true range of 3.85 points.
Sources and methodology
This outlook is built from our session review of the November NYMEX WTI crude contract, CLX26, the November ’26 month, tracked on the continuous CL1! chart and prepared after Tuesday’s close on September 22, 2026 for the Wednesday, September 23, 2026 session. The contract domain was checked before any level was used: the chart’s late quote of 89.66 plus its stated decline of 0.86 returns 90.52, the published previous close, so chart and levels sit on the same November contract. The day high, day low and open shown on the data provider’s overview page belong to the new Globex session dated September 23 and are not presented anywhere here as Tuesday’s range.
Tuesday’s session extremes are the completed-session inputs behind the published pivot ladder rather than an independently read bar, back-solved from the outer pivot pairs, checked against all seven published rungs and corroborated by the data provider’s published daily record and its five-day period low of 88.67 dated 09/22/26, both surfaces of the same data provider. No intraday series was captured, so no intraday path is asserted. No dealer-positioning dataset was read for crude, so no gamma, dealer-positioning or options-flow claim is made. The inventory figures released after the close are an industry-body estimate and are stated as such; the official report is stated as scheduled. Items marked unconfirmed come from the news-feed calendar captured for this run. Scenario ranges are analyst judgment and carry no calibration.
Not captured in this run, and stated nowhere as a figure: any intraday price series, a prior-quarter high or low, any producer-group quota decision, compliance table or Saudi or Russian signal, a refinery utilisation figure, a seasonal demand series, and any Russia, Ukraine or Venezuela development.
Tuesday’s outlook for this contract is here, and Tuesday’s gold outlook is here. Outlooks for the equity index, technology index, gold and crude contracts are collected on the market outlook page, and our forward trading record is on the performance statement.



