
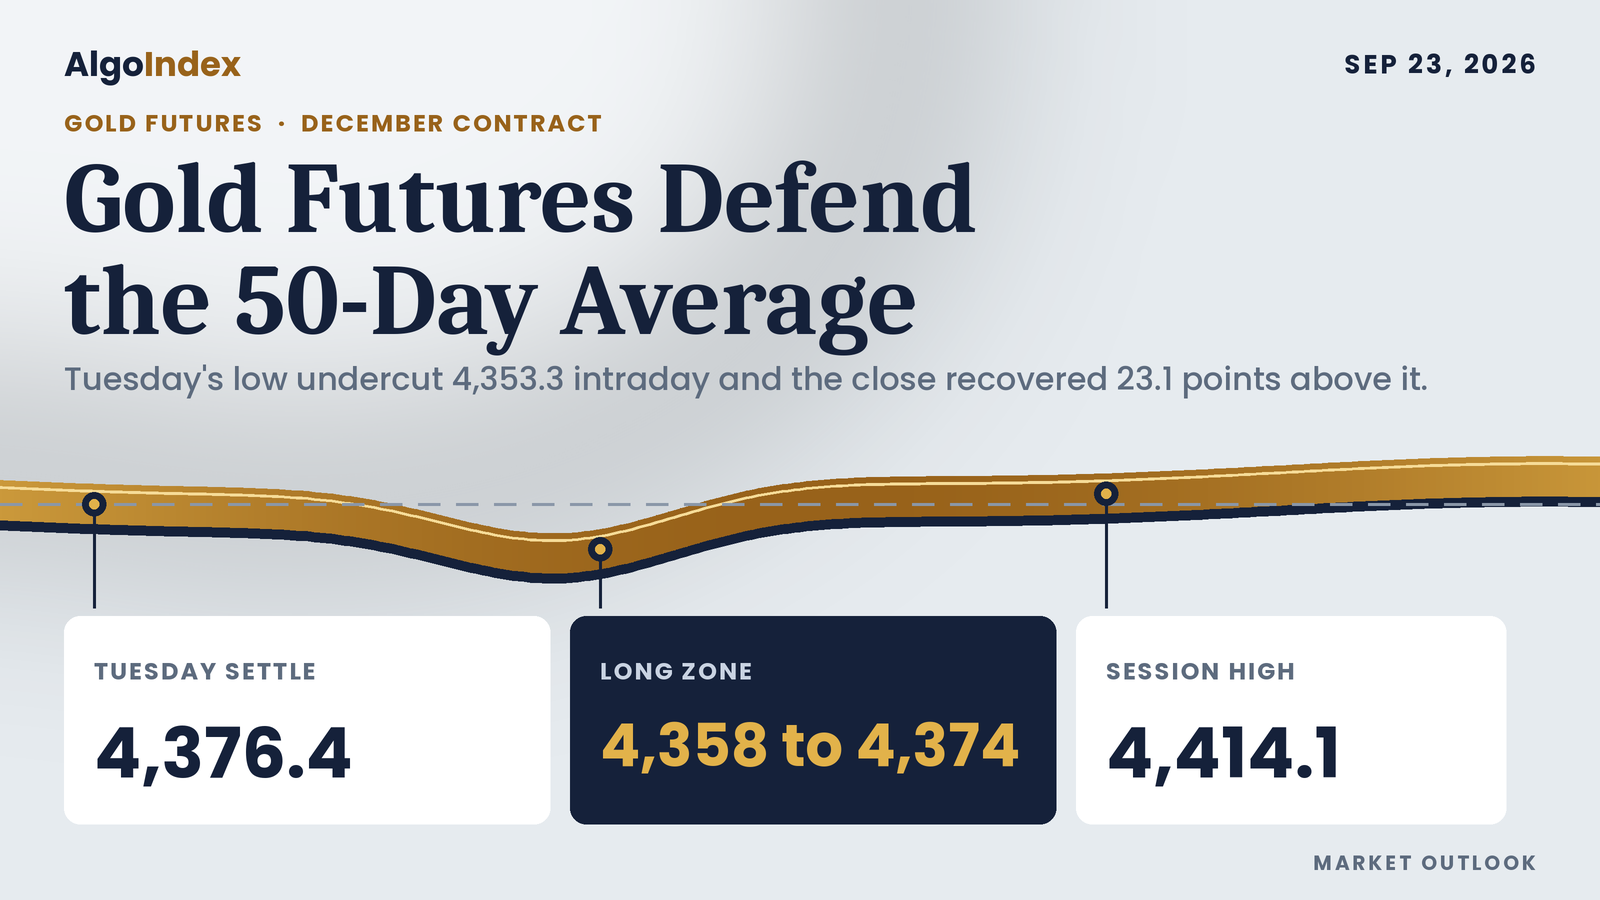
At 4,327.6 on Tuesday, December gold traded 25.7 points beneath its 50-day moving average. By the settlement it was back above it. The contract opened at 4,382.5, printed a high of 4,414.1 and a low of 4,327.6, and settled at 4,376.4. That is 86.5 points of travel for a net change of minus 7.5, or 0.17 percent, from Monday's 4,383.9. The close sat 56.4 percent of the way up the range and 6.1 points beneath the open. Volume came to 174,755 contracts against a 20-day average of 181,790.
Two headwinds hit the metal at once. The dollar index closed at 100.601, up 0.17 percent and at a seven-week high by press accounts, while Boston and Richmond Federal Reserve presidents were reported leaning toward further tightening. Crude fell 2.00 percent, which drained some of the inflation impulse that had been gold's own support. One print pushed the other way: the September Richmond manufacturing survey fell 6 points to a seven-month low of minus 2 against an expectation of 2. Gold absorbed all of it and gave back 7.5 points. That asymmetry is what carries into Wednesday. The reopened session has already lifted to 4,400.9, and the primary setup is a long from 4,358 to 4,374 on a pullback toward the 4,372.7 Pivot Point.
December gold settled at 4,376.4, 23.1 points above the 50-day average at 4,353.3 after trading 25.7 points beneath it at the 4,327.6 low. The Pivot Point for Wednesday is 4,372.7, 3.7 points under the settle. The first ceiling is the 4,383.3 to 4,386.0 pocket. The 14-day directional index reads 14.99, with the negative indicator at 17.94 over the positive at 14.90. No trend. The primary setup is a long from 4,358 to 4,374, stop 4,326, targets 4,406, 4,446 and 4,486. Wednesday's first-order event is the 09:45 AM ET United States flash composite survey, forecast 54.9 against a prior 56.0, per the news-feed calendar and unconfirmed.
Tuesday's short, scored against the bar
Our Tuesday outlook set a short from 4,405 to 4,418, stop 4,440, with targets at 4,360, 4,327 and 4,294. Tuesday's high reached 4,414.1. Tuesday's range reached into the band, from 4,405 up to the 4,414.1 high. The stop at 4,440 was never touched; the high stopped 25.9 points beneath it. The low at 4,327.6 ran 32.4 points through the first target and finished 0.6 point short of the second. Settlement at 4,376.4 printed 28.6 points beneath the bottom of the entry band. One limit belongs with that account. No intraday series was captured this run, so nothing here says whether the high came before the low. If the low printed first, the first-target touch came before price reached the band. The settlement comparison needs no sequence: the close sat beneath the band either way. The invalidation, a sustained session above 4,418, never triggered; the high fell 3.9 points shy of it. The third target at 4,294 was never in reach.
Wednesday's map turns the other way, and the bar explains why. Both extremes sit outside the open-to-settle interval, and the settle came back to within a few points of the open. The high fell 340.9 points short of the one-month high at 4,755.0. Those extremes are the completed-session inputs behind the published pivot ladder. They were back-solved from the outer pivot pairs and checked twice: the third resistance point at 4,504.3 less the third support point at 4,244.8, divided by three, returns 86.5. The second pair, 4,459.2 and 4,286.2, divided by two, returns the same 86.5. Three times the 4,372.7 Pivot Point less the settle gives a high-plus-low sum of 8,741.7. The pair of 4,414.1 and 4,327.6 then reproduces all seven published rungs exactly. The provider's own daily record returns 4,382.5, 4,414.1, 4,327.6 and 4,376.4 on 174,755 contracts. That record is a second surface of the same vendor, so it confirms internal consistency only; it does not authenticate the quote.
No period table corroborates the solved extremes either. The five-day period high of 4,439.8 belongs to 09/18/26 and the five-day period low of 4,273.3 to 09/16/26, so neither of Tuesday's extremes is a period record. Gold's widest day of the week took out neither end of the week's range. Close quality was constructive without being decisive. A settle at 56.4 percent of the range, slightly above the midpoint and above the 4,372.7 pivot arithmetic that governs Wednesday, is what a market looks like when the buyers who defended 4,327.6 finished marginally ahead of the sellers who rejected 4,414.1.
Beneath the 20-day, above the 50-day, inside last week
Last week, September 14 through September 18, spanned 4,439.8 to 4,273.3. That is a 166.5 point band. Tuesday sat entirely inside it, and the settle lands 63.4 points beneath the prior weekly high and 103.1 points above the prior weekly low. Gold is consolidating inside the prior week's range, the opposite of what crude did on the same day. The quarterly frame uses the 13-week extremes as the available proxy, since no prior-quarter high or low was captured this run. The 13-week high stands at 4,755.0, set on 08/25/26, and the low at 4,015.6, set on 06/30/26. The settle is 378.6 points beneath that high and 360.8 points above that low, close to the middle of the band.
Further out, the drawdown still frames everything. The 52-week high of 5,781.8, set on 01/29/26, stands 32.11 percent above the last price; the provider publishes the same relationship as the last price sitting 24.31 percent beneath that high. The 52-week low of 3,902.0, set on 09/24/25, stands 10.84 percent beneath the last price, published from the other side as 12.16 percent above it. Since 08/21/26 the one-month performance is minus 304.2 points, or minus 6.50 percent. That is how far the metal has retreated from the August high. The 20-day average at 4,461.2 defines the medium-term problem, because price has been beneath it.
Look at the daily closes in order. The published record reads 4,351.9, 4,332.8, 4,387.5, 4,399.7, 4,424.9, 4,383.9 and 4,376.4. Price rose into 09/18 and then gave back 48.5 points across two sessions. The swing high is now lower, 4,414.1 against 4,439.8 on 09/18. There is no lower low. Tuesday's 4,327.6 held above the 4,273.3 print of 09/16. A single lower high with a higher low inside a 166.5 point weekly band is consolidation. The retracement grid agrees. The 50 percent retracement of the 13-week range sits at 4,385.3, only 8.9 points above the settle. The 38.2 percent retracement from the 13-week high sits at 4,472.5, and the 38.2 percent retracement from the 13-week low far away at 4,298.1. Gold is priced at the centre of its own quarterly range.
The averages are stacked out of order. The 5-day stands at 4,394.5, the 20-day at 4,461.2, the 50-day at 4,353.3, the 100-day at 4,404.4, the 200-day at 4,648.7 and the year-to-date average at 4,664.1. The settle sits beneath the 5-day by 18.1 points, beneath the 20-day by 84.8, above the 50-day by 23.1, beneath the 100-day by 28.0 and beneath the 200-day by 272.3. The 50-day sits 51.1 points beneath the 100-day, and both sit beneath the 20-day. That inversion is the signature of a market that fell hard, based, and has been rebuilding from underneath. Tuesday's low undercut the 50-day intraday and the close recovered above it. That detail is the most bullish fact in the session. The projection grid gives Wednesday crossing prices of 4,383.3 for the 9-day, 4,424.2 for the 18-day and 4,420.8 for the 40-day. The last two sit only 3.4 points apart, a tight overhead pair that would matter on any sustained recovery.
Momentum leans soft without stretching. Relative strength reads 42.66 on the 9-day, 45.97 on the 14-day, 47.98 on the 20-day, 48.69 on the 50-day and 49.56 on the 100-day. The 14-day reading slipped 0.60 points on the session. Every horizon sits beneath 50 and the shortest sits lowest, which is mildly negative and not extended. The published grid places the 14-day relative-strength 50 percent line at 4,419.6 and its 30 percent line at 4,090.9. Stochastics split by horizon. The 9-day raw reads 49.90 percent with a smoothed line at 57.93 percent, the 14-day raw 36.15 percent against 42.70 percent, and the 20-day raw a depressed 21.40 percent against 25.28 percent. The 50-day raw recovers to 48.56 percent and the 100-day to 41.50 percent. So the short horizon is neutral and the 20-day is the stretched one. Nothing sits at an extreme.
Trend strength barely registers. The 9-day directional index reads 17.92, with negative direction at 17.51 above positive at 12.63. The 14-day reads 14.99, negative 17.94 over positive 14.90, and the 20-day 13.53, negative 18.35 over positive 16.34. The 50-day at 13.56 and the 100-day at 11.36 carry the same negative tilt. Beneath 20 on every horizon, that is a market without a trend, and whatever drift exists points down. It is the weakest directional read of the four instruments covered this evening. The composite multi-indicator read is an outright hold, direction graded steady, and the composite indicator itself also reads hold. Underneath, the short-horizon group averages 20 percent sell, the medium-horizon group 75 percent buy and the long-horizon group 67 percent sell. The prior readings were hold at Monday's close, 24 percent sell a week ago and 72 percent buy a month ago. A hold sandwiched between those two majorities is a genuine absence of signal.
Realised volatility keeps compressing. Historic volatility reads 12.63 percent on the 9-day, 17.55 percent on the 14-day, 18.96 percent on the 20-day and 23.32 percent on the 100-day. The 14-day average true range is 104.2 points, or 2.40 percent, and the 14-day average daily range 104.1 points, or 2.38 percent. The 9-day average true range is 101.7 and the 9-day average daily range 98.0, both slightly tighter. The 20-day average true range is 105.2 and the 50-day 110.7. Tuesday's 86.5 point range came in beneath every one of them. Gold's normal day is currently larger. One range from the 4,376.4 settle frames Wednesday between roughly 4,272.2 and 4,480.6. The published standard-deviation bands are far tighter: 4,357.4 to 4,395.4 at one deviation, 4,349.6 to 4,403.2 at two and 4,343.5 to 4,409.3 at three. A 104.2 point average range against a 65.8 point three-deviation band says the closing series has been unusually tight even as daily travel stayed wide.
Two headwinds, a 7.5 point give-back
Start with the dollar. It closed at 100.601 against 100.429 on Monday, up 0.172 points or 0.17 percent after a 100.307 to 100.703 session. Press commentary called it a seven-week high. The ten-year yield closed at 4.97 percent against 4.96 percent, having traded 4.93 to 4.98. A firm dollar and a nominal yield near 5 percent are both structural headwinds for a metal that pays nothing. Energy added a second one. November crude settled at 90.52, down 2.00 percent, and November Brent at 99.25, down 1.09 percent. Cheaper energy trims the inflation impulse that supports gold as a hedge. Against that combination gold gave back only 7.5 points, the strongest argument for the bid underneath it.
Policy commentary leaned hawkish and was the proximate reason the dollar made its high. A Boston Federal Reserve president was reported describing an increased likelihood of scenarios in which inflation remains notably above 2 percent. A Richmond Federal Reserve president warned it could take time for inflation to settle. Press commentary read both as opening the door to further tightening. The same Richmond official was quoted at 12:52 PM ET describing momentum outside data centres and artificial-intelligence capital spending, with consumer spending holding up and strength in defence and manufacturing. That reads as growth-positive. The projection material from the September 16 meeting, reported at 02:00 PM ET that day, showed 12 of 18 officials expecting one further 25 basis point increase this year. Four expect two and two expect none. The next policy decision is October 28.
One data point cut the other way. The Richmond manufacturing survey's drop to minus 2 is the first soft regional survey in the current sequence. Repeated, prints like that would reopen the easing case gold needs. Wednesday's speakers include a governor at 10:05 AM ET on housing, with further officials on Thursday at 04:10 AM, 08:00 AM, 08:50 AM and 10:10 AM ET.
Diplomacy moved toward de-escalation, which removes a safe-haven bid. A news-agency report stamped 04:39 AM ET said Iran has proposed reopening the Strait of Hormuz within seven days if the United States lifts its blockade of Iranian ports. Contact reports came next. A 01:52 PM ET item recorded a statement that United States officials had met an Iranian delegation for three hours. At 03:24 PM ET came a report that Iran's foreign minister met a United States envoy on the sidelines of the United Nations General Assembly. Then the rostrum. Rostrum remarks between 03:32 PM and 03:41 PM ET spoke of momentum toward a deal and of facilitating renewed flow through the Strait, while also raising the possibility of striking a named Iranian site. Iran's armed forces dismissed the remarks at 03:54 PM ET as domestic propaganda. All of it is unconfirmed reporting. For gold the asymmetry mirrors crude's: with the haven premium partly removed, a reversal in the diplomatic track would find the metal carrying less protection than it held a week ago. A state visit on Thursday adds a second geopolitical thread the market will read for trade signalling, per the news-feed calendar and unconfirmed.
Equities treated softer energy as good news. The Nasdaq-100 cash index closed at a record 30,732.40, up 250.05 points or 0.82 percent. The S&P 500 cash index finished at 7,764.64 against 7,764.70 on Monday, unchanged for practical purposes, and the Dow was reported down 0.36 percent. The volatility index closed at 14.21, down 0.66 points or 4.44 percent, after a 14.19 to 14.95 session. Record equities, compressing volatility, a firmer dollar and cheaper oil describe a risk-seeking day. Gold sat out the rally. It did not break under the dollar either.
Structural demand is a gap this run. No central-bank purchase data, official reserve figures or exchange-traded-fund holdings series was captured, and none is inferred. Nothing is asserted about official-sector or Chinese physical demand for Wednesday. The one adjacent observation is volume: the bullion fund used as a proxy traded 9,436,332 shares. No creation or redemption data was read, so no flow is attributed to that number.
Futures positioning shows enormous length. As of September 15, 2026, managed money held 142,394 contracts long against 9,278 short, a net long of 133,116, after trimming 3,410 from the long side and 1,554 from the short. Non-commercials held 258,059 long against 27,721 short and reduced both sides. Commercials held 56,417 long against 318,138 short, a net short of 261,721, with 6,539 trimmed from that short. Swap dealers held 14,690 long against 248,350 short and cut 5,505 from their short side. Producers held 16,396 long against 44,457 short. Managed-money length runs better than 15 to 1, and that length has to be financed through a sideways market. Every major short-side category reduced its short during the week, which reads as short covering by the hedging community; no new selling shows. Open interest of 314,234 on the December contract gives the scale. The snapshot predates the last five sessions, so it describes a starting condition.
The bullion exchange-traded fund supplies the options read, as a qualitative proxy only. It tracks bullion on a fractional basis with an expense drag and carries no clean basis to December, so nothing from it becomes a futures price. The fund closed at 399.58 against a previous-close field of 401.17, roughly four tenths of one percent lower, consistent in direction with the futures. Its 52-week high is 509.70 and its 52-week low 333.81, near the middle of its annual range. Call gamma reads minus 207 million and put gamma plus 148 million, with next-expiry gamma at 4.02 percent of the total. Negative on the call side and positive on the put side is the signature of a surface where upside participation has been sold and downside protection bought. That dealer posture tends to damp rallies and cushion declines. It fits the compressing volatility and a metal that spent two sessions giving back an advance without breaking.
The trade map for Wednesday
The setup leans on the average that held. Tuesday lost the 50-day intraday at the 4,327.6 low and closed 23.1 points back above it. The medium-horizon group reads 75 percent buy, and the overnight session has already reclaimed the first standard-deviation band. A pullback toward the 4,372.7 Pivot Point therefore offers a long at better prices than the current Globex print. The entry zone runs 4,358 to 4,374. The stop at 4,326 sits below the 4,327.6 session low, below the first standard pivot support at 4,331.3 and below the 50-day at 4,353.3. Targets step up through the deviation ladder and the pivot resistances.
The Globex reopen has already firmed. The new session opened at 4,394.7 and has traded between 4,394.7 and 4,402.8. The last print of 4,400.9 stands 24.5 points, or 0.56 percent, above Tuesday's settle, back over the first standard-deviation band. That is a firm start. Australian flash purchasing-manager surveys print at 07:00 PM ET with prior readings of 52.0 on manufacturing and 52.7 on the composite, per the news-feed calendar and unconfirmed. The captured calendar places the Japanese flash surveys in Wednesday evening's block, not tonight's, per the news-feed calendar and unconfirmed. Neither is a gold catalyst in its own right. Asian physical demand is most active in this window, though. The night session, 6:00 PM ET Tuesday to 3:00 AM ET Wednesday, carries a mildly higher bias while 4,383.3 holds as support on the retest, with an expected Globex band of roughly 4,380 to 4,415.
London, from 3:00 AM to 8:00 AM ET, runs the European flash surveys: 03:15 AM ET for France, 03:30 AM ET for Germany, 04:00 AM ET for the eurozone aggregate and 04:30 AM ET for the United Kingdom. The eurozone composite forecast is 51.7 against a prior 52.0. European Central Bank speakers appear at 03:00 AM and 04:50 AM ET. London is where the dollar leg of the gold trade usually gets set. A soft eurozone composite firms the dollar and pressures the metal toward the 4,372.7 pivot; an upside surprise relieves the dollar and opens 4,414.1. Bias neutral, expected band roughly 4,370 to 4,418.
Then the morning, 9:30 AM to 12:00 PM ET, the first-order window. United States flash purchasing-manager surveys print at 09:45 AM ET with the composite forecast at 54.9 against a prior 56.0, services at 55.9 against 56.5 and manufacturing at 53.7 against 53.9, per the news-feed calendar and unconfirmed. A Bank of England deputy speaks at 10:00 AM ET and a Federal Reserve governor at 10:05 AM ET. A composite miss beneath 54.9 would soften the dollar and the front end together, the cleanest path to the 4,414.1 to 4,419.6 band. An upside surprise reinforces Tuesday's hawkish commentary and points at the 4,353.3 to 4,362.5 support group. Expected band roughly 4,355 to 4,420.
The afternoon, 12:00 PM to 4:00 PM ET, carries European Central Bank speakers at 12:00 PM and 12:30 PM ET and a five-year note auction at 01:00 PM ET. The prior auction stopped at a 4.393 percent high yield with a 2.370 bid-to-cover, per the news-feed calendar and unconfirmed. Gold's pit settlement falls at 01:30 PM ET. A weak auction that lifts the yield curve is a headwind; a strong one relieves the dollar and supports the metal into the settlement. Absent a surprise, the afternoon usually resolves toward whichever side of 4,383.3 the morning ended on. Expected band roughly 4,360 to 4,415.
Residual bias into the 6:00 PM ET Wednesday reopen depends on whether the 50-day at 4,353.3 was tested during the United States session. Japanese flash surveys at 08:30 PM ET and Australian labour data at 09:30 PM ET, unemployment forecast 4.5 percent, provide overnight texture. Thursday is the larger anchor. It carries a Swiss rate statement at 03:30 AM ET with the policy rate forecast at 0 percent, a Norwegian policy rate at 04:00 AM ET forecast at 4.5 percent against a prior 4.25 percent, weekly jobless claims at 08:30 AM ET with a consensus of 200,000 against a prior 196,000, and a state visit running all day, per the news-feed calendar and unconfirmed.
Three scenario bands frame the day. The full-session bands run 4,340 to 4,420 in the low-range case, 4,320 to 4,425 in the mid-range case, which is the most likely, and 4,290 to 4,470 in the high-range case. The most probable path holds the overnight recovery into the European morning and retests the 4,383.3 to 4,386.0 pocket from above at least once. Direction then comes from the 09:45 AM ET composite survey. The weighting favours a session in the upper half of the mid-range band, because Tuesday's intraday loss of the 50-day was rejected and the overnight session has already reclaimed the first deviation band. A push into 4,414.1 that fails there for the second time in two sessions would set up a slower rotation back toward the 4,353.3 to 4,362.5 group into Thursday. A clean break above 4,419.6 changes the read and puts the 4,420.8 to 4,424.2 average pair in play immediately. These weightings are analyst judgment, with no derived frequency behind them.
Gold spent part of Tuesday beneath its 50-day and settled 23.1 points above it, and Wednesday's long asks the same average to hold one more time.
The complete data picture
Every number behind Wednesday’s plan, charted first, then the full level lists, then the complete numeric reference underneath.
Full numeric reference, every remaining figure from the session review
Carried below in the review's own order: the executive summary from section 1, sections 2.1 to 2.6, the level notes behind sections 3.1 and 3.2, sections 4.1 to 4.6, the fund options context from section 5, the session-by-session forecast from section 6, the Wednesday calendar from section 7 and the primary setup from section 8.
Level notes (3.1 Resistance and 3.2 Support)
4,383.3, the 9-day average crossing price, is the first ceiling, 6.9 points above the settle, with the three-and-ten day moving-average crossover stall at 4,386.0 immediately behind it and the 50 percent retracement of the 13-week range at 4,385.3 between them. That 4,383.3 to 4,386.0 pocket is the first genuine decision point of the Wednesday session.
4,394.5 to 4,419.6 is the band a Wednesday advance has to prove itself in: one deviation at 4,395.4 with the 5-day average at 4,394.5 effectively on top of it, two deviations at 4,403.2, three deviations at 4,409.3, Tuesday's session high at 4,414.1 capping that group, and the 14-day stochastic 50 percent threshold at 4,415.9 and the 14-day relative-strength 50 percent line at 4,419.6 bracketing the first standard pivot resistance at 4,417.8.
4,420.8 and 4,424.2, the 40-day and 18-day average crossing prices, form a tight overhead pair; the 38.2 percent retracement from the four-week low at 4,457.3, the second standard pivot resistance at 4,459.2, the 20-day average at 4,461.2 and the 38.2 percent retracement from the 13-week high at 4,472.5 form the extended ceiling group.
4,504.3, the third standard pivot resistance, marks the outer edge of a single-session move, and the one-month and 13-week high at 4,755.0 is structural and not tradeable this week.
4,373.0, the stall level on the 14-day stochastic, is the immediate support, three tenths of a point above the Pivot Point at 4,372.7; the pair is effectively one line 3.7 points beneath the settle, and holding it keeps the constructive read intact on Wednesday.
4,353.3 to 4,362.5 is the most important support in the instrument: the three-and-ten day crossover stall at 4,362.5, the 14-3 day raw stochastic 30 percent threshold at 4,358.9 and one standard deviation support at 4,357.4 form a close group, with the 50-day average at 4,353.3 immediately under them. The 50-day is the average the contract has been defending, the one it lost intraday before recovering on Tuesday.
4,349.6 and 4,343.5, the two and three standard deviations supports, precede the 14-3 day raw stochastic 20 percent threshold at 4,330.3 and the first standard pivot support at 4,331.3, with Tuesday's session low at 4,327.6 completing the group.
4,314.9, the 18-day to 40-day average crossing, opens on a loss of 4,327.6, followed by the 38.2 percent retracement from the 13-week low at 4,298.1. The second standard pivot support at 4,286.2 and the one-month low at 4,273.3, set on 09/16/26, mark the extended downside, with the third standard pivot support at 4,244.8 beyond them.
1. Executive Summary
The December gold contract settled at 4,376.4 on Tuesday, down 7.5 points or 0.17 percent from Monday's 4,383.9 close, in a session whose 86.5 point travel bore almost no relation to the size of the net change. It opened at 4,382.5, marked a high of 4,414.1 and a low of 4,327.6, and settled 56.4 percent of the way up the range and 6.1 points beneath the open. Volume printed 174,755 contracts against a 20-day average of 181,790. No intraday series was captured this run, so the order in which those extremes were reached is not asserted anywhere in this outlook. Both extremes sit outside the open-to-settle interval and the settle came back to within a few points of the open, the most informative thing about the session.
The dollar index closed at 100.601, up 0.17 percent and at a seven-week high by press accounts, a direct headwind for a dollar-priced ounce. Hawkish central-bank commentary reinforced it, with both a Boston and a Richmond Federal Reserve president read as leaning toward further tightening. The September Richmond manufacturing survey fell 6 points to a seven-month low of minus 2 against an expectation of 2, and crude's 2.00 percent decline eased the inflation impulse that had been the metal's own support. Gold was pulled in both directions on the same day and finished essentially where it started.
The composite multi-indicator read is an outright hold with direction graded steady, and its three horizon groups point in opposite directions: 20 percent sell on the short horizon, 75 percent buy on the medium and 67 percent sell on the long. The contract sits 23.1 points above its 50-day average at 4,353.3 and 84.8 points beneath its 20-day average at 4,461.2, with the 200-day average at 4,648.7 standing 272.3 points above the settle. The directional system reads 14.99 on the 14-day with negative direction at 17.94 above positive direction at 14.90, a weak trend tilted lower; no real trend exists. The primary setup is a long from the 4,358 to 4,374 band on a pullback toward the standard daily pivot at 4,372.7, stopped beneath Tuesday's session low, targeting the standard-deviation band and then the second standard pivot resistance.
2.1 Intraday and Session Review
The completed session was a two-sided failure on the evidence of the bar itself: open 4,382.5, high 4,414.1, low 4,327.6, settle 4,376.4. No path claim is made. The high fell 340.9 points short of the one-month high at 4,755.0, and the settle returned to 6.1 points beneath the open. The extremes are the completed-session inputs behind the published pivot ladder, back-solved from the outer pivot pairs and verified twice: 4,504.3 less 4,244.8, divided by three, returns 86.5, and 4,459.2 less 4,286.2, divided by two, returns the same 86.5. Adding three times the pivot point at 4,372.7 and subtracting the settle gives a high-plus-low sum of 8,741.7, and the pair of 4,414.1 and 4,327.6 reproduces all seven published rungs exactly. The provider's own published daily record for the December contract returns 4,382.5, 4,414.1, 4,327.6 and 4,376.4 on 174,755 contracts; as a second surface of the same vendor it confirms internal consistency and does not authenticate the underlying quote.
No independent corroboration exists in the period tables, because the five-day period high of 4,439.8 belongs to 09/18/26 and the five-day period low of 4,273.3 to 09/16/26. Gold's widest day of the week did not take out either end of the week's range. Close quality was constructive without being decisive: a settle at 56.4 percent of the range, slightly above the midpoint and above the 4,372.7 pivot arithmetic that governs Wednesday.
2.2 Daily Structure
The prior week, September 14 through September 18, spanned 4,439.8 at the high and 4,273.3 at the low, a 166.5 point band that contained all of Tuesday; the settle sits 63.4 points beneath the prior weekly high and 103.1 points above the prior weekly low. The 13-week high stands at 4,755.0, set on 08/25/26, and the 13-week low at 4,015.6, set on 06/30/26, used as the quarterly proxy because no prior-quarter high or low was captured; the settle sits 378.6 points beneath that high and 360.8 above that low. The 52-week high of 5,781.8, set on 01/29/26, stands 32.11 percent above the last price (published from the other side as 24.31 percent beneath it), and the 52-week low of 3,902.0, set on 09/24/25, stands 10.84 percent beneath the last price (published as 12.16 percent above it).
The one-month performance of minus 304.2 points or minus 6.50 percent since 08/21/26 measures the retreat from the August high. The 50-day average at 4,353.3 is the level the contract is defending: Tuesday's low of 4,327.6 undercut it intraday before the close recovered above it, the most bullish fact in the session.
2.3 4-Hour and Swing Structure
The published daily record reads 4,351.9, then 4,332.8, then 4,387.5, then 4,399.7, then 4,424.9, then 4,383.9, then 4,376.4: a rise into 09/18 followed by two sessions of give-back that together removed 48.5 points. The swing structure shows a lower high at 4,414.1 against 4,439.8 on 09/18 and no lower low, since 4,327.6 sits above the 4,273.3 print of 09/16. The retracement grid for Wednesday places the 50 percent retracement of the 13-week range at 4,385.3, only 8.9 points above the settle, the 38.2 percent retracement from the 13-week high at 4,472.5, and the 38.2 percent retracement from the 13-week low far away at 4,298.1.
2.4 Moving Averages
5-day 4,394.5, 20-day 4,461.2, 50-day 4,353.3, 100-day 4,404.4, 200-day 4,648.7, year-to-date 4,664.1. The settle at 4,376.4 sits beneath the 5-day by 18.1 points, beneath the 20-day by 84.8, above the 50-day by 23.1, beneath the 100-day by 28.0 and beneath the 200-day by 272.3. The 50-day sits 51.1 points beneath the 100-day, and both sit beneath the 20-day. Wednesday crossing prices: 4,383.3 for the 9-day, 4,424.2 for the 18-day and 4,420.8 for the 40-day, the last two only 3.4 points apart.
2.5 Oscillator and Trend Readings
Relative strength: 42.66 on the 9-day, 45.97 on the 14-day (down 0.60 points on the session), 47.98 on the 20-day, 48.69 on the 50-day and 49.56 on the 100-day. The 14-day relative-strength 50 percent line sits at 4,419.6 and its 30 percent line at 4,090.9. Stochastics: 9-day raw 49.90 percent, smoothed 57.93 percent; 14-day raw 36.15 percent, smoothed 42.70 percent; 20-day raw 21.40 percent, smoothed 25.28 percent; 50-day raw 48.56 percent; 100-day raw 41.50 percent.
Directional system: 9-day index 17.92 with negative direction 17.51 and positive 12.63; 14-day 14.99 with negative 17.94 and positive 14.90; 20-day 13.53 with negative 18.35 and positive 16.34; 50-day 13.56 and 100-day 11.36 with the same negative tilt. An index beneath 20 on every horizon describes a market without a trend, with a downward drift. Historic volatility: 12.63 percent on the 9-day, 17.55 percent on the 14-day, 18.96 percent on the 20-day and 23.32 percent on the 100-day.
Composite multi-indicator read: hold, direction graded steady, and the composite indicator itself also reads hold. Short-horizon group 20 percent sell, medium-horizon 75 percent buy, long-horizon 67 percent sell. Prior readings: hold at Monday's close, 24 percent sell one week ago, 72 percent buy one month ago.
2.6 Volatility and Expected Range
14-day average true range 104.2 points or 2.40 percent; 14-day average daily range 104.1 points or 2.38 percent; 9-day average true range 101.7 and 9-day average daily range 98.0; 20-day average true range 105.2; 50-day average true range 110.7. Tuesday's realised 86.5 point range came in beneath every one of those measures. A one-range projection from the 4,376.4 settle using the 14-day average true range of 104.2 points frames Wednesday between roughly 4,272.2 and 4,480.6. The published standard-deviation bands span 4,357.4 to 4,395.4 at one deviation, 4,349.6 to 4,403.2 at two and 4,343.5 to 4,409.3 at three; a 104.2 point average range against a 65.8 point three-deviation band shows the closing series has been unusually tight even as the daily travel stayed wide.
4.1 Dollar and Real Yields
Dollar index 100.601 against 100.429 on Monday, up 0.172 points or 0.17 percent, after a 100.307 to 100.703 session, described by press commentary as a seven-week high. Ten-year yield 4.97 percent against 4.96 percent, range 4.93 to 4.98. November crude settled at 90.52, down 2.00 percent, and November Brent at 99.25, down 1.09 percent; the energy move was a second headwind for gold, and two headwinds produced a 7.5 point decline.
4.2 Fed and Monetary Policy
A Boston Federal Reserve president was reported describing an increased likelihood of scenarios in which inflation remains notably above 2 percent, and a Richmond Federal Reserve president warned it could take time for inflation to settle; press commentary read both as opening the door to further tightening. The same Richmond official was quoted at 12:52 PM ET describing momentum outside data centres and artificial-intelligence capital spending, with consumer spending holding up and strength in defence and manufacturing. The September 16 projection material, reported at 02:00 PM ET that day, showed 12 of 18 officials expecting one further 25 basis point increase this year, four expecting two and two expecting none. Wednesday's speakers include a governor at 10:05 AM ET on housing, with further officials on Thursday at 04:10 AM, 08:00 AM, 08:50 AM and 10:10 AM ET. The next policy decision is October 28. The September Richmond manufacturing survey fell 6 points to a seven-month low of minus 2 against an expectation of 2, the first soft regional survey in the current sequence.
4.3 Geopolitical Backdrop
04:39 AM ET: a news-agency report said Iran has proposed reopening the Strait of Hormuz within seven days if the United States lifts its blockade of Iranian ports. 01:52 PM ET: a statement that United States officials had met an Iranian delegation for three hours. 03:24 PM ET: Iran's foreign minister reported meeting a United States envoy on the sidelines of the United Nations General Assembly. 03:32 PM to 03:41 PM ET: rostrum remarks about momentum toward a deal and facilitating renewed flow through the Strait, while also raising the possibility of striking a named Iranian site. 03:54 PM ET: Iran's armed forces dismissed the remarks as domestic propaganda. All of it is unconfirmed reporting. A state visit on Thursday adds a second thread the market will read for trade signalling, per the news-feed calendar and unconfirmed.
4.4 China and Structural Demand (Central Bank Buying, PBOC, ETF Flows)
No central-bank purchase data, official reserve figures or exchange-traded-fund holdings series was captured this run, and none is inferred; nothing is asserted about official-sector or Chinese physical demand for Wednesday. The bullion fund used as a proxy traded 9,436,332 shares on the session, a volume observation only, since no creation or redemption data was read.
4.5 Energy and Cross-Asset
Nasdaq-100 cash index 30,732.40, up 250.05 points or 0.82 percent, at a record. S&P 500 cash index 7,764.64 against 7,764.70 on Monday, unchanged for practical purposes. Dow reported down 0.36 percent. Volatility index 14.21, down 0.66 points or 4.44 percent, after a 14.19 to 14.95 session. Gold did not participate in the risk rally and did not break under the dollar.
4.6 Institutional Positioning (COT, ETF Holdings, Speculator Length)
As of September 15, 2026: managed money long 142,394 against short 9,278, net long 133,116, with 3,410 contracts trimmed from the long side and 1,554 from the short. Non-commercials 258,059 long against 27,721 short, both sides reduced. Commercials 56,417 long against 318,138 short, net short 261,721, with 6,539 trimmed from the short side. Swap dealers 14,690 long against 248,350 short, 5,505 cut from the short side. Producers 16,396 long against 44,457 short. Managed-money length exceeds 15 to 1, every major short-side category reduced its short, and open interest on the December contract stands at 314,234. The snapshot predates the last five sessions.
5. Bullion Fund Options Flow Context (Proxy)
Qualitative proxy only: the fund tracks bullion on a fractional basis with an expense drag and carries no clean basis to the December futures contract, so nothing here is translated into a futures price and no level in the resistance and support lists originates here. The fund closed at 399.58 on 9,436,332 shares against a previous-close field of 401.17, roughly four tenths of one percent lower and directionally consistent with the futures finishing 0.17 percent lower. 52-week high 509.70, 52-week low 333.81. Call gamma minus 207 million, put gamma plus 148 million, next-expiry gamma 4.02 percent of the total: upside participation sold and downside protection bought, a posture that tends to damp rallies and cushion declines.
The surface's high-volatility-point and low-volatility-point fields are known to render inverted and are excluded; this run read the low point at 310 and the high point at 460, and even where that ordering looks plausible the pair is treated as low confidence with no level structure built on it. The surface's previous-close field also proved unreliable on other symbols this run, so the fund's daily change is carried as a direction only and never feeds a gold price.
6. Forecast, session by session
Night Session (6:00 PM ET Tuesday to 3:00 AM ET Wednesday, Globex and Asia). Opened 4,394.7, traded 4,394.7 to 4,402.8, last print 4,400.9, 24.5 points or 0.56 percent above the settle. Australian flash surveys at 07:00 PM ET, prior 52.0 manufacturing and 52.7 composite, per the news-feed calendar and unconfirmed; Japanese flash surveys placed in Wednesday evening's block, per the news-feed calendar and unconfirmed. Bias mildly higher while 4,383.3 holds as support on the retest; expected Globex band roughly 4,380 to 4,415.
London Session (3:00 AM to 8:00 AM ET Wednesday). European flash surveys at 03:15 AM ET (France), 03:30 AM ET (Germany), 04:00 AM ET (eurozone, composite forecast 51.7 against a prior 52.0) and 04:30 AM ET (United Kingdom); European Central Bank speakers at 03:00 AM and 04:50 AM ET. A soft eurozone composite pressures the metal toward 4,372.7; an upside surprise opens 4,414.1. Bias neutral, expected band roughly 4,370 to 4,418.
Morning Session (9:30 AM to 12:00 PM ET Wednesday, US Open). United States flash surveys at 09:45 AM ET, composite forecast 54.9 against 56.0, services 55.9 against 56.5, manufacturing 53.7 against 53.9, per the news-feed calendar and unconfirmed. Federal Reserve governor 10:05 AM ET, Bank of England deputy 10:00 AM ET. A composite miss beneath 54.9 is the cleanest path to 4,414.1 to 4,419.6; an upside surprise points at 4,353.3 to 4,362.5. Expected band roughly 4,355 to 4,420.
Afternoon Session (12:00 PM to 4:00 PM ET Wednesday). European Central Bank speakers at 12:00 PM and 12:30 PM ET and a five-year note auction at 01:00 PM ET, prior high yield 4.393 percent, bid-to-cover 2.370, per the news-feed calendar and unconfirmed. Gold's pit settlement at 01:30 PM ET. Absent a surprise the afternoon usually resolves toward whichever side of 4,383.3 the morning ended on. Expected band roughly 4,360 to 4,415.
Night Session Forward (6:00 PM ET Wednesday). Bias depends on whether 4,353.3 was tested in the United States session. Japanese flash surveys at 08:30 PM ET; Australian labour data at 09:30 PM ET with unemployment forecast 4.5 percent. Thursday: Swiss rate statement at 03:30 AM ET, policy rate forecast 0 percent; Norwegian policy rate at 04:00 AM ET, forecast 4.5 percent against 4.25 percent; weekly jobless claims at 08:30 AM ET, consensus 200,000 against 196,000; a state visit all day; per the news-feed calendar and unconfirmed.
Expected Range (Wednesday full session). Low-range scenario 4,340 to 4,420. Mid-range scenario, the most likely, 4,320 to 4,425. High-range scenario 4,290 to 4,470.
Most Likely Path. Hold the overnight recovery into the European morning, retest 4,383.3 to 4,386.0 from above at least once, then take direction from the 09:45 AM ET composite survey, favouring the upper half of the mid-range band. A second failure at 4,414.1 sets up a slower rotation toward 4,353.3 to 4,362.5 into Thursday; a clean break above 4,419.6 puts 4,420.8 to 4,424.2 in play. Analyst judgment, no derived frequencies.
7. Wednesday Economic Calendar
Overnight: Australian flash surveys at 07:00 PM ET Tuesday, prior 52.0 manufacturing and 52.7 composite. The captured calendar places the Japanese flash surveys at 08:30 PM ET (prior manufacturing 54.9, composite 53.5) and the Australian labour data at 09:30 PM ET (unemployment forecast 4.5 percent, employment change 20,000 against a prior decline of 15,800) in Wednesday evening's block, per the news-feed calendar and unconfirmed. European morning: a European Central Bank speaker at 03:00 AM ET, French flash surveys at 03:15 AM ET, German flash surveys at 03:30 AM ET with manufacturing forecast at 54.0 against a prior 54.3, the eurozone aggregate at 04:00 AM ET with the composite forecast at 51.7 against a prior 52.0, United Kingdom flash surveys at 04:30 AM ET with the composite forecast at 52.0 against a prior 52.5, and a further European Central Bank speaker at 04:50 AM ET.
United States morning: flash surveys at 09:45 AM ET, composite forecast 54.9 against a prior 56.0, per the news-feed calendar and unconfirmed; a Bank of England deputy at 10:00 AM ET; a Federal Reserve governor at 10:05 AM ET on housing; the weekly petroleum status report at 10:30 AM ET, relevant to gold only through the inflation channel. Afternoon: European Central Bank speakers at 12:00 PM and 12:30 PM ET and a five-year note auction at 01:00 PM ET, prior high yield 4.393 percent, prior bid-to-cover 2.370, per the news-feed calendar and unconfirmed.
The single first-order event for gold is the 09:45 AM ET United States flash composite survey, the only scheduled Wednesday release capable of moving the dollar and the front end of the curve together. No mega-cap earnings are scheduled after Wednesday's close on the captured calendar and no structural expiry falls on Wednesday; the December contract's first notice date is 11/30/26 and its expiration 12/29/26. Thursday brings two European policy decisions before the United States open, jobless claims at 08:30 AM ET, new home sales at 10:00 AM ET and a seven-year note auction at 01:00 PM ET, per the news-feed calendar and unconfirmed.
8. Primary Trade Setup
Direction: Long
Rationale: Tuesday lost the 50-day average intraday at 4,327.6 and closed 23.1 points back above it at 4,376.4, the medium-horizon indicator group reads 75 percent buy, and the overnight session has already reclaimed the first standard-deviation band, so a pullback toward the standard daily pivot at 4,372.7 offers a long at better prices than the current Globex print.
Entry Zone: 4,358 to 4,374
Stop Loss: 4,326 (below the completed session low of 4,327.6, which is also below the first standard pivot support at 4,331.3 and below the 50-day moving average at 4,353.3)
Target 1 (T1): 4,406 (between the two standard deviations resistance at 4,403.2 and the three standard deviations resistance at 4,409.3)
Target 2 (T2): 4,446 (approaching the 38.2 percent retracement from the four-week low at 4,457.3 and the second standard pivot resistance at 4,459.2)
Target 3 (T3, extended): 4,486 (between the 38.2 percent retracement from the 13-week high at 4,472.5 and the third standard pivot resistance at 4,504.3)
Risk-to-Reward: Approximately 1:1 to T1, 1:2 to T2, 1:3 to T3
Invalidation: A settle beneath 4,327.6 negates the thesis, and an acceptance beneath the 50-day average at 4,353.3 for a full session removes the edge before the stop is reached, because the entire rationale rests on that average having been defended.
Macro override: A hot United States flash composite survey at 09:45 AM ET, or a further leg higher in the dollar index beyond the 100.703 Tuesday high, would put the hawkish policy commentary back in control and invalidate the long in real time. The mirror risk is that a confirmed breakdown in the Iranian diplomatic track restores a haven bid and makes the long right for a reason unrelated to the technical case set out above.
Sources and methodology
This outlook is built from our session review of the December COMEX gold contract, GCZ26, the December '26 contract, prepared after Tuesday's close on September 22, 2026. The contract domain was checked before any level was used: the chart last of 4,401.6 less its stated change of 25.2 returns 4,376.4, equal to the published previous close, so chart and data sit on the same December contract. The day high, day low and open shown on the data overview page belong to the new Globex session dated September 23 and are not presented anywhere here as Tuesday's range. Tuesday's extremes are the completed-session inputs behind the published pivot ladder, back-solved from its outer pairs and matched against all seven published rungs, and no intraday series was captured, so no intraday path is asserted.
The bullion exchange-traded fund is used qualitatively only; no level in this outlook originates in it, and its two volatility-point fields are excluded as low confidence. Scenario ranges and path weightings are analyst judgment and carry no calibration. Catalysts whose release time had passed are recorded as completed with their result, and scheduled Wednesday items are recorded with their consensus; items marked per the news-feed calendar and unconfirmed carry that qualification exactly as the review states it. Central-bank purchase data, official reserve figures, fund-holdings series and an intraday price series were not captured in this run, and no figure is stated for any of them.
Tuesday’s outlook for this contract is here, and the same session's crude read is here. Outlooks for ES, NQ, GC and CL are collected on the market outlook page, and our forward trading record is on the performance statement.



