
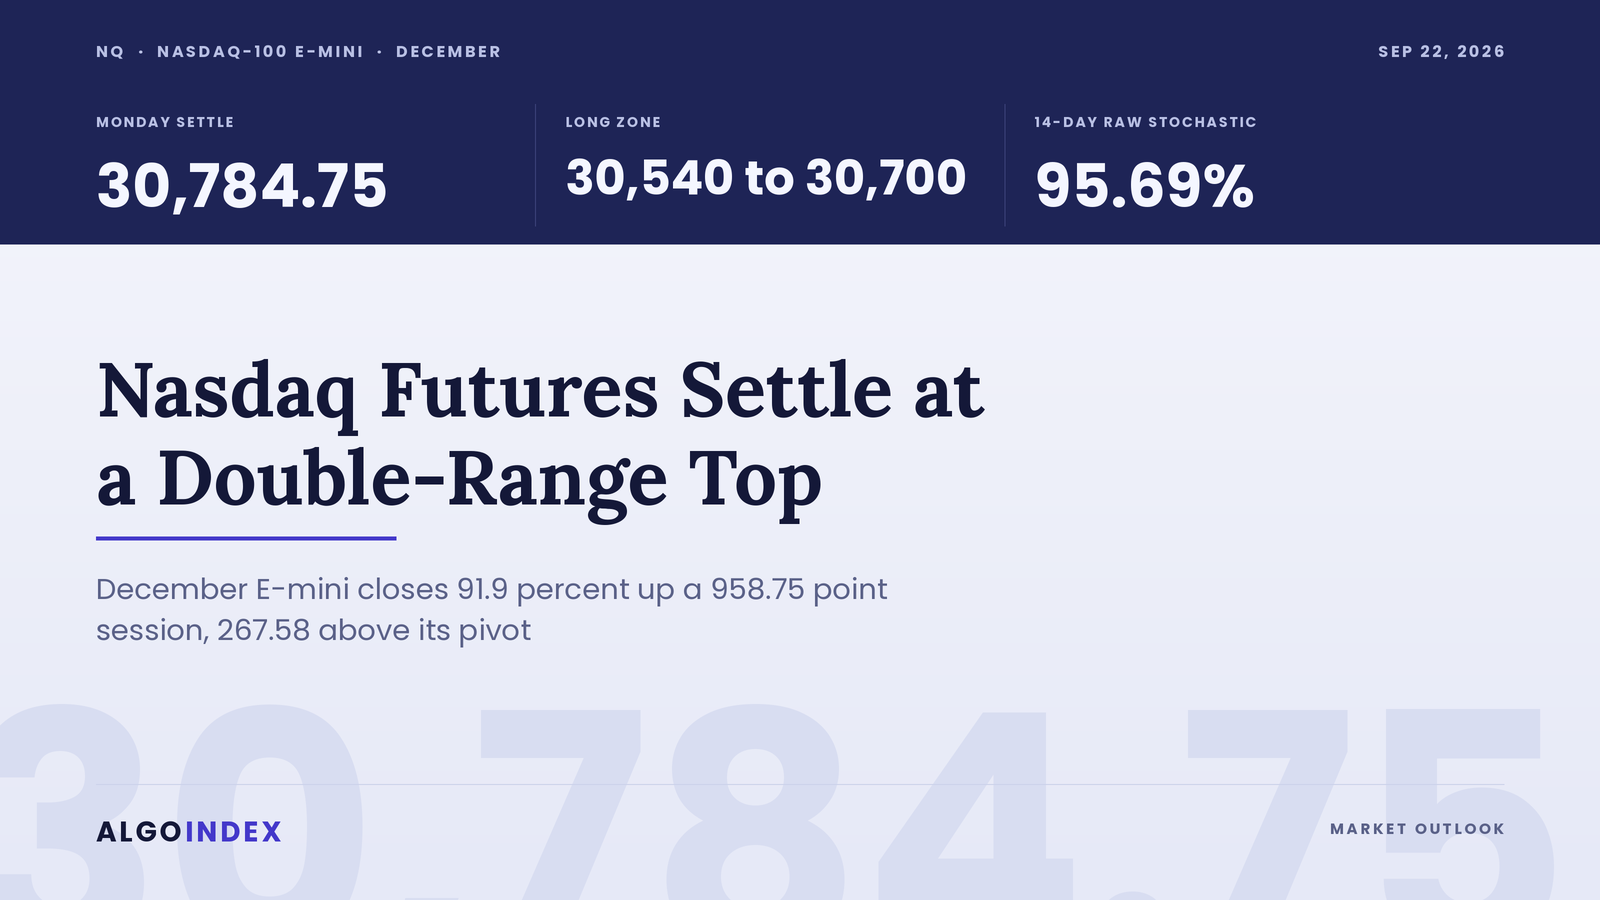
At 10:16 AM ET Monday, AMD crossed a one trillion dollar market capitalisation for the first time, and by the close the semiconductor sector had gained 5 percent. December Nasdaq-100 futures settled at 30,784.75 after a completed session that bracketed 30,862.75 and 29,904.00, a span of 958.75 points, and the settlement landed 91.9 percent of the way up it. That put the close 267.58 points above the Pivot Point at 30,517.17. Best session in six weeks.
The buying was narrow. META rose 11 percent on optimism around its new model offering and was the single largest contributor to the broad index advance, INTC rose 12 percent and ARM 17 percent. Single-stock hedging flow captured in the evening desk note registered roughly plus 8 billion dollars of delta, the largest reading of the past 30 days, with 75 percent of it from the seven largest names, while index-level hedging flow ran about minus 2 billion dollars on same-day-expiry call selling and longer-dated put buying. Traders paid up for individual technology names and bought index protection in the same session. Tuesday inherits the consequence. The cash Nasdaq-100 closed near 30,508, clear above the call-side hedging boundary at 29,475 and the primary gamma concentration strike at 29,500, which leaves the mechanical support that positioning provides behind the market rather than beneath it.
December Nasdaq-100 futures settled at 30,784.75, 267.58 points above the Pivot Point at 30,517.17, after a 958.75 point session that measured exactly 200 percent of the 14-day average true range of 479.41 points. A double-range day. Price sits above all five moving averages, the 5-day at 29,789.70 is 995.05 points beneath the settlement, and the 14-day raw stochastic reads 95.69 percent. Overhead sits the new Globex high at 30,821, then Monday's 30,863 completed-session high, which is the 1-month high in the same price, then Pivot R1 at 31,130 and the 31,294 to 31,386 structural ceiling. Beneath, the ladder is dense. It runs from the Globex low at 30,779 through the Pivot Point at 30,517, the 30,501 stochastic shelf, the 30,155 to 30,172 confluence and the 29,904 session low. The primary setup is a long from 30,540 to 30,700, stop 30,440, targets 30,863, 31,130 and 31,386. One first-order event stands on Tuesday's calendar, the 01:00 PM ET two-year note auction, reported by the news-feed calendar captured for this run and unconfirmed against the verified forward calendar.
The long that sat 189 points too low
Monday's outlook set a long from 29,650 to 29,715 with a stop at 29,570 and targets at 29,850, 29,993 and 30,096. Monday's completed-session low printed 29,904.00. That sits 189.00 points above the top of the entry band, so no print reached the zone and the stop never came into play. The session high at 30,862.75 then cleared all three targets, the last of them by 766.75 points. Direction right, entry unfilled, nothing banked.
Two in a row now. That same outlook scored the Thursday call, a 29,566 to 29,623 long, exactly the same way: a pullback bid beneath a market that kept climbing. A 65 point entry band set the night before will keep missing while this contract carries a 14-day average true range of 479.41 points and prints 958.75 in a session. We score it as written. No fill, no trade, no result to claim, and the next map widens the band to 160 points for that reason.
Single names did the work and the macro calendar did none of it. GOOGL unveiled a line of artificial-intelligence laptops priced from 899 dollars at 09:02 AM ET, with availability from October 4. A rival model release landed at 11:50 AM ET priced at 2 dollars per million input tokens, and reports at 10:34 AM ET described a competing response under development. The options market misjudged the size of it. The evening desk note records a semiconductor fund rallying 23 points against an 11 dollar implied move. META moved 76 dollars against the 16 dollar move the options market had priced, close to five times. That note also records the constructive semiconductor setup being flagged in its prior edition on the basis of call skew in the 90th percentile against implied-volatility rank in the 7th percentile. Expensive skew against cheap outright volatility is the mechanical description of options underpriced for the move they went on to make.
Above every average, with a stochastic at 95.69
Start with the stack, because it is unanimous. The 5-day sits at 29,789.70, 995.05 points beneath the settlement, the 20-day at 29,689.19, the 50-day at 29,579.13, the 100-day at 29,791.80 and the 200-day at 27,879.42. Nothing sits overhead. One point of friction survives: the 100-day at 29,791.80 sits above the 50-day at 29,579.13, a residue of the earlier consolidation that has not resolved. Price above all five averages with the shortest of them 995 points below reads as a strong trend and a stretched one at once. The distance from the 5-day is the extension mean reversion would target.
Momentum is loud and uneven. The 14-day relative strength measure reads 65.13, up 10.50 points, with the 9-day at 72.51 and the 20-day at 60.47. The 9-day is approaching the conventional overbought threshold while the 14-day is not. The 14-day raw stochastic is 95.69 percent, with stochastic percent K at 82.24 percent against percent D at 57.29 percent, and the 9-day and 20-day raw stochastics read the same 95.69 percent. A raw stochastic printing 95.69 percent across three lookbacks describes a settlement at the extreme top of its recent distribution. As stretched as that measure gets.
The trend measures disagree with the momentum measures, and that disagreement is the constructive part. The 14-day directional index reads 14.52 with the positive directional indicator at 29.16 against the negative at 16.80, and the 9-day directional index reads 19.94. A directional index in the mid-teens with the positive indicator nearly twice the negative describes a young directional move that has not yet built trend strength. Historic volatility reads 17.30 percent on the 14-day window and 19.05 percent on the 9-day. The multi-indicator composite prints 72 percent buy with current strength strong and current direction strongest, the composite trend signal reads buy, and the short-term group sits at 100 percent buy.
December carries 256,290 contracts of open interest. The 5-day change is a gain of 1,335.25 points, or 4.53 percent, so this advance is a week old and not a day old. The 52-week high at 31,385.50 sits 1.95 percent above the settlement with the 13-week high at 31,293.50 just beneath it, which puts the close inside 2 percent of the annual peak. Top of the distribution. The 52-week low at 23,429.00 is 23.89 percent below, and the 1-month low at 29,053.00 sits 1,731.75 points under the settlement. The swing sequence is higher lows into a test of the annual high. Two retracements mark the shelves. The 38.2 percent retracement from the four-week high at 30,171.42 sits within 0.16 points of Pivot S1 at 30,171.58, the tightest confluence in the structure. The 50 percent retracement from the four-week high and low at 29,957.88 coincides with the 14-3 day raw stochastic at 50 percent, which reinforces the 29,904 to 29,958 area as the structural base of the advance.
The completed session is recovered from the published pivot ladder and not from an independently read bar. The outer pairs agree. Pivot R3 at 32,089.08 less Pivot S3 at 29,212.83, divided by three, gives 958.75, and the second-level pair of 31,475.92 and 29,558.42, divided by two, gives the same 958.75. Solving against a Pivot Point of 30,517.17 and a settlement of 30,784.75 returns a session high of 30,862.75 and a session low of 29,904.00. Those two values reproduce all seven published levels. The separately published 1-month high of 30,862.75 matches the back-solved high to the tick, which is independent corroboration and also means Monday's high was the highest print of the past month. No intraday series was captured for this run, so the sequence within the session is not asserted here.
Volatility framing starts from a 14-day average true range of 479.41 points, 1.56 percent of settlement, with the 9-day at 483.88 points and 1.57 percent and the 20-day at 493.76 points and 1.60 percent. The 14-day average daily range is 450.25 points at 1.46 percent and the 20-day average daily range 425.10 points at 1.38 percent. A one-average-true-range projection from the 30,784.75 settlement gives 30,305.34 to 31,264.16 for Tuesday. Monday's realised span was exactly twice the 14-day figure, and back-to-back double-range days are uncommon, so a narrower Tuesday is the base expectation even if direction continues.
The reopened market has already set its own references. The new Globex session dated Tuesday, September 22 opened at 30,780.00, has traded between 30,778.50 and 30,821.25, a 42.75 point band, and was last quoted near 30,813 on 3,181 contracts. Its low holds within 6 points of Monday's settlement, which describes retention of the advance and not distribution of it. Those figures belong to the new session and sit outside Monday's completed range. The higher-timeframe layout was read at the daily interval with the header showing NQ1! at 30,813.50 and the 30-minute layout with the header at 30,813.25, and both confirm the December contract, NQZ26.
Every upside strike is behind the market
The published positioning levels come from the evening desk note and stay in cash terms. A modeled volatility threshold at 29,410, a primary gamma concentration strike at 29,500, a call-side hedging boundary at 29,475, a put-side hedging boundary at 28,500 and a modeled gamma-flip level at 29,127. The volatility threshold and the gamma-flip level are modeled underlying-price thresholds produced by the provider's model and not listed contracts, and they are labelled as such; the concentration strike and the two hedging boundaries sit on listed strikes. All five carry the source date of the September 21, 2026 evening edition and move as positioning changes. The fund-proxy equivalents published in the same table read 719, 720, 725, 700 and 714.
Now the structural fact. The cash Nasdaq-100 closed near 30,508, above all three published upside boundaries. The listed key levels for the index are 29,500, 29,475, 30,000 and 28,500, and the published combination levels are 29,792, 30,000, 29,585 and 28,755. Every one of them sits beneath the close. A market trading above the strikes where hedging demand is concentrated has left that mechanical support behind it, and the practical consequence is that positioning offers less of a cushion on a pullback than the raw gamma-tilt figure of 1.393 would imply on its own.
Volume and open interest both lean to puts on the desk note's table. Nasdaq-100 call volume ran 12,739 contracts against put volume of 12,969, and the fund proxy showed call volume of 1.079 million against put volume of 1.334 million. Nasdaq-100 call open interest reads 70,245 against put open interest of 100,248, and the fund proxy 4.705 million against 6.510 million. Puts lead on both books. The 25-delta risk reversal reads minus 0.046 on the Nasdaq-100 and minus 0.036 on the fund proxy, a mild skew toward downside protection. Gamma notional reads 13.46 million dollars on the Nasdaq-100 and 257.746 million on the fund proxy. Gamma tilt reads 1.393 on the Nasdaq-100, the highest of the six instruments in that table. The reference prices behind those rows are 29,644 for the index and 721 for the fund proxy, both prior-session closes, and the broad-index outlook carries the same table from its own side.
A second dataset points the same way on a dated read. The positioning hub's fund row carries a build stamp of September 19, 2026 and shows a current price of 741.29 against a previous close of 716.92 on volume of 36,358,508 shares, with a 52-week high of 748.64 and a 52-week low of 555.60. Call gamma reads minus 401 million and put gamma minus 3 billion, and next-expiry gamma reads 25.58 percent. Both gamma figures print negative. The broad-index row captured in the same pass shows positive call gamma of 8.7 billion against negative put gamma of 1.8 billion, so the two surfaces are configured differently, and a book short convexity on both wings dampens nothing and amplifies a move in either direction. Two caveats travel with that row. The hub's low volatility point renders at 900 while its high volatility point renders at 720. That is the same label inversion observed on the bullion fund in this package, so both fields are treated as low confidence and excluded from the level structure. Its fund previous close of 716.92 also fails to reconcile with the desk note's fund reference price of 721, a difference of 4.08 dollars or 0.566 percent, consistent with that September 19, 2026 build stamp. No level in the ladder above is sourced from the hub. No futures translation of any cash level appears anywhere in this outlook.
At 14.86, up 0.07, the volatility index barely moved through a 2.9 percent index advance, and the volatility-of-volatility index closed at 85.77, both described as relatively flat in the evening desk note. Broad-index at-the-money implied volatility for Tuesday reads 9.9 percent, toward the lower end of the past year's range. Fixed-strike volatility rose 1 to 3 points across the surface, the spot-up and volatility-up signature that accompanied the semiconductor move. The dollar index firmed 0.20 percent on hawkish policy commentary, and longer-dated yields slipped according to the same note, with no precise 10-year level captured and none asserted here.
Policy is what should have stopped this. Investment-bank commentary in the news feed records a unanimous 25 basis point hike in September to a 3.75 to 4.00 percent target range, and projections published at 02:00 PM ET on September 16 show 12 of 18 officials expecting one further 25 basis point increase this year. A regional policymaker said at 02:19 PM ET that rates likely need to rise further and at 02:20 PM ET that it is better for increases to be earlier and incremental. The most duration-sensitive index of the four in this package rallied 2.9 percent into that commentary. That is the clearest evidence available that the artificial-intelligence earnings narrative currently outweighs the discount rate. Geopolitical risk cut the other way and eased. Iran's foreign minister arrived in New York for the United Nations General Assembly at 04:14 PM ET, Qatar stated at 03:02 PM ET that it was working to facilitate an agreement between Iran and the United States, and the front crude contract settled at 92.37 with the expiring contract down 4.51 percent. Cheaper energy lowers input costs and headline inflation, which lowers the expected policy path, which supports long-duration equities. The 04:14 PM ET arrival and the afternoon index strength coincided, and with no intraday series captured, no ordering between the two is asserted.
The trade map for Tuesday
The primary setup is a long from 30,540 to 30,700, bidding a pullback toward the Pivot Point at 30,517.17. That is the structurally cheapest way to join a contract that settled 267.58 points above its own pivot, in the top tenth of a double-range day, with price above all five moving averages and the composite reading 72 percent buy at its strongest direction. The stop is 30,440, beneath the Pivot Point that defines the constructive read. The first target is 30,863, Monday's completed-session high and the 1-month high on the same price. The second is 31,130 at Pivot R1. The third is 31,386, the 52-week high and the structural ceiling of the past year. Buying a double-range day at the top of its range carries elevated reversal risk, and this outlook states that plainly in the setup rationale.
Overhead the ladder is well spaced. A clean break of 30,863 opens Pivot R1 at 31,130, then the short-horizon target price at 31,195 just above it. Then the 31,294 to 31,386 band, where the 13-week high at 31,293.50 and the 52-week high at 31,385.50 sit 91.5 points apart. That band is the structural ceiling. Above the annual high, the 1 standard deviation resistance band at 31,415 is calculated on the closing price over the past five sessions. Pivot R2 is 31,476 with the 2 standard deviation band at 31,675.65 beyond it, and Pivot R3 at 32,089 carries the 3 standard deviation band at 31,875.88 between itself and Pivot R2. Wide session, wide ladder. Those outer projections are the arithmetic of one exceptionally wide session and should be read as projection and not as forecast.
Beneath the market the references come quickly. The Globex low at 30,779 sits within 6 points of the settlement, the Pivot Point at 30,517 is the first mechanical support, and the 14-3 day raw stochastic at 80 percent marks 30,501 immediately beneath it. Then 30,227, where price would cross its 9-day and 18-day moving average pairing. A loss of 30,517 turns attention to the 30,155 to 30,172 confluence, where the 1 standard deviation support band and the Pivot S1 and retracement pairing overlap, and a failure there puts the 29,958 retracement and the 29,904 session low back in scope. Under those sit the 20-day average at 29,689, the 50-day at 29,579.13, Pivot S2 at 29,558, Pivot S3 at 29,212.83 and the 1-month low at 29,053.00.
Session by session, the bands narrow the question. Globex is framed at 30,600 to 30,950, skewed higher while the contract holds above the 30,517 Pivot Point, and London carries the same 30,600 to 30,950 with macro items only. The first hour after the 09:30 AM ET cash open is framed at 30,650 to 31,000. That open is the first full-liquidity referendum on whether Monday's single-theme advance broadens or narrows. The run into the 04:00 PM ET cash close is framed at 30,600 to 31,050, with settlement most likely inside 30,700 to 30,950. Across the full session the low-range case is 30,650 to 31,000, the mid-range and most likely case 30,450 to 31,150, and the high-range case 30,100 to 31,400.
Tuesday's calendar is speakers, one survey and one auction. A European central-bank speaker opens the new day at 04:30 AM ET. A United Kingdom industrial orders survey follows at 06:00 AM ET with a consensus of minus 35 against a prior minus 25. Two further European central-bank speakers land at 08:30 AM ET and an international financial institution address at 09:00 AM ET, all reported by the news-feed calendar captured for this run and unconfirmed against the verified forward calendar. Macro items only. The United States morning carries a European consumer confidence flash at 10:00 AM ET with a consensus of minus 16 against a prior minus 15.5 and a United States central-bank speaker at 10:05 AM ET, both unconfirmed on the same basis. Then the verified item. A central-bank vice chair speaks at 10:20 AM ET on discount window modernisation and Treasury market functioning, and that one reconciles to the verified forward calendar. The afternoon brings the two-year note auction at 01:00 PM ET with a prior high yield of 4.204 percent and a prior bid-to-cover of 2.600, plus a further United States central-bank speaker at the same hour, both news-feed items and unconfirmed. A European central-bank speaker follows at 03:30 PM ET, then Australian flash purchasing managers indices at 07:00 PM ET. The auction is the single first-order event for this index, because the front end of the curve prices the discount rate the Nasdaq is most sensitive to. A tail at the front end transmits here faster than to the broad index.
Further out, the verified forward calendar carries new residential sales on September 24, 2026 at 10:00 AM ET, a large retailer's results after the close on September 24, 2026 at 05:00 PM ET and the advance durable goods report on September 25, 2026 at 08:30 AM ET. United States flash purchasing managers indices land on September 23, 2026 at 09:45 AM ET with a composite consensus of 54.8 against a prior 56.0, reported by the news-feed calendar captured for this run and unconfirmed against the verified forward calendar. No large-capitalisation technology earnings fall inside the Tuesday window on the verified forward calendar.
The most probable Tuesday is a narrower session that holds the 30,517 Pivot Point and works toward the 30,863 prior high, where Monday's session high and the 1-month high sit on the same price. A clean break of 30,863 opens 31,130 and then the 31,294 to 31,386 band. A loss of 30,517 hands the session to the 30,155 to 30,172 confluence, and a failure there puts 29,904 back in scope. Given that Monday realised exactly twice its 14-day average true range and closed in the top tenth of that range, the reversal tail deserves more weight than the composite reading alone would suggest.
Every strike that would have cushioned a pullback now sits behind the market.
The complete data picture
Every number behind Tuesday’s plan, charted first, then the full level map, then the complete numeric reference underneath.
Full numeric reference, every remaining figure from the session review
3.1 Resistance, level by level
30,821 is the high of the new Globex session dated Tuesday, printed at 30,821.25, the nearest reference the reopened market has set.
30,863 is Monday's completed-session high at 30,862.75 and the 1-month high in the same price, confirmed by two independent readings, which makes it the most important immediate level in the structure and the first Primary Setup target.
31,130 is Pivot R1, the first mechanical projection above the market and the second Primary Setup target.
31,195 is the provider's target price, a short-horizon projection sitting just above Pivot R1.
31,294 is the 13-week high at 31,293.50, and the 52-week high at 31,385.50 sits 91.5 points above it, so the 31,294 to 31,386 band is the structural ceiling of the past year. The 31,386 edge is the third Primary Setup target.
31,415 is the 1 standard deviation resistance band, calculated on the closing price over the past five sessions, and it sits just above the annual high.
31,476 is Pivot R2 at 31,475.92, with the 2 standard deviation band at 31,675.65 beyond it.
32,089 is Pivot R3 at 32,089.08, the extended upside projection from Monday's exceptionally wide range, and the 3 standard deviation band at 31,875.88 sits between it and Pivot R2 at 31,476.
3.2 Support, level by level
30,779 is the low of the new Globex session dated Tuesday, printed at 30,778.50, and it sits within 6 points of Monday's settlement, which describes a market holding its gains overnight.
30,517 is the Pivot Point at 30,517.17, computed from Monday's completed session, and it is the first mechanical support and the level that defines the constructive read.
30,501 is the 14-3 day raw stochastic at 80 percent, a short-horizon shelf immediately beneath the pivot.
30,227 is the level at which price would cross its 9-day and 18-day moving average pairing.
30,172 is Pivot S1 at 30,171.58, and the 38.2 percent retracement from the four-week high at 30,171.42 sits sixteen hundredths of a point away, the tightest confluence in the structure and the first genuine pullback objective.
30,155 is the 1 standard deviation support band, reinforcing that same area.
29,958 is the 50 percent retracement from the four-week high and low at 29,957.88, coinciding with the 14-3 day raw stochastic at 50 percent.
29,904 is Monday's completed-session low at 29,904.00, derived from the pivot ladder, and the structural base of the advance.
29,689 is the 20-day moving average at 29,689.19, with the 50-day at 29,579.13 just beneath it.
29,558 is Pivot S2 at 29,558.42, and Pivot S3 at 29,212.83 sits below with the 1-month low at 29,053.00 beneath that.
1. Executive summary
The Nasdaq had its best session in six weeks and did it on the back of a single theme. The December contract settled at 30,784.75 after a completed session that ran from 30,862.75 down to 29,904.00, a span of 958.75 points, and closed 91.9 percent of the way up that range. The settlement sits 267.58 points above the Pivot Point at 30,517.17, which leaves the mechanical ladder tilted higher into Tuesday.
The driver was concentrated artificial-intelligence and semiconductor enthusiasm and not a broad macro impulse. META rose 11 percent on optimism around its new model offering and was the single largest contributor to the broad index advance. The semiconductor sector gained 5 percent, with AMD up 10 percent and crossing a one trillion dollar market capitalisation for the first time at 10:16 AM ET, INTC up 12 percent and ARM up 17 percent. GOOGL unveiled a line of artificial-intelligence laptops priced from 899 dollars at 09:02 AM ET. Single-stock hedging flow captured in the evening desk note registered roughly plus 8 billion dollars of delta, the largest reading of the past 30 days, with 75 percent of it from the seven largest names, while index-level hedging flow ran about minus 2 billion dollars on same-day-expiry call selling and longer-dated put buying. The market bought individual technology names and simultaneously paid for index protection.
The structural contradiction heading into Tuesday is that the cash index has traded clear above every upside positioning boundary the desk note publishes. The Nasdaq-100 call-side hedging boundary sits at 29,475 and the primary gamma concentration strike at 29,500, both beneath a cash index that closed near 30,508. When price runs above the strikes where dealer hedging demand is concentrated, the mechanical support that positioning provides on the way up is behind the market. Against that, the 14-day raw stochastic reads 95.69 percent, which is as stretched as that measure gets.
Volatility expectations are framed off a 14-day average true range of 479.41 points, which is 1.56 percent of settlement, and a 14-day average daily range of 450.25 points. Monday's realised 958.75 point span was exactly 200 percent of the 14-day average true range, a double-range day. The Primary Setup is a long on a pullback toward the Pivot Point, with the explicit acknowledgement that buying a double-range day at the top of its range carries elevated reversal risk.
A coverage note belongs on the record. The positioning hub ignored all three URL request forms for the Nasdaq exchange-traded fund and returned broad-index data under each, so the fund row was captured on a repair pass by sorting the filtered watchlist grid until the exact row rendered. A control read of the broad-index row in the same pass returned figures identical to the earlier capture, which confirms the grid was serving the same dataset. The positioning section below therefore carries both the desk note's own Nasdaq-100 and fund columns and the hub's fund row, with the reconciliation between them stated explicitly.
2.1 Intraday and Session Review
The completed December session is recovered from the published pivot ladder and not from an independently read bar. The outer pairs agree: the third-level resistance at 32,089.08 less the third-level support at 29,212.83, divided by three, gives 958.75, and the second-level pair of 31,475.92 and 29,558.42, divided by two, gives the same 958.75. Solving against a Pivot Point of 30,517.17 and a settlement of 30,784.75 returns a session high of 30,862.75 and a session low of 29,904.00, and those two values reproduce all seven published levels.
There is independent corroboration for the high: the separately published 1-month high of 30,862.75 is the same number to the tick, which means Monday's session high was also the highest print of the past month. These are the completed-session inputs behind the published pivot ladder and not an independently read bar, and no intraday series was captured for this run, so the sequence within the session is not asserted here.
Computed from the same high, low and settlement, the closing-range position is 91.9 percent, so the settlement landed in the top tenth of a 958.75 point range. The new Globex session dated Tuesday, September 22 opened at 30,780.00, has traded between 30,778.50 and 30,821.25, and was last quoted near 30,813 on 3,181 contracts. Those figures belong to the new session and are not part of Monday's completed range.
2.2 Daily Structure
December carries 256,290 contracts of open interest. The 5-day change is a gain of 1,335.25 points, or 4.53 percent, so the advance is a week old rather than a day old.
The 52-week high at 31,385.50 sits 1.95 percent above settlement and the 13-week high at 31,293.50 sits just beneath it, so the contract closed within 2 percent of its annual peak. The 52-week low at 23,429.00 is 23.89 percent below. The 1-month low at 29,053.00 sits 1,731.75 points beneath settlement, which places the current price at the very top of its one-month distribution.
2.3 4-Hour and Swing Structure
The higher-timeframe layout was read at the daily interval with the header showing NQ1! at 30,813.50, and the 30-minute layout was read with the header showing NQ1! at 30,813.25. Both confirm the December contract.
The swing structure is a sequence of higher lows into a test of the annual high. The 38.2 percent retracement from the four-week high sits at 30,171.42, within 0.16 points of Pivot S1 at 30,171.58, and that pairing defines the first meaningful pullback shelf.
The 50 percent retracement from the four-week high and low at 29,957.88 coincides with the 14-3 day raw stochastic at 50 percent, reinforcing the 29,904 to 29,958 area as the structural base of the advance.
2.4 Moving Averages
The stack is bullish and price sits above every average. The 5-day sits at 29,789.70, 995.05 points below settlement, the 20-day at 29,689.19, the 50-day at 29,579.13, the 100-day at 29,791.80 and the 200-day at 27,879.42.
The one point of friction is that the 100-day at 29,791.80 sits above the 50-day at 29,579.13, a residue of the earlier consolidation that has not yet resolved.
Price above all five averages with the shortest average 995 points below is a strong trend reading and simultaneously a stretched one; the distance from the 5-day average is itself the extension that mean reversion would target.
2.5 Oscillator and Trend Readings
The 14-day relative strength measure reads 65.13, up 10.50 points, with the 9-day at 72.51 and the 20-day at 60.47. The 9-day is approaching the conventional overbought threshold while the 14-day is not.
The 14-day raw stochastic is 95.69 percent with stochastic percent K at 82.24 percent and percent D at 57.29 percent, and the 9-day and 20-day raw stochastics read the same 95.69 percent. A raw stochastic reading 95.69 percent across three lookbacks describes a settlement at the extreme top of its recent distribution.
The 14-day directional index reads 14.52 with the positive directional indicator at 29.16 against the negative at 16.80, and the 9-day directional index is 19.94. A directional index in the mid-teens with the positive indicator nearly twice the negative describes a young directional move that has not yet built trend strength, which is a constructive and not a cautionary reading.
Historic volatility is 17.30 percent on the 14-day window and 19.05 percent on the 9-day. The multi-indicator composite prints 72 percent buy with the current strength reading strong and the current direction reading strongest, the composite trend signal reads buy and the short-term group is at 100 percent buy.
2.6 Volatility and Expected Range
The 14-day average true range is 479.41 points at 1.56 percent of settlement, the 9-day is 483.88 points at 1.57 percent and the 20-day is 493.76 points at 1.60 percent.
The 14-day average daily range is 450.25 points at 1.46 percent and the 20-day average daily range is 425.10 points at 1.38 percent.
A one-average-true-range projection from the 30,784.75 settlement gives 30,305.34 to 31,264.16 for Tuesday. Monday's realised span of 958.75 points was exactly twice the 14-day average true range, and back-to-back double-range days are uncommon, so a narrower Tuesday is the base expectation even if direction continues.
4.1 Mag7 Earnings and AI Capex Cycle
Monday was an artificial-intelligence narrative session. META rose 11 percent on optimism around its new model offering and was the largest single contributor to the broad index advance; the evening desk note records roughly plus 2 billion dollars of hedging flow in that name alone and a move of 76 dollars, close to five times the 16 dollar move the options market had priced.
GOOGL unveiled artificial-intelligence laptops priced from 899 dollars at 09:02 AM ET with availability from October 4. Competitive news ran heavily through the morning, with a rival model release priced at 2 dollars per million input tokens at 11:50 AM ET and reports at 10:34 AM ET of a competing response under development.
The verified forward calendar carries no large-capitalisation technology earnings inside the Tuesday window; the nearest captured after-close report is a large retailer on September 24, 2026 at 05:00 PM ET.
4.2 Semiconductor Cycle and Tech Sector Rotation
The semiconductor complex led. The sector gained 5 percent, AMD rose 10 percent and crossed a one trillion dollar market capitalisation for the first time at 10:16 AM ET, INTC rose 12 percent and ARM rose 17 percent.
The evening desk note records that a semiconductor fund rallied 23 points, more than twice its 11 dollar implied move, and that the constructive semiconductor setup had been flagged in that note's prior edition on the basis of call skew in the 90th percentile against implied-volatility rank in the 7th percentile.
That combination, expensive skew against cheap outright volatility, is the mechanical description of options that were underpriced relative to the move they subsequently made.
4.3 Fed Policy and Real Yields (Duration Sensitivity)
Policy is tightening and the Nasdaq is the most duration-sensitive of the four instruments in this package, which makes Monday's rally notable and not routine. Investment-bank commentary in the news feed records a unanimous 25 basis point hike in September to a 3.75 to 4.00 percent target range.
Projections published at 02:00 PM ET on September 16 show 12 of 18 officials expecting one further 25 basis point increase this year. On Monday a regional policymaker said at 02:19 PM ET that rates likely need to rise further and at 02:20 PM ET that it is better for increases to be earlier and incremental.
A long-duration equity index rallying 2.9 percent into hawkish commentary is the clearest evidence available that the artificial-intelligence earnings narrative is currently outweighing the discount rate.
4.4 Geopolitical Backdrop
Geopolitical risk eased and that eased the index. Iran's foreign minister arrived in New York for the United Nations General Assembly at 04:14 PM ET, Qatar stated at 03:02 PM ET that it was working to facilitate an agreement between Iran and the United States, and the front crude contract settled at 92.37 with the expiring contract down 4.51 percent.
Lower energy lowers input costs and headline inflation, which lowers the expected policy path, which supports long-duration equities.
The 04:14 PM ET arrival and the afternoon index strength coincided; no intraday series was captured, so no ordering between the two is asserted.
4.5 Cross-Asset and Volatility
The volatility complex stayed calm through a 2.9 percent index advance. The volatility index closed at 14.86, up 0.07, and the volatility-of-volatility index at 85.77, both described as relatively flat in the evening desk note.
Broad-index at-the-money implied volatility for Tuesday reads 9.9 percent, toward the lower end of the past year's range. Fixed-strike volatility rose 1 to 3 points across the surface, which is the spot-up, volatility-up signature that accompanied the semiconductor move.
The dollar index firmed 0.20 percent on hawkish policy commentary. Longer-dated yields slipped according to the evening desk note; a precise 10-year level was not captured and is not asserted here.
4.6 Institutional Positioning
The evening desk note's index positioning table gives the Nasdaq-100 a reference price of 29,644 and the fund proxy a reference of 721, both prior-session closes.
Nasdaq-100 call volume ran 12,739 contracts against put volume of 12,969, and the fund proxy showed call volume of 1.079 million against put volume of 1.334 million, so put volume exceeded call volume on both. Nasdaq-100 call open interest reads 70,245 against put open interest of 100,248, and the fund proxy 4.705 million against 6.510 million.
The 25-delta risk reversal reads minus 0.046 on the Nasdaq-100 and minus 0.036 on the fund proxy, a mild skew toward downside protection. Gamma notional reads 13.46 million dollars on the Nasdaq-100 and 257.746 million on the fund proxy, and gamma tilt reads 1.393 on the Nasdaq-100, the highest of the six instruments in that table.
5. Options Flow Context (Proxy)
This run uses two Nasdaq positioning datasets: the index positioning table published in the evening desk note, which carries its own Nasdaq-100 and fund columns, and the fund row from the positioning hub. The published levels come from the desk note; the hub row is used as lower-confidence context for the reason given at the end of this section.
The published levels, all on the cash Nasdaq-100 unless stated, are a modeled volatility threshold at 29,410, a primary gamma concentration strike at 29,500, a call-side hedging boundary at 29,475, a put-side hedging boundary at 28,500 and a modeled gamma-flip level at 29,127. The volatility threshold and the gamma-flip level are modeled underlying-price thresholds produced by the provider's model and not listed contracts, and are labelled as such; the concentration strike and the two hedging boundaries sit on listed strikes. All five carry the source date of the September 21, 2026 evening edition and move as positioning changes. The fund-proxy equivalents published in the same table are a volatility threshold at 719, a concentration strike at 720, a call-side boundary at 725, a put-side boundary at 700 and a gamma-flip level at 714.
The structurally important fact is that the cash Nasdaq-100 closed near 30,508, which is above all three of the published upside boundaries. The listed key levels for the index are 29,500, 29,475, 30,000 and 28,500, and the published combination levels are 29,792, 30,000, 29,585 and 28,755. Every one of them sits beneath the close. A market trading above the strikes where hedging demand is concentrated has left that mechanical support behind it, and the practical consequence is that positioning offers less of a cushion on a pullback than the raw gamma-tilt figure of 1.393 would imply on its own.
The hub's fund row, carrying a build stamp of September 19, 2026, reads a current price of 741.29 against a previous close of 716.92 on volume of 36,358,508 shares, with a 52-week high of 748.64 and a 52-week low of 555.60. Call gamma reads minus 401 million and put gamma reads minus 3 billion, and next-expiry gamma reads 25.58 percent. Both gamma figures being negative is the structurally interesting part: the broad-index row captured in the same pass shows positive call gamma of 8.7 billion against negative put gamma of 1.8 billion, so the two surfaces are configured differently. A book short convexity on both wings dampens nothing and amplifies a move in either direction, which sits consistently with the observation above that the cash index has run clear of the strikes where hedging demand is concentrated.
Two caveats are recorded explicitly. The hub's low volatility point renders at 900 while its high volatility point renders at 720, the same label inversion observed on the bullion fund in this package, so both fields are treated as low-confidence and excluded from the level structure. Separately, the hub's fund previous close of 716.92 does not reconcile with the desk note's fund reference price of 721, a difference of 4.08 dollars or 0.566 percent, which is consistent with the hub's September 19, 2026 build stamp. No published level is sourced from the hub.
No futures-price translation of any of these cash levels appears in this outlook.
Night Session (6:00 PM ET Monday to 3:00 AM ET Tuesday, Globex and Asia)
The reopened session has traded a 42.75 point band between 30,778.50 and 30,821.25, holding within 6 points of Monday's settlement at its low, which describes retention of the advance and not distribution of it.
Asian technology names are the transmission channel for the semiconductor story overnight. Expected Globex range is 30,600 to 30,950, skewed higher while the market holds above the 30,517 Pivot Point.
The captured calendar's first item of the new day is a European central-bank speaker at 04:30 AM ET, reported by the news-feed calendar captured for this run and unconfirmed against the verified forward calendar.
London Session (3:00 AM to 8:00 AM ET Tuesday)
European hours rarely drive the Nasdaq directly, and the captured items are macro and not technology. Expected range 30,600 to 30,950.
The captured calendar carries a European central-bank speaker at 04:30 AM ET, a United Kingdom industrial orders survey at 06:00 AM ET with a consensus of minus 35 against a prior minus 25, and two further European central-bank speakers at 08:30 AM ET, all reported by the news-feed calendar captured for this run and unconfirmed against the verified forward calendar.
Morning Session (9:30 AM to 12:00 PM ET Tuesday, RTH Open)
The cash open at 09:30 AM ET sets the session's first directional test, and it is the first full-liquidity referendum on whether Monday's single-theme advance broadens or narrows. Expected first-hour range 30,650 to 31,000.
The captured calendar carries a European consumer confidence flash at 10:00 AM ET with a consensus of minus 16 against a prior minus 15.5 and a United States central-bank speaker at 10:05 AM ET, both reported by the news-feed calendar captured for this run and unconfirmed against the verified forward calendar, and a United States central-bank vice chair speaking at 10:20 AM ET on discount window modernisation and Treasury market functioning, which reconciles to the verified forward calendar.
Afternoon Session (12:00 PM to 4:00 PM ET Tuesday)
The afternoon carries a two-year note auction at 01:00 PM ET, prior high yield 4.204 percent and prior bid-to-cover 2.600, reported by the news-feed calendar captured for this run and unconfirmed against the verified forward calendar, and a further United States central-bank speaker at the same hour, also unconfirmed.
Because the Nasdaq is the most duration-sensitive index in the package, a tail at the front end transmits here faster than to the broad index. Expected range into the 04:00 PM ET cash close is 30,600 to 31,050, with settlement most likely inside 30,700 to 30,950.
Night Session Forward (6:00 PM ET Tuesday)
Residual bias into the Globex reopen is constructive while the December contract holds above the 30,517 Pivot Point, with the 30,863 prior high and the 31,130 Pivot R1 as the objectives and the 31,294 to 31,386 band as the structural ceiling.
Attention then turns to the United States flash purchasing managers indices on September 23, 2026 at 09:45 AM ET, reported by the news-feed calendar with a composite consensus of 54.8 against a prior 56.0 and unconfirmed against the verified forward calendar.
Expected Range (Tuesday Full Session)
Low-range scenario: 30,650 to 31,000
Mid-range scenario (most likely): 30,450 to 31,150
High-range scenario: 30,100 to 31,400
Most Likely Path
The most probable Tuesday is a narrower session that holds the 30,517 Pivot Point and works toward the 30,863 prior high, where Monday's session high and the 1-month high sit on the same price. A clean break of 30,863 opens Pivot R1 at 31,130 and then the 31,294 to 31,386 structural band.
A loss of 30,517 turns attention to the 30,155 to 30,172 confluence where Pivot S1 and the 38.2 percent retracement from the four-week high overlap within a fraction of a point, and a failure there would put the 29,904 session low back in scope.
Given that Monday realised exactly twice its 14-day average true range and closed in the top tenth of that range, the reversal tail deserves more weight than the composite reading alone would suggest. Scenario weightings are analyst judgment and carry no derived frequency.
7. Tuesday Economic Calendar
The captured calendar for Tuesday contains European and United States policy speakers, a European consumer confidence flash and a two-year note auction, all reported by the news feed and unconfirmed against the verified forward calendar except where noted. The overnight Asian block contains speaker items only.
European hours open with a central-bank speaker at 04:30 AM ET and a United Kingdom industrial orders survey at 06:00 AM ET with a consensus of minus 35 against a prior minus 25, then two further European central-bank speakers at 08:30 AM ET and an international financial institution address at 09:00 AM ET.
The United States morning carries a European consumer confidence flash at 10:00 AM ET with a consensus of minus 16 against a prior minus 15.5 and a central-bank speaker at 10:05 AM ET, both news-feed items and unconfirmed, followed by a central-bank vice chair at 10:20 AM ET speaking on discount window modernisation and Treasury market functioning, which reconciles to the verified forward calendar.
The afternoon carries a two-year note auction at 01:00 PM ET with a prior high yield of 4.204 percent and a prior bid-to-cover of 2.600, plus a central-bank speaker at the same hour, both news-feed items and unconfirmed. A European central-bank speaker follows at 03:30 PM ET and Australian flash purchasing managers indices land at 07:00 PM ET, both news-feed items and unconfirmed.
The single first-order event for the Nasdaq on Tuesday is the two-year note auction at 01:00 PM ET, reported by the news feed and unconfirmed against the verified forward calendar, because the front end of the curve prices the discount rate this index is most sensitive to.
Looking further out, the verified forward calendar carries new residential sales on September 24, 2026 at 10:00 AM ET, a large retailer's results after the close on September 24, 2026 at 05:00 PM ET, and the advance durable goods report on September 25, 2026 at 08:30 AM ET.
8. Primary Trade Setup
Direction: Long
Rationale: The December contract settled 267.58 points above its own Pivot Point at 30,517.17 and in the top tenth of a double-range day, with price above all five moving averages and the composite reading 72 percent buy at its strongest direction; a pullback toward the pivot is the structurally cheapest way to join that without buying the high.
Entry Zone: 30,540 to 30,700
Stop Loss: 30,440 (beneath the Pivot Point at 30,517.17, which is the level that defines the constructive read)
Target 1 (T1): 30,863 (Monday's completed-session high, which is also the 1-month high, the most important immediate level)
Target 2 (T2): 31,130 (Pivot R1, the first mechanical projection above the market)
Target 3 (T3, extended): 31,386 (the 52-week high, the structural ceiling of the past year)
Risk-to-Reward: Approximately 1:1.4 to T1, 1:2.8 to T2, 1:4.3 to T3, measured from the 30,620 midpoint of the entry zone against the 30,440 stop, which is 180 points of risk.
Invalidation: A sustained session beneath 30,517 negates the long thesis and turns attention to the 30,155 to 30,172 confluence and then the 29,904 session low.
Macro override: A weak two-year note auction at 01:00 PM ET (reported by the news-feed calendar captured for this run and unconfirmed against the verified forward calendar) that lifts front-end yields, a hawkish surprise from the 10:05 AM ET or 10:20 AM ET speakers, or an adverse artificial-intelligence headline in the names that drove Monday would invert this setup in real time. A dovish tone plus continued semiconductor leadership would accelerate it.
Sources and methodology
This outlook is built from our session review of the December E-mini Nasdaq-100 contract, NQZ26, the December ’26 contract, prepared after Monday's close on September 21, 2026 for the Tuesday, September 22 session. The completed session is recovered from the published pivot ladder: the outer pivot pairs both give a 958.75 point span, and solving against the 30,517.17 Pivot Point and the 30,784.75 settlement returns the 30,862.75 high and the 29,904.00 low that reproduce all seven published levels, with the separately published 1-month high of 30,862.75 corroborating the high to the tick. No intraday series was captured for this run, so no sequence within the session is asserted. Index positioning levels are quoted in cash terms as published and are never converted into futures prices.
Two positioning datasets are kept apart on purpose. The desk note's index table supplies every published level; the positioning hub's fund row carries a September 19, 2026 build stamp and a fund previous close of 716.92 that does not reconcile with the note's 721 reference, a difference of 4.08 dollars or 0.566 percent, so it is used as lower-confidence context only and no level is sourced from it. The hub's two volatility-point fields rendered inverted at 900 and 720 and are excluded from the level structure. Scenario ranges and session windows are analyst judgment and carry no calibration. Scheduled items marked unconfirmed come from the news-feed calendar captured for this run and were not verified against the verified forward calendar. A precise 10-year yield level, the 9-day directional components, the fund proxy's key-strike list and any futures translation of a cash level were not captured in this run and no figure is stated for any of them.
Monday’s outlook for this contract is here and the broad-index outlook for the same date is here. Outlooks for ES, NQ, GC and CL are collected on the market outlook page, and our forward trading record is on the performance statement.



