
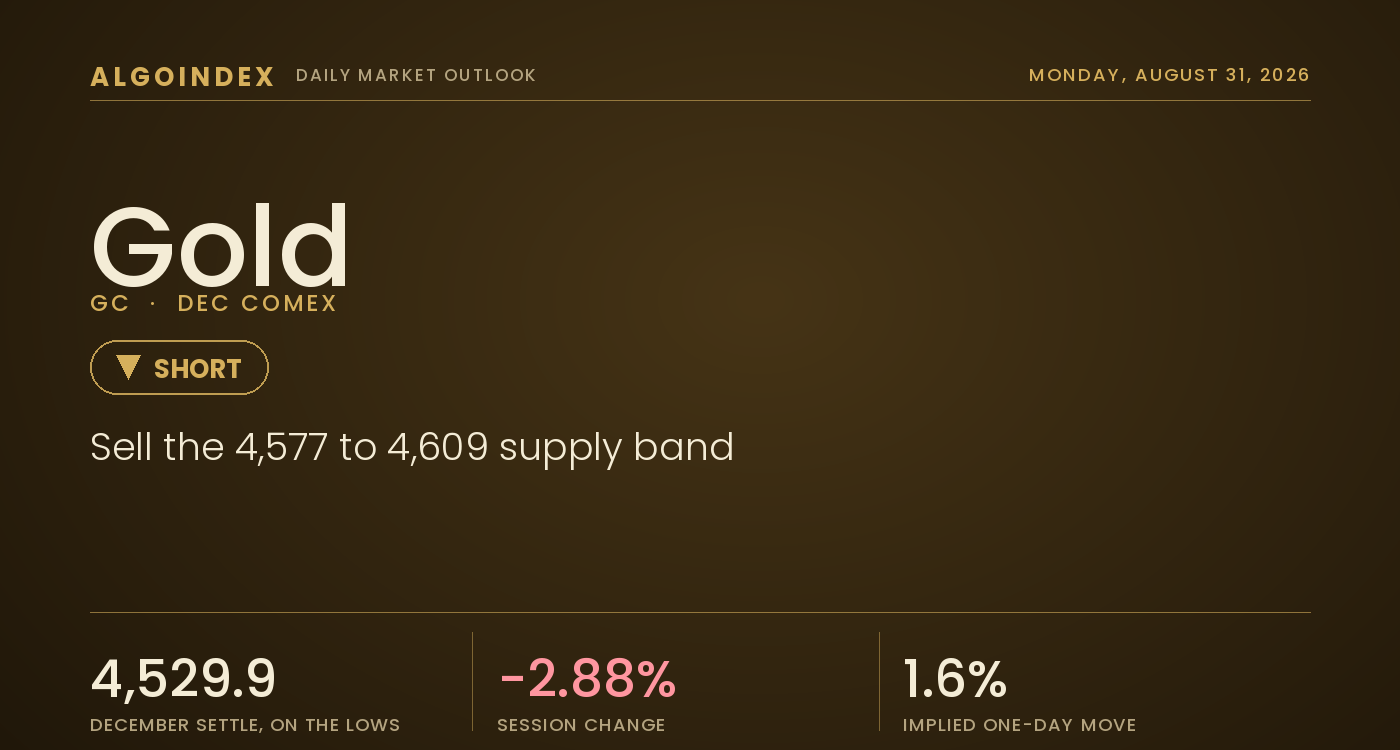
Gold suffered its heaviest single-session break in weeks on Friday and closed near the lows of a wide range. The December contract settled at 4,529.9, down 134.1 points or about 2.88 percent from Thursday's 4,664.0 settle, after trading a 193-point band from a 4,688.0 high to a 4,495.0 low and finishing in the lower third of that range and beneath all three computed pivot support points. Volume of 268,759 contracts confirmed the move carried conviction rather than thin-liquidity noise. The shape and the size both matter here. A large-range distribution day that closes weak, below every near-term support, leaves the market on the back foot into a new week, and it does so from a session whose 193-point travel ran close to 1.8 times the metal's recent average daily range.
The driver was a hawkish repricing of Federal Reserve policy. The Federal Reserve Chair, speaking mid-morning, pledged to bring inflation back to target and cautioned that softer summer inflation prints did not mean underlying trends had improved, and interest-rate futures moved to price two 2026 rate increases from one. Short-dated yields jumped, the ten-year rose 1.05 percent to 4.718 percent, and the dollar index firmed 0.55 percent to 99.677, the two most direct headwinds for a non-yielding asset moving against it at once. The tension into Monday is between a decisively bearish near-term catalyst set and a deeply stretched technical condition. Friday's settle sits well below the daily pivot and only a short distance above the 52-week 38.2 percent retracement at 4,441.6, so the immediate downside is already extended even as the macro backdrop argues for more. Working the other way, an active Strait of Hormuz closure narrative drew no safe-haven bid on Friday, a sign the rate and dollar story controls positioning for now.
A weak close below every near-term support
The break did real structural damage. Against the 4,529.9 settle the reference averages read 4,642.7 on the 5-day, 4,466.9 on the 20-day, 4,272.6 on the 50-day, 4,475.7 on the 100-day and 4,640.5 on the 200-day, so Friday pushed price back beneath both the fast 5-day and the long-term 200-day in a single session while still holding above the 20-day, 50-day and 100-day. The year-to-date mean at 4,687.8 sits far overhead. The August 25 swing high at 4,755.0, the 13-week and one-month high, now stands as the near-term ceiling with price closed 5.28 percent below it. The most important intermediate reference is the convergence where the 20-day at 4,466.9 and the 100-day at 4,475.7 meet near 4,467 to 4,476: holding it keeps the larger uptrend alive, and a sustained break beneath it would convert Friday's shakeout into a genuine trend change.
Momentum eased toward neutral rather than into oversold, which is the tell that leaves room in both directions. The 9-day relative-strength reading sits at 49.21 and the 14-day at 54.36, both near the midline, while the 14-day stochastic shows percent-K at 63.47 and percent-D at 76.82, still elevated and beginning to roll. The standout is the multi-indicator composite, which collapsed to 16 percent buy from 72 percent a week and a month earlier, its near-term group flipping hard while the longer-horizon trend has not yet broken. The 9-day trend-strength reading of 42.44 marks a strong trend in force. Both the intact intermediate structure and the negative near-term posture cannot stay right through a data-light week, and the resolution runs through the 4,577 to 4,609 broken-support band overhead and the 4,467 to 4,476 average base beneath.
The 4,577 to 4,609 band is where the fade works
Two zones frame Monday. Above the 4,529.9 settle, the first ceiling is the broken 4,539.1 third pivot support that failed on Friday, reinforced by the 4,539.9 measured extension, then the 4,551.0 two-standard-deviation level and the 4,577 to 4,609 band where the 1.618 extension, the second pivot support and the one-standard-deviation level stack into the first meaningful supply, with the converged 200-day and 5-day averages near 4,640 to 4,643 forming the heavy structural ceiling above. Below, immediate support is the 4,525.6 three-standard-deviation level essentially at the settle, then the 4,505.4 crossing area and the 4,495.0 session low as the first true support base, with the 4,467 to 4,476 average convergence the intermediate base beneath and the 4,441.6 52-week retracement the deeper magnet. Dealers on the gold-ETF proxy carry net-short gamma, so moves around the 4,577 to 4,609 band and the 4,495 base are likely to run larger than a neutral-positioning session would produce.
Fade the bounce, respect 4,645, size it down
The plan fades a relief bounce into the 4,577 to 4,609 broken support-turned-resistance band, where the 1.618 measured extension and the second pivot support align, leaning on the hawkish repricing that lifted the dollar and the real-yield path rather than chasing a fresh low on a data-light Monday. The stop is 4,645, above the converged 200-day and 5-day average ceiling near 4,640 to 4,643, about 52 points from the 4,593 mid-band entry. Targets run to the 4,530 settle and three-standard-deviation level, then the 4,495 session low, then the 4,442 52-week retracement, reached only if the 4,467 to 4,476 average base gives way on volume, for reward-to-risk near 1 to 1.2, 1 to 1.9 and 1 to 2.9. Two live outs cut against it. A weekend Strait of Hormuz escalation that forces a safe-haven gap higher, or a sharp dollar reversal beneath 99.30, would override the technical read and argue for standing aside until price stabilizes, while a sustained reclaim of 4,645 with a softening dollar reopens 4,688 and the 4,697.5 retracement. Two full calendar days of headline exposure separate Friday's close from the Sunday-evening reopen, so size stays trimmed into the weekend gap risk. Our published record lays out how we grade these calls.
The near-term catalyst set turned decisively bearish as the dollar and real yields rose, and the multi-indicator composite collapsed from 72 percent buy to 16, yet Friday's settle is already stretched just above the 4,441.6 retracement and drew no safe-haven bid despite an active Hormuz narrative. Beneath the 4,645 ceiling the tilt favors fading a bounce into the 4,577 to 4,609 band. Selling the bounce that stalls, small, is the trade.
A heavy, high-conviction break that closes weak below every near-term support, from a level already stretched toward the 4,441.6 retracement, is a market on the back foot rather than a fresh trend that chases from here. The edge is fading the 4,577 to 4,609 band, and a sustained reclaim of 4,645 is the line that flips the read from short to sidelined.
This is the read our members get every session, before the bell, with the levels drawn and the setup defined. See how the same dealer-positioning work turns into systematic signals.
View pricingThe complete data picture
Every number behind Monday’s plan, charted first; the full numeric reference follows underneath.
Full numeric reference, every remaining figure from the review
| Average | Value | Settle vs |
|---|---|---|
| 5-day | 4,642.7 | below by 112.8 |
| 20-day | 4,466.9 | above by 63.0 |
| 50-day | 4,272.6 | above by 257.3 |
| 100-day | 4,475.7 | above by 54.2 |
| 200-day | 4,640.5 | below by 110.6, reclaimed by sellers |
| Year-to-date mean | 4,687.8 | below by 157.9 |
| Level | Reference |
|---|---|
| 5,781.8 | all-time high from late January, a distant reference |
| 4,755.0 | August 25 swing high, the 13-week and one-month ceiling |
| 4,702.5 | first pivot resistance |
| 4,697.5 | 52-week 50 percent retracement |
| 4,688.0 | session high, the upside extreme |
| 4,659.2 | daily pivot point |
| 4,642.7 | 5-day average, part of the heavy ceiling |
| 4,640.5 | 200-day average, reclaimed by sellers |
| 4,620.8 | first pivot support, now overhead |
| 4,609.4 | measured extension objective, 1.272, top of the fade band |
| 4,584.1 | one-standard-deviation support, breached |
| 4,577 to 4,609 | broken support-turned-resistance band, the short entry |
| 4,577.5 | second pivot support and 1.618 extension |
| 4,551.0 | two-standard-deviation support, breached intraday |
| 4,539.9 | measured extension objective, 2.0 |
| 4,539.1 | third pivot support that failed, the first ceiling |
| 4,529.9 | December settle |
| 4,525.6 | three-standard-deviation level, essentially the settle |
| 4,505.4 | 18-day average crossing area |
| 4,495.0 | session low, first true support base, target 2 |
| 4,487.2 | 38.2 percent retracement from the four-week high |
| 4,475.7 | 100-day average, the intermediate base |
| 4,472.5 | 38.2 percent retracement from the 13-week high |
| 4,466.9 | 20-day average, the intermediate base |
| 4,441.6 | 52-week 38.2 percent retracement, target 3 |
| 4,400.0 | prior-week low and volume shelf |
| 4,272.6 | 50-day average, the last line before a deeper corrective leg |
| Metric | Reading |
|---|---|
| Gold-ETF proxy last | 408.55, down 3.32 percent from a 422.60 prior close |
| Call-side dealer gamma | about negative 305 million, the dominant leg |
| Put-side dealer gamma | about positive 14 million, the smaller leg |
| Net positioning | net short gamma, dealers positioned to amplify directional moves rather than absorb them |
| One-day options-implied move | about 6.54 on the proxy, roughly 1.6 percent, mapping to about 72 gold points around the 4,530 settle |
| Implied-vol rank | about 35 percent, one-month implied volatility 24.5 percent against 25.1 percent realized |
| Skew rank | elevated near 62 percent, hedgers paying up for downside protection into the weekend |
| Put-to-call open interest | 0.46, call-heavy on an outright basis even as the skew move shows demand for puts |
| Volatility-inflection reference | a high-volatility inflection near 417 on the proxy, above the 408.55 close, treated as low-confidence given known labeling quirks in that dataset |
| Input | |
|---|---|
| Dollar index | firmed 0.55 percent to 99.677, close to a one-week high, the proximate weight on gold |
| 10-year yield | rose 1.05 percent to 4.718 percent, lifting the expected real-yield backdrop against a non-yielding asset |
| Fed and policy | the Federal Reserve Chair pledged to return inflation to target and pushed back on softer summer prints, and fed funds futures repriced from one to two 2026 rate increases |
| Data | a benchmark payrolls revision of minus 79,000 and a University of Michigan sentiment final of 51.7, with the one-year consumer inflation expectation holding at 4.0 percent |
| Crude oil | the international benchmark settled near 89.31, the United States front month near 83.40, a firm energy backdrop |
| Equities and volatility | the broad index off about 0.26 percent and the technology index off about 0.69 percent, the volatility gauge easing to 14.42, a muted reaction that isolated gold as the rate-sensitive mover |
| Geopolitics | the Strait of Hormuz declared closed to uncoordinated transit, yet gold drew no safe-haven bid, a sign the rate and dollar story controlled positioning |
| Volume and positioning | 268,759 December contracts changed hands, confirming conviction, with weekly positioning through August 25 predating the break |
| Overnight expectation | a neutral-to-lower lean within a roughly 60 to 90 point Globex band skewed to the downside absent a weekend geopolitical headline |
| When | Event |
|---|---|
| Mon Aug 31 | a light United States session with no first-order release; German preliminary inflation near 8:00 AM ET, the harmonized year-over-year expected near 3.1 percent, and the Chinese manufacturing surveys around the Asian reopen |
| Tue Sep 1 | job openings and the manufacturing activity survey, the first of the week labor-heavy set |
| Wed Sep 2 | the private-payrolls estimate, a read on hiring momentum |
| Fri Sep 4 | the monthly employment report, the first-order catalyst that will confirm or fade the two-increase rate path now driving gold |
The economic releases referenced above are published on the official government calendars below. Price levels are derived from standard technical and statistical methods, and the market read is AlgoIndex's own analysis. How we grade these calls is set out in our performance methodology.
- US Bureau of Economic Analysis, Personal Income and Outlays (PCE)
- US Bureau of Economic Analysis, Gross Domestic Product
- US Bureau of Economic Analysis, release schedule
- US Census Bureau, Advance Durable Goods (M3) release schedule
- US Energy Information Administration, Weekly Petroleum Status Report
- US Department of the Treasury, auction schedule and results
- AlgoIndex performance methodology



