
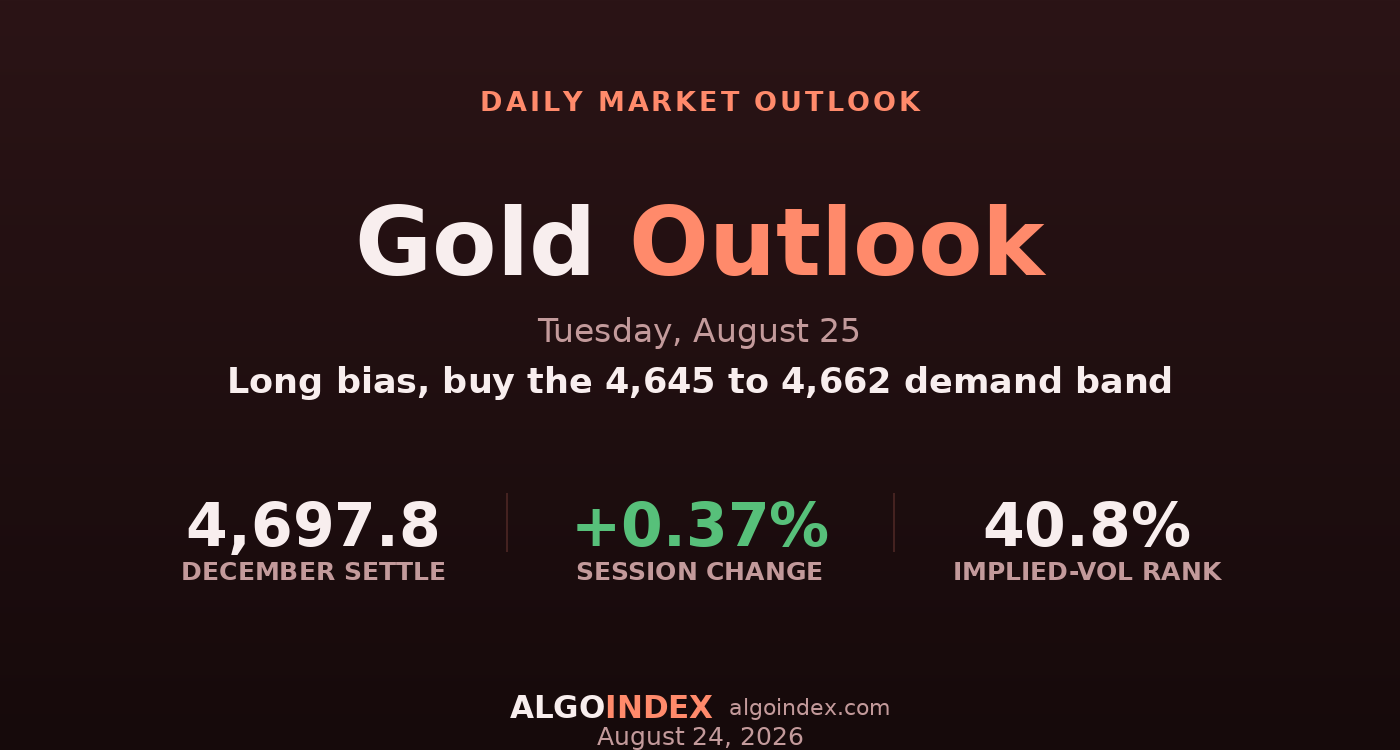
Gold pushed to a fresh three-month high on Monday and then handed part of it back, which tells the story of the day in one line. The December contract settled at 4,697.8, up 17.2 points, or about 0.37 percent, after tagging 4,738.5 intraday and fading into the bell. That upper wick matters more than the modest green close: buyers were strong enough to print a new high, but not strong enough to hold it. It wasn't a breakdown, though. Once the settle was struck, electronic trade drifted back up toward 4,710, so the dip found buyers rather than sellers.
The move came out of a two-sided macro setup that, on balance, favored the metal. Escalating geopolitical risk did the heavy lifting, with the US Treasury unveiling a campaign to sever Iran from the global economy and defense officials refusing to rule out force around the Strait of Hormuz. Underneath that sat a run of soft US data, a negative payrolls print, a retail-sales contraction, and a slide in crude that trimmed inflation expectations, all of which keep policy leaning easier. The one push-back was a firmer dollar near 98.99, which caught its own haven bid. Gold rose anyway, and that's the tell: the haven and easier-policy pulls outweighed the currency drag.
Bullish, and pressing overhead supply
The trend read is about as strong as it gets. Price holds above every major average, the five, twenty, fifty, hundred and two-hundred-day, plus the year-to-date mean, and the directional-movement gauge on the nine-day setting sits near 44.2 with the positive line at 35.1 dwarfing the negative at 7.8. The multi-indicator composite reads a strong buy near 72 percent. None of that's ambiguous. The catch sits directly overhead: the 4,725 pivot and the 4,738.5 high form a lid the market couldn't clear on Monday, and the year-to-date mean at 4,689.3 is now the nearest line under price.
Here's the tension that frames Tuesday. The fundamental side argues for more, with soft jobs and retail data, a crude-led nudge lower in inflation, a dollar that keeps its haven role but not a hawkish rate turn, and a live geopolitical premium. The technical side argues the easy money is already made, with a fresh three-month high, a rejection wick, and strength readings above 80 on the nine-day and 74 on the fourteen. Both can't hold. The resolution runs through 4,738 on top and the 4,645 pivot underneath, and that's the whole map for the session.
Buy the dip, don't chase the high
The plan won't chase strength into 4,738. It waits for a pullback into the 4,662 to 4,645 pocket, where the 50 percent retracement of the year's range and the central pivot line up together. Dealers sit short gamma. That amplifies intraday moves rather than pinning them, and no tight magnet strike sits nearby to trap price. Implied-vol rank near 40.8 percent leaves room for movement to widen, while skew rank up at 75.5 says the wings are already paying up for protection. The wrinkle is that Tuesday is light on data, so momentum, positioning and any Gulf headline carry the session until Wednesday's inflation print takes over.
Buy the pocket, or the clean break above 4,738
The primary plan buys a pullback into the 4,662 to 4,645 band, the 50 percent retracement and central-pivot confluence the uptrend has to defend. The stop is structural below the 4,600 first pivot support, since a sustained close there flips the read from pause to reversal and opens the 4,565 shelf beneath it. Targets run to the 4,725 pivot, then the 4,738.5 high and breakout reference, then the 4,751 computed target on a clean push. There's a second way in for a market that never offers the dip: a decisive reclaim and hold above 4,738.5 aims at 4,751 and, on follow-through, the 4,770 pivot, with a protective exit back under 4,725. A sharp dollar rally, a hawkish real-rate turn, or a de-escalation headline that drains the geopolitical premium is a stand-aside signal whatever the chart shows, and size stays trimmed with Wednesday's inflation gauge one session out. performance methodology lays out how we grade both paths.
The fundamentals say higher and the chart says stretched, and they meet at the 4,725 to 4,738 band. When a three-month high fades but the evening market bids it right back toward 4,710, the pullback is the trade, not the chase.
A maturing uptrend pressing a stacked resistance band is a buy on weakness, not a chase at the high. The dip into 4,662 to 4,645 pays better than the print, and 4,600 is the line that says the pause turned into something worse.
This is the read our members get every session, before the bell, with the levels drawn and the setup defined. See how the same dealer-positioning work turns into systematic signals.
View pricingThe complete data picture
Every number behind Tuesday’s plan, charted first; the full numeric reference follows underneath.
Full numeric reference, every remaining figure from the review
| Average | Value | Settle vs |
|---|---|---|
| 5-day | 4,585.0 | above by 112.8 |
| 20-day | 4,364.8 | above by 333.0 |
| 50-day | 4,254.0 | above by 443.8 |
| 100-day | 4,483.5 | above by 214.3 |
| 200-day | 4,632.1 | above by 65.7 |
| Year-to-date | 4,689.3 | above by 8.5, the nearest line |
| Level | Reference |
|---|---|
| 4,920 to 4,927 | 61.8% retracement from the 52-week low and stretched strength projection, measured extension |
| 4,850.4 | third pivot resistance |
| 4,795.5 | one-standard-deviation resistance |
| 4,770.4 | second pivot resistance, stretch target |
| 4,751.7 | computed target, target 3 |
| 4,738.5 | 13-week and one-month high, breakout reference, target 2 |
| 4,725.5 | first pivot resistance, target 1 |
| 4,697.8 | December settle |
| 4,689.3 | year-to-date mean |
| 4,680.6 | prior close |
| 4,662.5 | 50% retracement of the 52-week range, top of the entry |
| 4,651.8 | session low |
| 4,645.5 | central pivot, the key near-term line and entry base |
| 4,632.1 | 200-day average, nearest structural support |
| 4,600.6 | first pivot support, stop shelf |
| 4,565.7 | one-standard-deviation support |
| 4,520.6 | second pivot support |
| 4,475.7 | third pivot support, deeper backstop |
| Metric | Reading |
|---|---|
| Gold-ETF proxy last | about 426.66, up 0.79 percent |
| Implied-vol rank | about 40.8 percent, moderate |
| One-day options-implied move | roughly 75 gold points, options proxy |
| Skew rank | 75.5 percent, high, protection rich at the wings |
| Call-side dealer gamma | about negative 308.6 million, dominant |
| Put-side dealer gamma | about positive 55.0 million, smaller |
| Net positioning | net-negative dealer gamma, trends amplified and pinning reduced |
| Reference band | lower near 4,525 gold, upper near 5,021 gold, low confidence |
| Cohort | Weekly change |
|---|---|
| Managed money | net long, 154,595 long vs 12,947 short, added 5,961 longs (data Aug 18) |
| Non-commercials | longs rose to 256,902, up 5,966, building into strength |
| Input | |
|---|---|
| Dollar index | firmed toward 98.99, up 0.15%, a competing safe-haven bid |
| 10-year yield | eased to about 4.70%, down 0.76%, buyback support at the long end |
| Volatility index | 15.84, up 4.62% as equities softened on a chip-sector selloff |
| Silver | 68.60, down 1.35%, diverging lower from gold |
| Gold-tracking ETF | 426.66, up 0.79% |
| Payrolls (prior) | minus 23,000, a soft-labor input |
| Retail sales (prior) | minus 0.6%, a soft-consumer signal |
| Geopolitics | Iran isolation campaign, Strait of Hormuz risk, a Red Sea tanker strike |
| When | Event |
|---|---|
| Tue Aug 25 | consumer confidence 10:00, prior 90.8, the only scheduled US release, data-light |
| Wed Aug 26 | core inflation gauge and second-estimate GDP 08:30, the week's first-order catalyst |
| Fri Aug 28 | final consumer-sentiment and inflation-expectations survey 10:00 |
The economic releases referenced above are published on the official government calendars below. Price levels are derived from standard technical and statistical methods, and the market read is AlgoIndex's own analysis. How we grade these calls is set out in our performance methodology.
- US Census Bureau, New Residential Construction (housing starts and building permits)
- US Bureau of Labor Statistics, Import and Export Price Indexes
- Federal Reserve, Industrial Production and Capacity Utilization (G.17)
- Federal Reserve, FOMC calendar and meeting minutes
- US Department of the Treasury, auction schedule and results
- AlgoIndex performance methodology



