
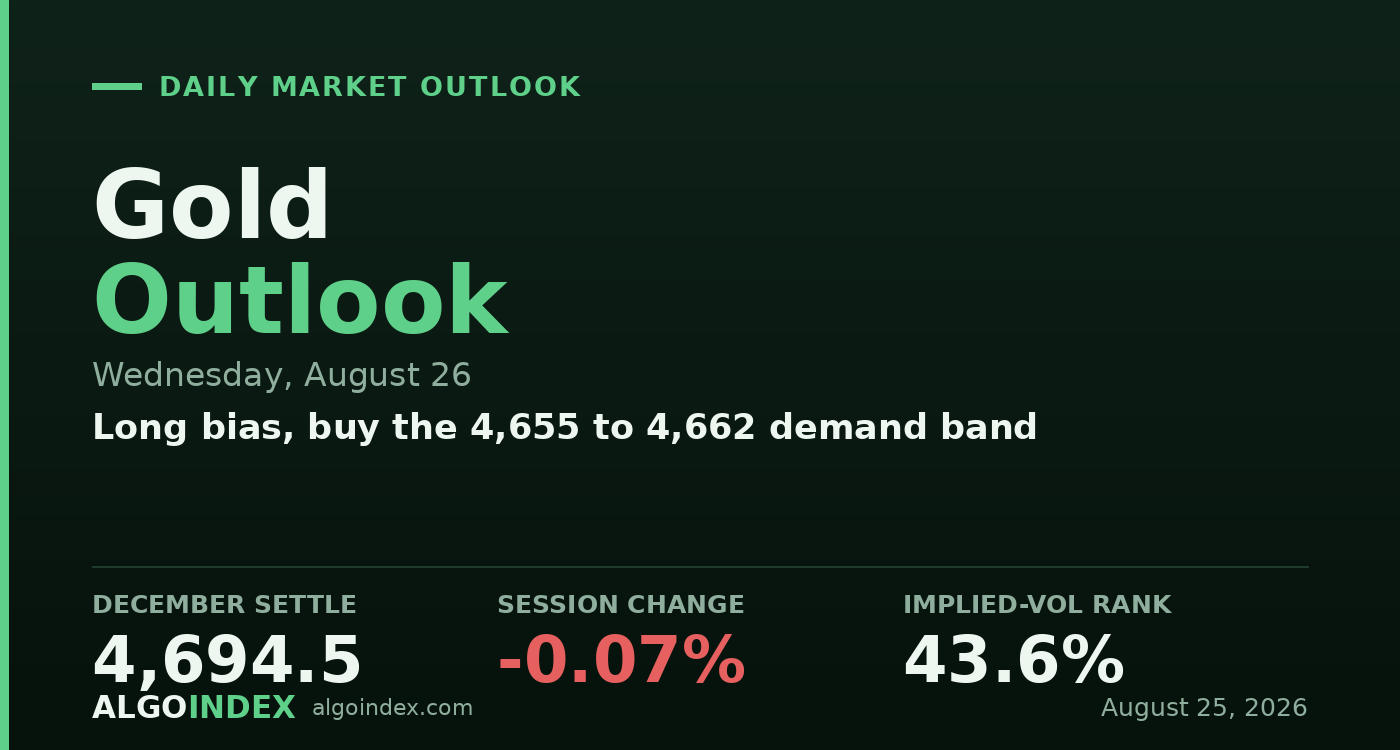
Gold pushed to a fresh three-month high on Tuesday, then gave most of it back before the bell. The December contract settled at 4,694.5, down 3.3 points, or about 0.07 percent, after tagging 4,755.0 intraday and reversing the whole advance. That's an upthrust and reject, not a trend day: buyers printed a new high and sellers took it straight back. It wasn't a breakdown, though. Once the pit closed, electronic trade firmed back toward 4,715.9 as of 05:45 PM ET, roughly 21 points above the official settle, so the late verdict read friendlier than the number on the screen.
The backdrop into Wednesday leans the metal's way, even if the chart looks tired. A soft dollar near 98.895 as of 05:45 PM ET and a 10-year yield about 6 basis points lower into 4.64 percent both trim the cost of holding a metal that pays nothing. Crude fell more than 3 percent, which dragged inflation breakevens and yields down with it. Underneath sits a run of weak US data, a negative payrolls print and a 0.6 percent drop in retail sales, plus a live geopolitical premium around the Strait of Hormuz. None of that resolves the day, because Wednesday hands the market its single biggest print of the week, the July core inflation gauge at 8:30 AM ET, and traders won't commit hard until it lands.
Strong trend, stretched oscillators
The trend read is about as firm as it gets. Price holds above every major average, the 5, 20, 50, 100 and 200-day, plus the year-to-date mean, and the directional-movement gauge on the 14-day setting reads 33.7 with the positive line at 30.3 running roughly three times the negative at 9.7. The multi-indicator composite prints a strong buy near 72 percent. None of that's ambiguous. The catch sits directly overhead: the 4,740 pivot and the 4,755 high form a lid the market couldn't clear on Tuesday, and the year-to-date mean at 4,689.5 is now the closest line under price, only about 5 points down.
Here's the tension that frames Wednesday. The fundamental side argues for more, with soft jobs and retail data, a crude-led nudge lower in inflation, a dollar that keeps its haven role without a hawkish rate turn, and a two-sided geopolitical premium. The technical side says the easy money is already made, with a fresh three-month high, a rejection wick, and strength readings above 81 on the 9-day and near 75 on the 14. Both can't stay right. The resolution runs through 4,755 on top and the 4,653 to 4,662 base underneath, and the 8:30 AM ET inflation print is the referee.
Buy the dip, don't chase the high
The plan won't chase strength into 4,755. It waits for a pullback into the 4,655 to 4,662 base, where the 50 percent retracement of the 52-week range, the first pivot support and the year's mean stack together. Dealers sit net short call gamma, so a push through the highs gets amplified rather than pinned, which adds upside convexity to any clean break. Implied-vol rank near 43.6 percent sits mid-range and leaves room for movement to widen, while skew rank up at 69.7 says the wings are already paid up for protection. The wrinkle is that Wednesday isn't quiet at all: the 8:30 AM ET core inflation gauge sets the tone before the cash open, a cool read reinforces the soft-dollar, firm-gold path, and a hot one hands the dollar a bounce from an overbought start.
Buy the base, or the clean break above 4,755
The primary plan buys a pullback into the 4,655 to 4,662 base, the dense 50 percent retracement and first-pivot-support confluence the uptrend has to defend. The stop is 4,640, below the 4,653 first pivot support and the 5-day average at 4,642.9 but a touch above the 200-day at 4,634.8, so it's an in-shelf stop that flips the read from pause to unwind if it breaks. Targets run to the 4,740 pivot, then the 4,755 high and breakout reference, then the 4,782 second pivot resistance on a clean push through the high on volume. There's a second way in for a market that never offers the dip: a decisive reclaim and hold above 4,755 aims at 4,762 and, on follow-through, the 4,776 to 4,782 band, with a protective exit back under 4,740. A hot inflation print at 8:30 AM ET that lifts the dollar and real yields, or a firm dollar breakout on its own, is a stand-aside signal whatever the chart shows, and size stays trimmed with the gauge one print away. Our performance methodology lays out how we grade both paths.
The fundamentals say higher and the chart says stretched, and they meet at the 4,740 to 4,755 band. When a three-month high fades but the evening market bids it right back toward 4,715, the pullback is the trade, not the chase.
A maturing uptrend pressing a stacked resistance band is a buy on weakness, not a chase at the high. The dip into 4,655 to 4,662 pays better than the print, and 4,653 is the line that says the pause turned into something worse.
This is the read our members get every session, before the bell, with the levels drawn and the setup defined. See how the same dealer-positioning work turns into systematic signals.
View pricingThe complete data picture
Every number behind Wednesday’s plan, charted first; the full numeric reference follows underneath.
Full numeric reference, every remaining figure from the review
| Average | Value | Settle vs |
|---|---|---|
| 5-day | 4,642.9 | above by 51.6 |
| 20-day | 4,395.4 | above by 299.1 |
| 50-day | 4,262.2 | above by 432.3 |
| 100-day | 4,481.4 | above by 213.1 |
| 200-day | 4,634.8 | above by 59.7 |
| Year-to-date | 4,689.5 | above by 5.0, the nearest line |
| Level | Reference |
|---|---|
| 4,926.7 | 61.8% retracement from the 52-week low, a blow-off reference |
| 4,904.2 | level where the 14-day strength reading reaches 80 |
| 4,827.0 | third pivot resistance |
| 4,809.5 | two-standard-deviation resistance |
| 4,782.7 | second pivot resistance, target 3 |
| 4,776.8 | one-standard-deviation resistance |
| 4,762.5 | computed target price |
| 4,755.0 | session high, one-month and 13-week high, target 2 |
| 4,740.3 | first pivot resistance, target 1 |
| 4,697.8 | prior close |
| 4,696.0 | daily pivot, pinned to the settle |
| 4,694.5 | December settle |
| 4,689.5 | year-to-date mean, the nearest line |
| 4,662.5 | 50% retracement of the 52-week range, top of the entry |
| 4,662.0 | level where the 14-day strength reading reaches 70 |
| 4,659.5 | session low |
| 4,655 to 4,662 | primary demand band, the entry |
| 4,653.6 | first pivot support, base of the confluence |
| 4,642.9 | 5-day average, thickens the first support band |
| 4,634.8 | 200-day average, nearest structural support |
| 4,618.8 | one-standard-deviation support |
| 4,609.3 | second pivot support |
| 4,586.1 | two-standard-deviation support |
| 4,566.9 | third pivot support, deeper backstop |
| Metric | Reading |
|---|---|
| Gold-ETF proxy last | about 427.3, up 0.13 percent |
| Implied-vol rank | about 43.6 percent, mid-range |
| One-day options-implied move | roughly 78 gold points, options proxy |
| Skew rank | 69.7 percent, raised, protection rich at the wings |
| Call-side dealer gamma | about negative 270.43 million, dominant |
| Put-side dealer gamma | about positive 62.48 million, smaller |
| Net positioning | net short-call gamma, added upside convexity into a breakout |
| Put-to-call open interest | 0.43, a call-heavy skew |
| Top gamma expiry | August 27, rolls off within two sessions |
| Reference band | lower near 4,570 gold, upper near 4,955 gold, low confidence |
| Input | |
|---|---|
| Dollar index | 98.895 as of 05:45 PM ET, down 0.09 percent, a soft tone that supports the metal |
| 10-year yield | near 4.64 percent, down about 6 basis points, lowering the real-yield headwind |
| Volatility index | 15.46, eased as equities firmed |
| Crude oil | down 3.12 percent to 82.36, a drag on inflation breakevens and yields |
| Silver | held firm alongside gold |
| Payrolls (prior) | minus 23,000, a soft-labor input |
| Retail sales (prior) | minus 0.6 percent, a soft-consumer signal |
| Geopolitics | Strait of Hormuz tension against competing de-escalation chatter, a two-sided premium |
| When | Event |
|---|---|
| Wed Aug 26 | core inflation gauge and second-estimate GDP 8:30 AM ET, crude inventory 10:30 AM ET, chip-sector earnings 4:20 PM ET, the week's real catalyst |
| Thu Aug 27 | weekly jobless claims 8:30 AM ET, central-bank symposium opens |
| Fri Aug 28 | senior Federal Reserve keynote in the morning, final consumer-sentiment and inflation-expectations survey 10:00 AM ET |
The economic releases referenced above are published on the official government calendars below. Price levels are derived from standard technical and statistical methods, and the market read is AlgoIndex's own analysis. How we grade these calls is set out in our performance methodology.
- US Bureau of Economic Analysis, Personal Income and Outlays (PCE)
- US Bureau of Economic Analysis, Gross Domestic Product
- US Bureau of Economic Analysis, release schedule
- US Census Bureau, Advance Durable Goods (M3) release schedule
- US Energy Information Administration, Weekly Petroleum Status Report
- US Department of the Treasury, auction schedule and results
- AlgoIndex performance methodology



