
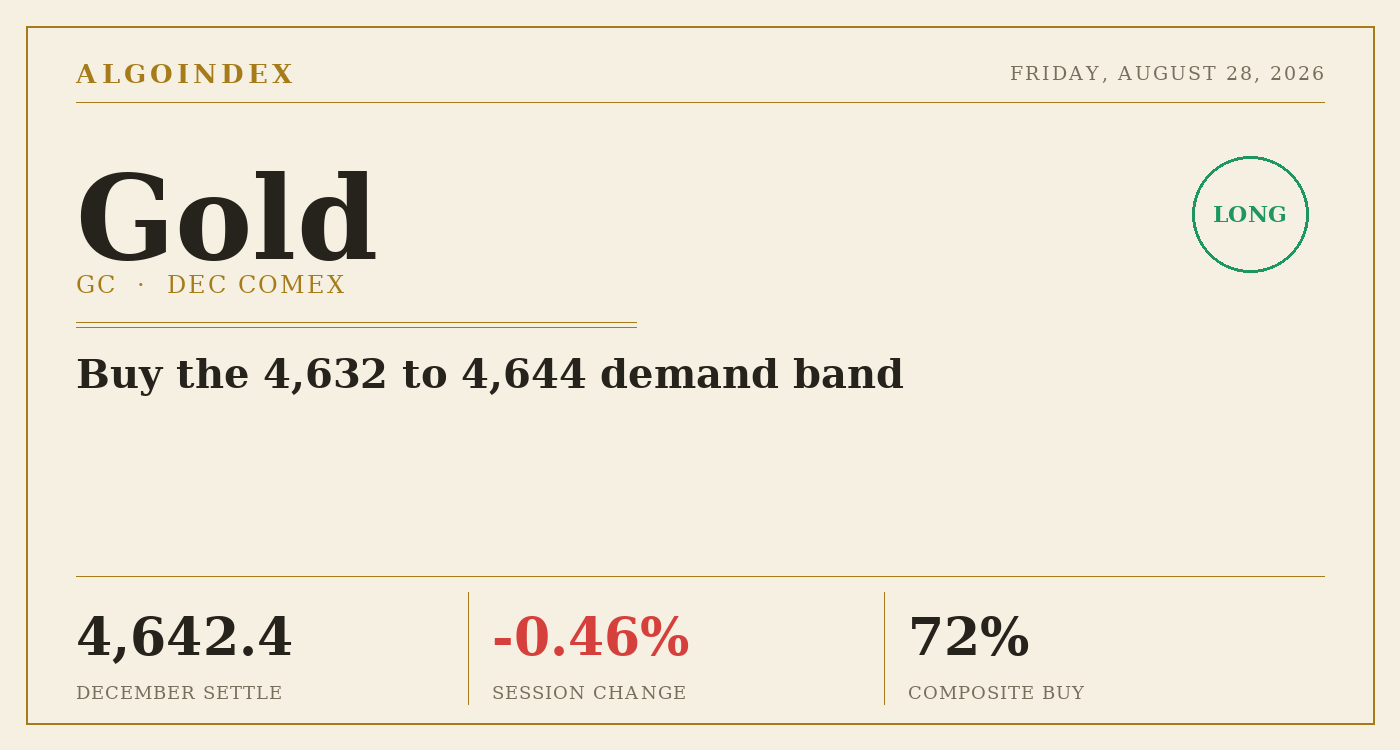
Gold spent Thursday compressed and closed on its lows. The December front-month settled at 4,642.4, down 21.6 points or about 0.46 percent, after opening near 4,656, probing a session high of 4,664.8, and then bleeding steadily lower to finish less than two points above the 4,640.7 session low. The shape matters more than the size. A close on the lows after a quiet session lets sellers take the last word without any decisive trend move, and the total range covered only about 21 points, under a quarter of the metal's recent 95-point average daily travel. That compression is the defining tell of the day, the fingerprint of participants pulling risk ahead of Friday's Federal Reserve Chair address at the Jackson Hole symposium rather than any genuine shift in conviction.
The weight came from an absence of catalyst layered over a mild headwind stack. The dollar index held firm near 99.12, close to a one-week high, the ten-year yield ticked up toward 4.67 percent, and equities pushed higher on constructive earnings sentiment, a combination that quietly caps a metal that pays no yield. The structural tension into Friday is the split between a strong intermediate trend and a weak short-term posture. Price still holds above its 20-day, 50-day, 100-day and 200-day averages, the directional trend-strength reading remains firmly in uptrend territory, and the multi-indicator composite still reads 72 percent buy, yet the three-day pullback from the 4,755 swing high has carried price back to the 200-day average near 4,641 and printed lower highs into the close. Gold sits compressed at intermediate support, inside a powerful uptrend, waiting on a first-order catalyst.
Intact uptrend, compressed at the 200-day
The larger trend is up and it is not marginal. Against the 4,642.4 settle the reference averages read 4,671.5 on the 5-day, 4,474.1 on the 20-day, 4,275.4 on the 50-day, 4,477.2 on the 100-day and 4,641.2 on the 200-day, so price holds above every major average and sits below only the fast 5-day and the 4,688.7 year-to-date mean. The 14-day directional trend-strength reading near 35, with the positive directional index near 26 well above the negative near 11, marks a genuine one-sided advance, and the composite still reads 72 percent buy with its shortest-term component at a full 100 percent. The catch sits directly beneath price. The 200-day at 4,641.2 has caught up to the market after the August run and now sits within a point or two of the close, so a break of the 4,640.7 session low puts that long-term reference immediately in play.
Here is the tension that frames Friday. Momentum has cooled without breaking, with the 14-day relative-strength reading near 72.5 percent, still above the 70 threshold but eased from a more stretched posture, consistent with a pause rather than a reversal. Against the intact trend, the short-term structure has rolled over, the day closed on its lows inside a 21-point range, and the dealer-positioning read on the gold-ETF proxy sits net short and move-amplifying into the event. Both readings cannot stay right through Friday. The resolution runs through the 4,676 to 4,702 resistance band overhead and the 4,632 to 4,644 support shelf underneath, and the 10:00 AM ET Jackson Hole address is the referee.
The 4,616 base is the line that matters
Two zones frame the session. Below, immediate support is the 4,640 to 4,644 shelf where the market closed, reinforced by the 200-day average at 4,641.2 and the one-standard-deviation band near 4,640.8, with the 4,633.8 first computed pivot support just beneath and the 4,616 base as the key decision level, the line whose failure hands short-term control to sellers and exposes the 4,609.7 third pivot support. Above, the first reclaim is the 4,649.3 pivot, then the 4,657.9 first computed resistance, then the 4,676 shelf where the relative-strength-70 reference and the moving-average ribbon converge, with the 4,702 prior-week high and the 4,687 to 4,697 one-standard-deviation band forming the more meaningful ceiling. Dealers on the gold-ETF proxy carry net-short gamma, so moves around the 4,616 base and the 4,676 shelf are likely to run larger than a neutral-positioning session would produce once the address lands.
Buy the shelf, respect 4,616, size it down
The plan buys a reaction off the 4,632 to 4,644 support shelf and the 4,641 200-day average, leaning on the intact intermediate trend and the structural dollar-debasement theme while price holds above the 4,616 base. The stop is 4,614, below that base, about 24 points from the 4,638 mid-zone entry. Targets run to the 4,676 relative-strength shelf, then the 4,702 prior-week high, then the 4,740 approach to the 4,755 swing high only if momentum extends through the second target on rising volume, for reward-to-risk near 1 to 1.5, 1 to 2.7 and 1 to 4.2. Two live outs cut against it. A hawkish address that firms the dollar decisively above its one-week high and lifts real yields invalidates the long in real time and activates the alternate short toward 4,609.7 and lower, while a decisive break and hold below 4,616 does the same regardless of the address. Size stays trimmed into the 10:00 AM ET event and the weekend gap risk that follows the Sunday-evening reopen. Our published record lays out how we grade these calls.
The intermediate uptrend is intact and the composite still leans firmly positive, but Thursday closed on its lows inside a compressed range, price sits at the 200-day average, and dealers on the gold-ETF proxy carry net-short gamma into a first-order catalyst. Above the 4,616 base the tilt favors a long off the 4,632 to 4,644 shelf. Buying the shelf that holds, small, is the trade.
A quiet close on the lows at the 200-day average, inside a powerful uptrend and one session ahead of the Jackson Hole address, is a compressed spring rather than a broken trend. The edge is the 4,632 to 4,644 shelf, and a decisive break of 4,616 is the line that flips the read from long to short.
This is the read our members get every session, before the bell, with the levels drawn and the setup defined. See how the same dealer-positioning work turns into systematic signals.
View pricingThe complete data picture
Every number behind Friday’s plan, charted first; the full numeric reference follows underneath.
Full numeric reference, every remaining figure from the review
| Average | Value | Settle vs |
|---|---|---|
| 5-day | 4,671.5 | below by 29.1, just overhead |
| 20-day | 4,474.1 | above by 168.3 |
| 50-day | 4,275.4 | above by 367.0 |
| 100-day | 4,477.2 | above by 165.2 |
| 200-day | 4,641.2 | above by 1.2, the nearest structural line |
| Year-to-date mean | 4,688.7 | below by 46.3 |
| Level | Reference |
|---|---|
| 5,781.8 | 52-week high, a distant reference from the first quarter |
| 4,953.4 | 61.8 percent Fibonacci extension of the recovery leg |
| 4,755.0 | August 25 swing high, one-month and 13-week ceiling |
| 4,740.0 | approach to the swing high, target 3 |
| 4,702.0 | prior-week high, target 2 |
| 4,697.5 | 50 percent Fibonacci reference and one-standard-deviation band top |
| 4,688.7 | year-to-date mean, just overhead |
| 4,682.0 | third computed pivot resistance |
| 4,676.0 | relative-strength-70 shelf, target 1 |
| 4,673.4 | second computed pivot resistance |
| 4,671.5 | 5-day average, just overhead |
| 4,657.9 | first computed pivot resistance |
| 4,649.3 | pivot point, first reclaim to neutralize the weak close |
| 4,642.4 | December settle |
| 4,641.2 | 200-day average, nearest structural support |
| 4,640.8 | one-standard-deviation support band |
| 4,632 to 4,644 | support shelf, the long entry |
| 4,633.8 | first computed pivot support |
| 4,625.2 | second computed pivot support |
| 4,616.0 | the base, the key decision level and invalidation |
| 4,609.7 | third computed pivot support, alternate-short objective |
| 4,477.2 | 100-day average, a deeper support line |
| 4,474.1 | 20-day average |
| 4,441.0 | 38.2 percent Fibonacci reference, deeper structural support |
| 4,275.4 | 50-day average, well beneath price |
| 4,054.0 | August base and one-month low |
| 3,613.2 | 52-week low, framing the yearly span |
| Metric | Reading |
|---|---|
| Gold-ETF proxy last | 421.88, up from a 421.33 prior close |
| Call-side dealer gamma | about negative 283 million, the dominant leg |
| Put-side dealer gamma | about positive 86 million, the smaller leg |
| Net positioning | net short gamma, dealers positioned to amplify directional moves rather than absorb them |
| One-day options-implied move | about 2.26 percent, mapping to roughly 105 gold points around the 4,642 settle |
| Implied-vol rank | about 38 percent, middle of the range with room to expand |
| Volatility-inflection references | a lower reference near 417 and an upper near 465 on the proxy, treated as low-confidence given known labeling quirks in that dataset |
| Input | |
|---|---|
| Dollar index | held firm near 99.12, marginally higher and close to a one-week high, the proximate weight on gold |
| 10-year yield | ticked up toward 4.67 percent, keeping the implied real yield modestly positive |
| Fed and policy | two regional officials called policy not restrictive, September-meeting cut pricing narrowed to a few basis points, core inflation at 3.7 percent above the 3.6 percent consensus |
| Crude oil | the international benchmark settled near 89.70, up about 2.12 percent, the US October contract near 83.53, up 1.58 percent, a firm inflation-input backdrop |
| Equities and volatility | the broad index up about 0.72 percent on constructive earnings, the volatility gauge down nearly 5 percent to 14.5, a risk-on backdrop draining haven demand |
| Silver and metals | silver and the broader complex tracked gold in a compressed, low-conviction band |
| Open interest | the most-active December contract near 330,116, a healthy and liquid participation level |
| Geopolitics | reported strikes near the Syrian capital, continued Strait of Hormuz sparring and Ukraine escalation risk, a latent haven bid the compression overwhelmed |
| Overnight expectation | a neutral-to-soft lean within a 4,628 to 4,662 Globex band absent a weekend geopolitical headline |
| When | Event |
|---|---|
| Fri Aug 28 | the Federal Reserve Chair address at the Jackson Hole symposium 10:00 AM ET, alongside the preliminary benchmark payrolls revision and the University of Michigan final inflation-expectations, with a regional Fed official at 9:00 AM ET and another at 12:30 PM ET, and Canadian GDP at 8:30 AM ET |
| Sun Aug 30 | the Globex reopen carries the Friday resolution and any weekend geopolitical development into a two-day-gap Sunday-evening session |
| Wed Sep 16 | the Federal Reserve rate decision, the larger forward catalyst for the rate narrative |
The economic releases referenced above are published on the official government calendars below. Price levels are derived from standard technical and statistical methods, and the market read is AlgoIndex's own analysis. How we grade these calls is set out in our performance methodology.
- US Bureau of Economic Analysis, Personal Income and Outlays (PCE)
- US Bureau of Economic Analysis, Gross Domestic Product
- US Bureau of Economic Analysis, release schedule
- US Census Bureau, Advance Durable Goods (M3) release schedule
- US Energy Information Administration, Weekly Petroleum Status Report
- US Department of the Treasury, auction schedule and results
- AlgoIndex performance methodology



