
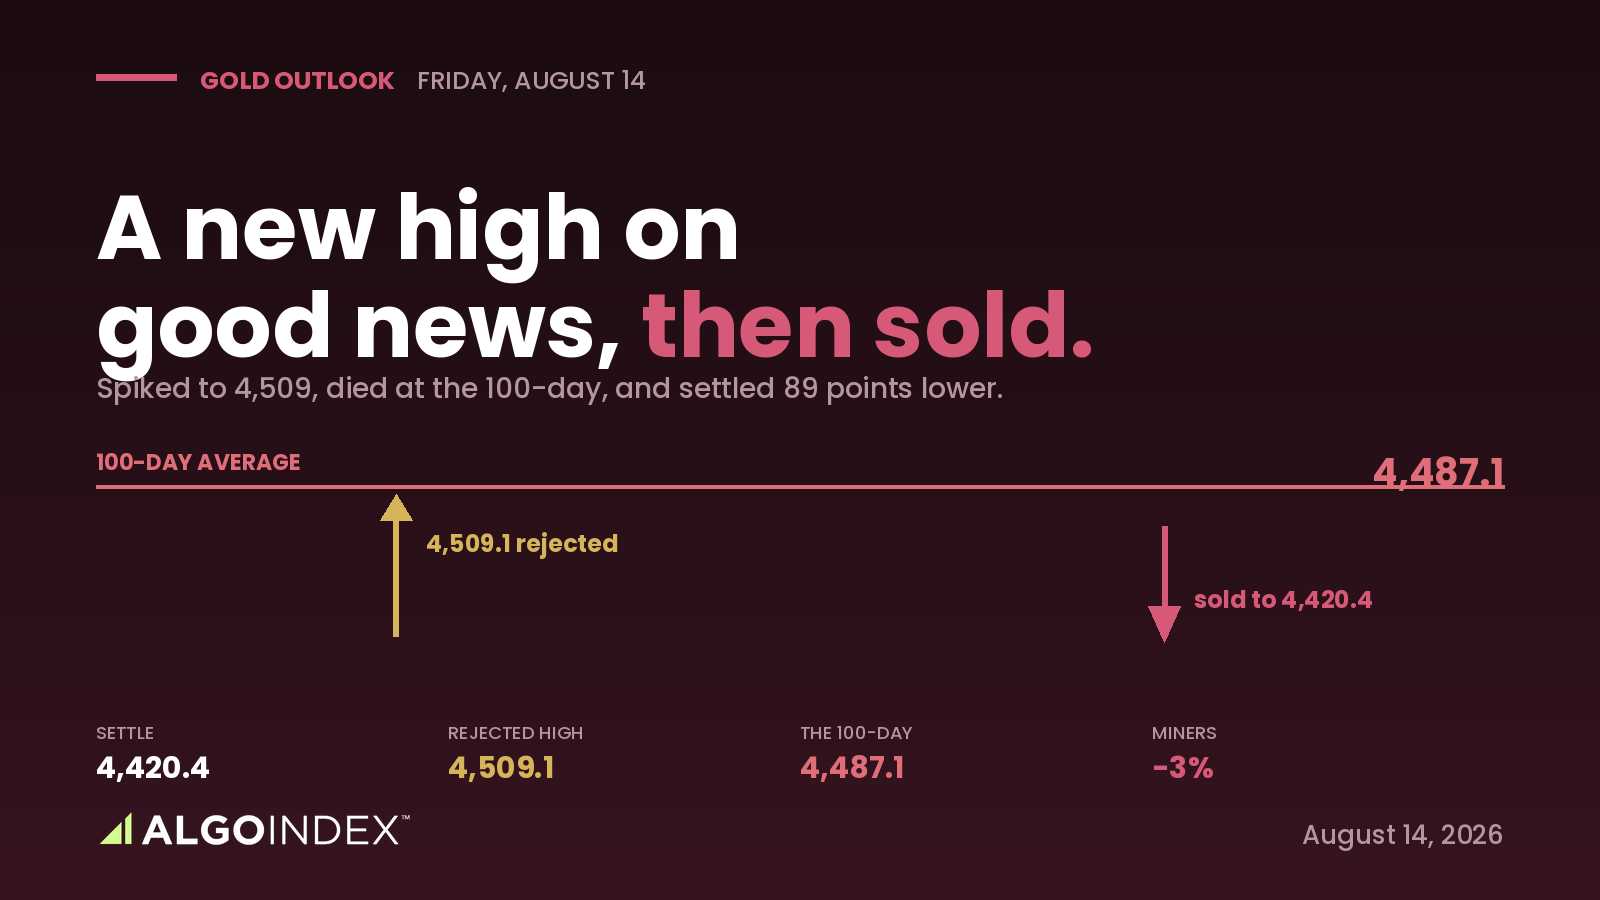
Gold spent Thursday doing the single most instructive thing a market can do: it printed a fresh high on genuinely good news, and then it spent the rest of the day giving the move back. The front contract spiked to 4,509.1 overnight, its best level in more than two months, then it reversed and settled 4,420.4, roughly eighty-nine points beneath that high and down more than a percent on the day. It's the second session running that the metal has poked to a higher high and been rejected beneath its 100-day average, and two rejections in a row read as distribution, not accumulation.
What makes it damning is the backdrop. Producer inflation was soft, consumer inflation was in line, the dollar is soft, real yields eased, and there are tanker attacks in the Strait of Hormuz, and gold still couldn't hold a high. When a market rejects its high into a backdrop that supportive, the buying was already spent. The metal is still slightly lower on the year and it's being priced by the rates channel, not the fear channel. The near-term risk isn't a trend reversal, the rising 20 and 50-day averages underneath keep the larger recovery intact, but a corrective pullback toward the 4,377 to 4,334 support before that recovery can resume.
The tell isn't the price, it's the miners
The clearest warning didn't come from the metal at all. The mining shares fell roughly three percent on a day the metal fell one, and miners leading the metal lower is a familiar distribution signal, because the equity expression of gold tends to turn before the metal itself does. Add a managed-money book that's crowded long, better than two-to-one call open interest in the fund proxy, and an option skew bid up near the 79th percentile as traders pay for downside protection into the highs, and you have the exact sentiment configuration that produces sharp two-way corrections rather than smooth continuation. It's a crowded long book buying insurance, which is what a top looks like from the inside.
None of that breaks the medium-term case. The 20 and 50-day averages are still rising underneath the price, and a central bank on hold with a soft data run is structurally supportive for the metal over time. But structure is a slow force and positioning is a fast one, and right now the fast force points down until the 100-day is reclaimed on a close.
A rates market, not a fear market
The safe-haven premium is leaking even as the headlines stay hot, and that's the single most important thing to understand about this market right now. Reports of a refinery strike and a tanker attack crossed on Thursday, and gold sold anyway, because running alongside the attacks is active diplomacy and a sense that a deal to reopen the strait may be close. A market that won't rally on tanker attacks has its fear bid already in the price, and the risk into any concrete de-escalation headline is a fast unwind of whatever premium is left. The macro tailwind hasn't broken, dovish data has trimmed the odds of a September rate increase, but the tailwind isn't enough while positioning is this crowded.
Fade the shelf, don't short the hole
The trade is a fade of strength into resistance that has already rejected twice, not a short into weakness. It sells the 4,458 to 4,486 band, right at the failed 100-day average, but only on an actual rejection, a failed push with declining volume or a reversal candle, and never beneath the 4,443 pivot. The stop sits at 4,498, above the one-month-high structure, and the targets run to the 4,420 settle, then the 4,377 pivot base, then 4,334. The invalidation is clean: two consecutive closes back above 4,487 on volume mean the 100-day is reclaimed, and then you're wrong, so you leave. A soft retail-sales print that lifts gold back above the pivot flips the read to the long side. How we grade these afterward is in our performance methodology.
A metal that will not rally on tanker attacks in the Strait of Hormuz has already spent its fear bid, and what is left is a rates market that keeps selling its own highs.
A new high that gets sold is worth more information than a new high that holds. Twice now gold has made one and given it back, and the metal that won't rally on war is telling you which way it wants to go.
This is the read our members get every session, before the bell, with the levels drawn and the setup defined. See how the same dealer-positioning work turns into systematic signals.
View pricingThe complete data picture
Every number behind Thursday’s plan, charted first; the full numeric reference follows underneath.
Full numeric reference , every remaining figure from the review
| Average | Value | Spot vs about 4,417 |
|---|---|---|
| 5-day | 4,432.8 | -15.8 (short-term turned down) |
| 20-day | 4,233.4 | +184 (rising) |
| 50-day | 4,228.4 | +189 (rising) |
| 100-day | 4,487.1 | -70 (the wall) |
| 200-day | 4,620.2 | -203 (overhead supply) |
| Level | Reference |
|---|---|
| 4,399-4,392 | one-SD support and 50% 13-week retrace |
| 4,377 | first pivot support (the base) |
| 4,363 | 9-day average cross |
| 4,334 | second pivot support (target 3) |
| 4,268 | third pivot support |
| 4,019 | the July base |
| Metric | Reading |
|---|---|
| Standing state | net SHORT gamma (amplifies) |
| Call / put gamma | -90M / +48M |
| Proxy close | 398.96, -1.47% |
| One-month implied / realized | about 23% / about 23% |
| IV rank / skew rank | 32% / 79% |
| Implied move | about $5.9 (1.5%) |
| Read | crowded long, paying up for downside hedges |
| Input | |
|---|---|
| Producer inflation | soft; headline y/y 4.7% from 5.5% |
| Sept hike odds | 35% from 40% |
| Dollar index | about 100.0, little changed |
| 10-year yield | fell about 5 basis points |
| Hormuz | tanker attacks reported; gold still sold |
| Read | max fear, min bid; rates set the price |
| When | Event |
|---|---|
| Fri 05:00 | Euro-area GDP flash |
| Fri 08:30 | US retail sales, core +0.2% |
| Fri 10:00 | Michigan inflation expectations (most gold-relevant) |
| Fri 10:00 | US business inventories |
| Late Aug | regional inflation data midweek |
| Aug 27-29 | central-bank symposium (the real event) |



