
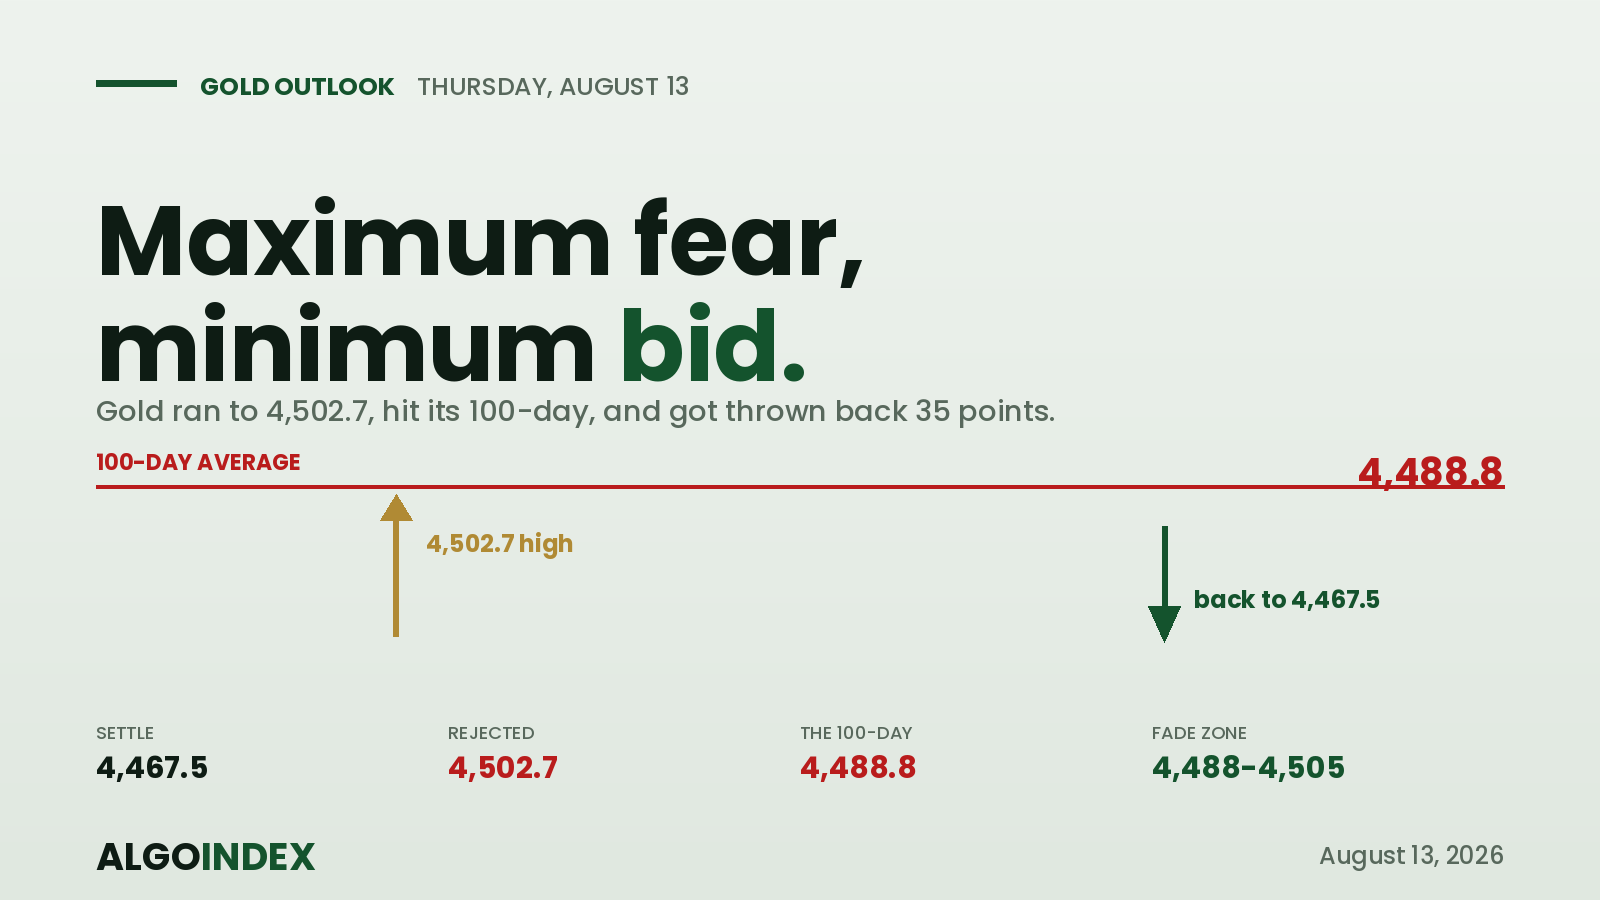
Yesterday we wrote that gold got turned away at its 100-day average. On Wednesday it tried again, and got turned away again. The metal spiked into 4,502.7 on the friendly inflation headline, tagged its 100-day at 4,488.8, and then spent the rest of the session selling. It settled at 4,467.5, some 35 points below its high, in the lower third of the day. A market that makes its high on the headline and closes near the low did not believe the headline.
The proof that this was distribution rather than digestion is in the proxy. The equity-listed gold fund kept trading for two and a half hours after the futures settled, and it closed down 0.46 percent on the day while the futures print showed a gain. That gap is the market re-pricing gold lower after the bell. Behind it sits the real story, and it's the most important thing to carry into Thursday: the geopolitical backdrop is as severe as it has been all year, with the Strait of Hormuz shut and no ceasefire-extension talks underway, and gold is still negative on the year. Maximum fear is producing minimum bid.
The fear channel is closed
When the world's most important oil chokepoint is physically blocked and a non-yielding safe haven cannot hold a one-month high, something specific is happening. The flight-to-quality bid is going into the dollar, which firmed even on dovish inflation data, and the central bank behind that dollar is openly debating a rate hike, not a cut. When the reserve currency absorbs the fear and rates are the policy question, gold is left holding the risk without the reward. That's why this is a rates market, not a fear market, and Thursday's calendar is almost entirely a rates calendar.
The rates edge is sharp. Wednesday's 10-year auction cleared at the highest yield since the 2007 financial crisis, investors demanding more to hold duration, and rising nominal yields against decelerating inflation means rising real yields. Real yields are the most reliable headwind this metal faces. Thursday layers a producer-price print with core forecast 1.6 points above consumer core, two Fed speakers around it, and a 30-year auction into a deteriorating fiscal backdrop.
Stretched, crowded, and hedged against
The technical case for a fade is complete. Gold sits 235 points above its 20-day average, stochastics are pinned above 89 across three windows, and the 14-day relative strength eased on the very day price made a one-month high, an early divergence. The multi-indicator composite reads 32 percent buy with a 67 percent sell on its long-term set. And the positioning is the amplifier: managed money is crowded long while commercial hedgers added shorts into the advance, and in the options proxy, momentum money is buying calls while a more sophisticated bid pays up for downside protection at the 78th percentile of skew. When speculative flow and skew disagree, skew has been the more reliable of the two.
Fade the shelf, not the weakness
The trade is a counter-trend fade at a defined level, and it requires the level to reject before it is a trade at all. The setup sells a retest of the 4,488 to 4,505 band, where six computed methods including the 100-day converge inside twelve points, on a visible failure, with a stop above 4,518 where the reclaim would be real, and targets at the 4,439 shelf, then the 4,425 decision zone, then 4,382. It does not short into weakness near 4,430, because the structure directly beneath is dense and dealer positioning is negative, which would amplify an upside break just as readily. Two headlines override it in either direction: a Hormuz reopening accelerates the downside, a ceasefire collapse spikes the metal through the band. How we score a fade like this once it plays out is in our performance methodology.
Maximum geopolitical stress is producing a metal that is still, on the year, slightly lower. The fear channel is closed and the rates channel is open.
A metal that will not rally on a blocked strait is telling you what it will do when the strait reopens.
This is the read our members get every session, before the bell, with the levels drawn and the setup defined. See how the same dealer-positioning work turns into systematic signals.
View pricingThe complete data picture
Every number behind Wednesday’s plan, charted first; the full numeric reference follows underneath.
Full numeric reference , every remaining figure from the review
| Average | Value | Price vs about 4,466 |
|---|---|---|
| 5-day | 4,437.4 | +28.6 |
| 20-day | 4,218.3 | +247.7 (extended) |
| 50-day | 4,231.5 | +234.5 |
| 100-day | 4,488.8 | -22.8 (the wall) |
| 200-day | 4,619.3 | -153.3 |
| YTD | 4,696.0 | -230.0 |
| Level | Reference |
|---|---|
| 4,417-4,428 | decision zone (2SD, pivot S1, 50% retrace) |
| 4,382.6 | second pivot support |
| 4,370.5 | 38.2% from 52-week low |
| 4,343.7 | third pivot support |
| 4,248.3 | 14-day RS at 50 |
| 4,015-4,019 | the base |
| Metric | Reading |
|---|---|
| Proxy close | 404.33, +0.84% |
| Call / put positioning | -396.3M / +76.87M (net negative) |
| Call vs put volume | 233.56k vs 123.79k (1.89:1) |
| One-month implied / realized | 23.63% / 23.51% |
| Implied-vol rank / skew rank | 34.03% / 77.78% |
| Implied move | about 66 futures pts |
| Read | momentum buying calls, sophisticated bid buying puts |
| Concentration expiry | Sept 17 |
| Cohort | Long / Short |
|---|---|
| Managed money / non-comm | crowded net long |
| Commercials | +10,554 shorts into strength |
| Swap dealers | 20,753 / 228,388 |
| Read | hedgers selling, speculators buying (late-innings) |
| Open interest | 307,620 |
| Weighted alpha | +16.95 (base effect) |
| Input | |
|---|---|
| Dollar index | 99.984, +0.17% on dovish CPI |
| 10-year auction | highest yield since 2007 |
| Sept hike odds | about 45% (market pricing a HIKE) |
| Hormuz | shut; adviser: stays shut |
| Ceasefire | no extension talks (underpriced) |
| Read | max fear, min bid; rates set the price |
| When | Event |
|---|---|
| Thu 08:15 | Fed dissenter speaks |
| Thu 08:30 | US PPI 4.9% y/y, core 4.1% (1.6% above CPI core) |
| Thu 13:00 | 30-year bond auction (after 2007-high 10-year) |
| Fri 08:30 | US retail sales |
| Fri 10:00 | Consumer sentiment + inflation expectations |
| Sep 16 | Next policy meeting |



