
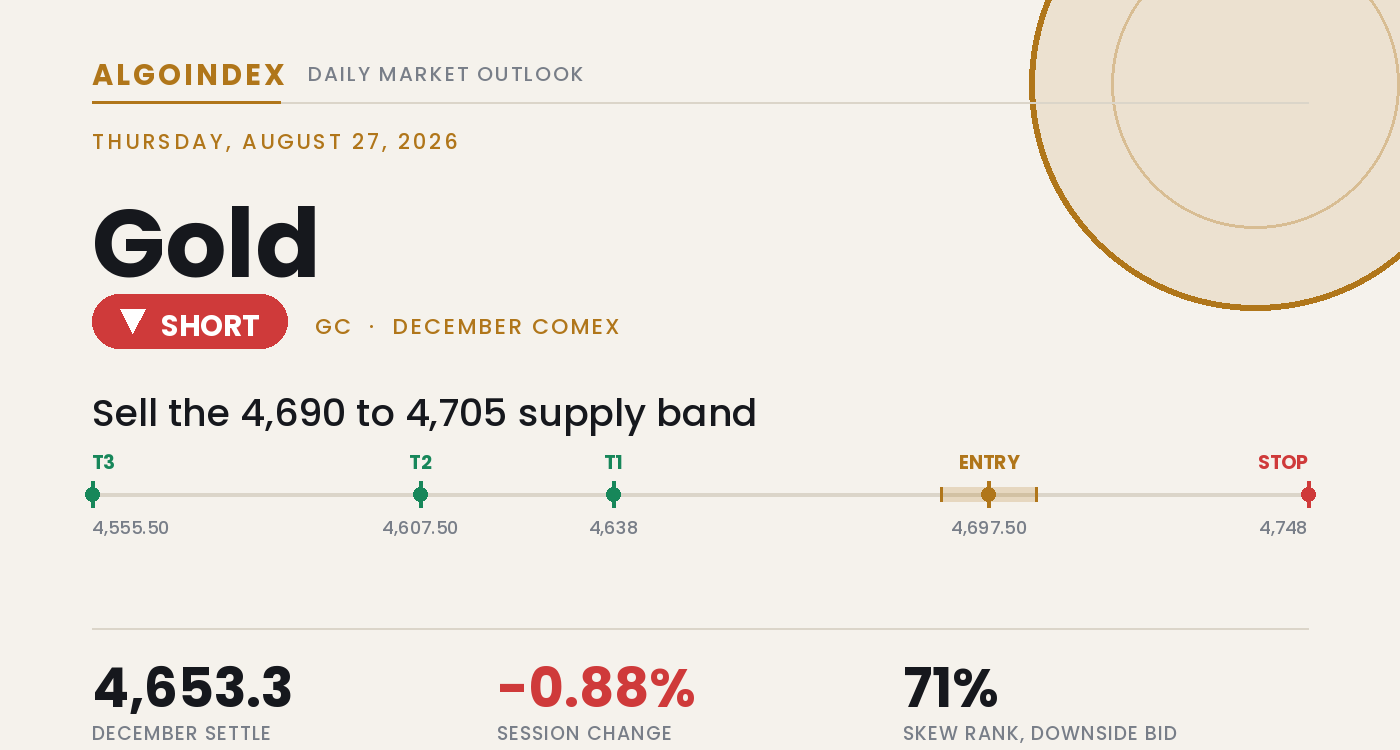
Gold reversed hard off one-month-high territory on Wednesday. The December contract settled at 4,653.3, down 41.2 points or about 0.88 percent, after tagging 4,730.9 intraday and failing to hold. The fade matters more than the settle alone suggests. Once the pit closed, the electronic print leaked toward 4,644.2, roughly nine points beneath the official settle and under the first computed support at 4,651.0, so the market's late verdict read weaker than the number the exchange struck. The rejection came one session after Tuesday's 4,755.0 print, which still stands as both the 13-week and one-month high, so Wednesday reads as a decisive fade from the highs rather than routine consolidation. Price closed in the lower third of a 92.7-point range, a weak-hands signature rather than an accumulation one.
The driver was a coordinated tightening impulse across rates and the dollar. A firmer-than-expected inflation and activity set landed in the morning, long-end Treasury yields extended a breakout, and the dollar index pushed to near 99.14, together lifting the opportunity cost of holding a metal that pays nothing. Bank commentary flagged 30-year yields at their highest since 2007, and market chatter shifted toward the tail possibility of a Federal Reserve rate increase later this year, an unusually hawkish tilt. The structural tension into Thursday is real. Price still holds above every major moving average and the metal is higher by roughly 12 percent on the month and near 30 percent on the year, yet the session broke its immediate support base on the electronic print and the macro impulse is fresh. The result is a two-sided setup with a downside tilt while price trades below the 4,703 pivot.
Intact uptrend, broken near-term support
The larger trend is still up, and it is not close. Price holds above the 5-day at 4,657.7, the 20-day at 4,421.5, the 50-day at 4,266.3, the 100-day at 4,479.7 and the 200-day at 4,637.1, and the multi-indicator composite still reads about 72 percent positive. The 14-day directional-movement gauge near 34.6, with positive pressure well above negative, marks a genuine one-sided advance. The catch sits directly beneath. The 200-day at 4,637.1 has caught up to price after the parabolic annual run and now sits only about 16 points under the settle, so a break of the 4,638 session low puts that long-term reference directly in play.
Here is the tension that frames Thursday. Momentum is elevated but cooling rather than extreme, with the 14-day relative-strength reading near 67.9, the faster 9-day near 70.3 and the slower 20-day near 63.7, easing back from overbought without reaching neutral. Against the intact trend, Wednesday broke the immediate support base on the electronic print, the dealer-positioning read on the gold-ETF proxy sits net short and move-amplifying, and higher yields with a firmer dollar are a fresh headwind. Both cannot stay right. The resolution runs through the 4,690 to 4,705 broken shelf on top and the 4,638 to 4,637 support step underneath, and Thursday's 8:30 AM ET jobless-claims print is the first referee.
The 4,703 pivot is the whole question
Two levels frame Thursday. Overhead, the broken shelf at 4,690 to 4,705 pairs the prior settle at 4,694.5 with the 4,703.0 daily pivot, a former support base now acting as recovered resistance and the first place rallies should struggle. Above it, the 4,746.5 first computed resistance and the 4,747.2 one-standard-deviation band bracket Tuesday's 4,755.0 high, making 4,746 to 4,755 the primary ceiling. Below, immediate support is the 4,638.2 session low, reinforced by the 200-day at 4,637.1 into a combined 4,637 to 4,638 step, while the 4,651.0 first computed support flipped to near-term pivot after the electronic break and is now the first overhead hurdle on any bounce. Dealers on the gold-ETF proxy carry net-short gamma, so swings around the 4,638 step and the 4,703 pivot are likely to run larger than a neutral-positioning session would produce.
Sell the rejection, respect 4,748, size it down
The plan sells a rally rejection back into the 4,690 to 4,705 shelf rather than chasing the low, leaning on the fresh rates-and-dollar impulse and the net-short dealer posture while price holds below the 4,703 pivot. The stop is 4,748, above the 4,746.5 first computed resistance and the 4,747.2 one-standard-deviation band, which together bracket Tuesday's 4,755.0 high, about 50 points from the 4,697.5 entry midpoint. Targets run to the 4,638 session low and 200-day step, then the 4,607.5 second computed support, then the 4,555.5 third computed support only if downside accelerates through the second target on rising volume. Two live outs cut against it. A sharp reversal lower in the dollar and long-end yields, a dovish surprise from Federal Reserve communication or a soft jobless-claims print at 8:30 AM ET, or a sudden geopolitical escalation out of Ukraine or the Middle East would revive the primary uptrend in real time and negate the short regardless of the level map. Size stays trimmed with the rate narrative unresolved into the September 16 Federal Reserve decision. Our published record lays out how we grade these calls.
The primary uptrend is intact and the composite still leans positive, but Wednesday broke the near-term support base on the electronic print, dealers on the gold-ETF proxy sit net short, and a fresh higher-yields, firmer-dollar impulse is doing the work. Below the 4,703 pivot the tilt is lower. Selling the rejection into the broken shelf, small, is the trade.
A decisive fade from a one-month high, with the electronic print already beneath first support and the 200-day average caught up at 4,637, is a rally to sell, not a dip to buy. The edge is the 4,690 to 4,705 shelf, and a reclaim of 4,703 is the line that neutralizes it.
This is the read our members get every session, before the bell, with the levels drawn and the setup defined. See how the same dealer-positioning work turns into systematic signals.
View pricingThe complete data picture
Every number behind Thursday’s plan, charted first; the full numeric reference follows underneath.
Full numeric reference, every remaining figure from the review
| Average | Value | Settle vs |
|---|---|---|
| 5-day | 4,657.7 | below by 4.4, just overhead |
| 20-day | 4,421.5 | above by 231.8 |
| 50-day | 4,266.3 | above by 387.0 |
| 100-day | 4,479.7 | above by 173.6 |
| 200-day | 4,637.1 | above by 16.2, the nearest structural line |
| Level | Reference |
|---|---|
| 5,781.8 | all-time high, a distant reference on a trend resumption |
| 4,940.3 | annual Fibonacci 61.8 percent marker |
| 4,842.0 | third computed resistance, the stretch target |
| 4,798.5 | second computed resistance, next extension shelf |
| 4,769.1 | two-standard-deviation resistance |
| 4,755.0 | Tuesday high, 13-week and one-month high, the immediate ceiling |
| 4,747.2 | one-standard-deviation band |
| 4,746.5 | first computed resistance, the stop shelf |
| 4,703.0 | daily pivot, top of the broken shelf |
| 4,694.5 | prior settle, recovered resistance and shelf base |
| 4,690 to 4,705 | broken support shelf, the short entry |
| 4,680.4 | 50 percent retracement of the 52-week range |
| 4,657.7 | 5-day average, just overhead |
| 4,653.3 | December settle |
| 4,651.0 | first computed support, flipped to near-term pivot after the electronic break |
| 4,638.2 | session low, target 1 with the 200-day just beneath |
| 4,637.1 | 200-day average, nearest structural support |
| 4,619.9 | two-standard-deviation support |
| 4,607.5 | second computed support, target 2 |
| 4,603.2 | three-standard-deviation support |
| 4,555.5 | third computed support, target 3 and the extended objective |
| 4,479.7 | 100-day average, a deeper washout line |
| 4,421.5 | 20-day average |
| 4,266.3 | 50-day average, well beneath price |
| Metric | Reading |
|---|---|
| Gold-ETF proxy last | 421.22, down 1.61 percent, mirroring the futures decline |
| Call-side dealer gamma | about negative 195 million, dominant |
| Put-side dealer gamma | about positive 62 million, smaller |
| Net positioning | net short gamma, dealers hedge with price and amplify moves in both directions |
| One-day options-implied move | about 6.93 dollars on the proxy, roughly 1.6 percent |
| Implied vs realized volatility | one-month implied near 25.7 percent against one-month realized near 24.0 percent |
| Implied-vol rank | about 41 percent, mid-range |
| Skew rank | about 71 percent, downside protection richly bid |
| Put-to-call open interest | about 0.45, call-heavy on a structural basis |
| Higher-volatility zone | below price near the 415 proxy level, instability concentrated to the downside |
| Input | |
|---|---|
| Dollar index | firmed about 0.24 percent to near 99.14, lifting the carry cost of a non-yielding metal |
| 10-year yield | up about 0.17 percent to roughly 4.66 percent, with 30-year yields at their highest since 2007 |
| Inflation and activity data | headline personal-consumption prices above forecast, durable goods well ahead, personal income higher |
| Crude oil | Brent settled 87.84, down 0.84 percent, WTI near 82.41, a soft-oil backdrop |
| Silver and copper | silver off about 1 percent, high-grade copper down near 1.7 percent, a metals-wide de-risk |
| Volatility index | eased toward 15.2 as equities held broadly steady |
| Chip-sector earnings | a beat after the close, revenue near 96.2 billion against about 92.4 billion expected, equity futures gapped higher |
| Overnight gold | December contract held modestly higher near 4,676 on the evening reopen |
| Geopolitics | Ukraine escalation reports and continued Middle East strikes, a latent haven bid overwhelmed by rates |
| When | Event |
|---|---|
| Thu Aug 27 | weekly initial jobless claims near 208,000 8:30 AM ET, regional Federal Reserve remarks 10:00 AM and 1:00 PM ET, 7-year Treasury auction 1:00 PM ET, symposium continues |
| Fri Aug 28 | consumer-sentiment release with its inflation-expectations components, further symposium commentary |
| Wed Sep 16 | Federal Reserve rate decision, the larger forward catalyst for the rate narrative |
The economic releases referenced above are published on the official government calendars below. Price levels are derived from standard technical and statistical methods, and the market read is AlgoIndex's own analysis. How we grade these calls is set out in our performance methodology.
- US Bureau of Economic Analysis, Personal Income and Outlays (PCE)
- US Bureau of Economic Analysis, Gross Domestic Product
- US Bureau of Economic Analysis, release schedule
- US Census Bureau, Advance Durable Goods (M3) release schedule
- US Energy Information Administration, Weekly Petroleum Status Report
- US Department of the Treasury, auction schedule and results
- AlgoIndex performance methodology



