
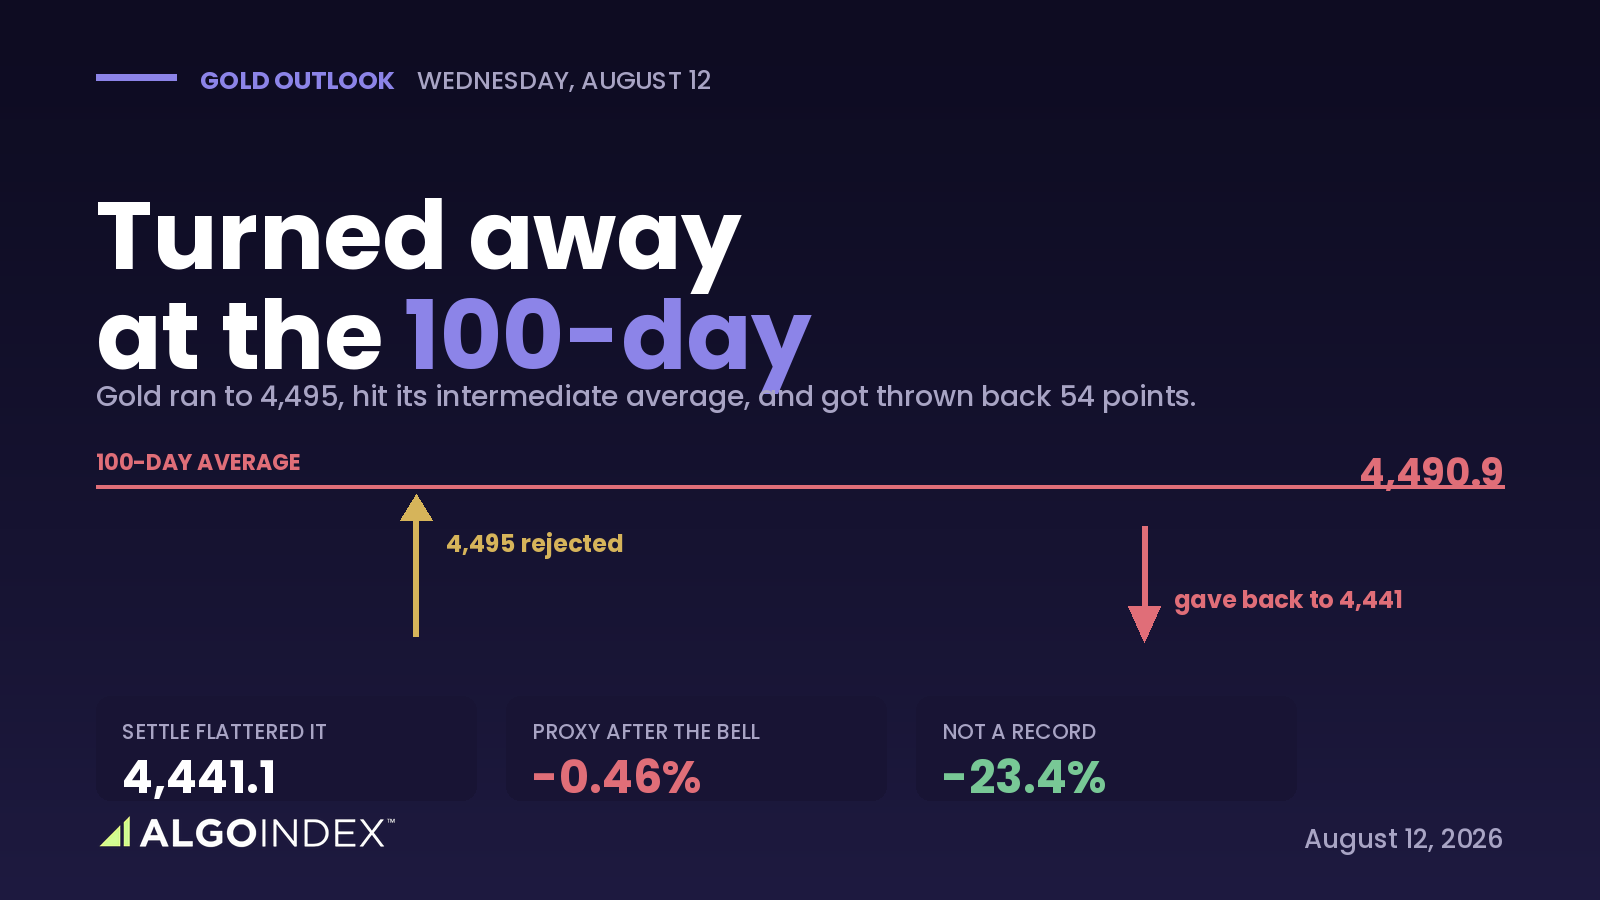
Monday we said 4,494 was the whole question for gold. On Tuesday the metal answered it. Buyers drove the December contract to 4,495.0, straight into the 100-day moving average at 4,490.9, and the market threw them back. Gold gave up 54 points from that high and settled at 4,441.1.
That settle is the most misleading number on the page. It shows a 0.48 percent gain, and it flattered a session that was fading by the close. The proof is in the proxy: the equity-listed gold fund kept trading for two and a half hours after the futures settled, and it fell 0.46 percent on the day while the futures print showed a gain. Nearly a full percentage point of daylight between two prices on the same metal isn't a tracking quirk. It is the market re-pricing gold lower after the bell, and it is the cleanest read available heading into Wednesday. The 100-day average has gone from an untested question to confirmed resistance, and that is the most consequential technical change of the day.
A counter-trend rally, not a bull market
The average stack states the environment plainly. Gold trades above its 5, 20 and 50-day averages and below its 100, 200 and year-to-date, which is the signature of a recovery inside a larger decline rather than a new leg up. It sits 23 percent below its January high and is fractionally negative on the year. This isn't record territory, whatever the headlines suggest, and the rejection did not happen at a random level. It happened at the exact average that defines the intermediate trend.
Momentum was already rolling as price made its high. The 9-day relative strength reads 72.76, past the overbought threshold, while the 14-day reading eased on the very session gold printed a one-month high. Short-window stochastics are pinned between 87 and 89 percent. The advance had run its immediate course before it ever reached the 100-day.
The news that should have worked, and did not
The most important analytical fact in this market is what gold failed to do. The geopolitical backdrop is as severe as it has been all year: Strait of Hormuz traffic collapsed to six vessels, an adviser to Iran's Supreme Leader said the waterway stays shut until conditions are met, and the United States is enforcing a port blockade with live fire. On that news, gold couldn't hold a one-month high. The reason is that the safe-haven bid is going into the dollar, not the metal, and the central bank behind the dollar is openly debating a hike. When the reserve currency absorbs the flight to quality and rates are the policy question, gold holds the risk without the reward.
Positioning is the amplifier. Managed money holds more than fifteen long contracts for every short, and that survey predates the run, so the real crowding is worse now. A book that one-sided has limited capacity to buy and substantial capacity to sell. It is the fuel that turns a disappointing data print into a disorderly decline.
Sell the retest, not the weakness
Gold enters Wednesday below its own pivot at 4,450.6, a bearish starting configuration, with dealer positioning negative and therefore amplifying. But the trade isn't to chase the current level near 4,430. The structure directly beneath is dense, and the reward on a chase is poor. The setup sells a retest of the 4,470 to 4,486 shelf that turned the market away, the zone stacking the 100-day, first pivot resistance, the target price and the one-month high inside 13 points, with a stop above 4,499 and targets at the pivot, then the quarterly midpoint, then first support. The whole thesis is conditional on the 8:30 inflation print, and the asymmetry favors the downside: a hot number reprices September policy and hits gold through real yields, while a soft one merely returns the committee to the ambiguity it already lives in.
The settle said gold had a good day. The hours after it, when the proxy fell while the future showed a gain, said the opposite.
If this news environment can't hold gold above its 100-day, a de-escalation headline would take the rest of the premium out in a hurry.
This is the read our members get every session, before the bell, with the levels drawn and the setup defined. See how the same dealer-positioning work turns into systematic signals.
View pricingThe complete data picture
Every number behind Tuesday’s plan, charted first; the full numeric reference follows underneath.
Full numeric reference , every remaining figure from the review
| Average | Value | Price vs about 4,430 |
|---|---|---|
| 5-day | 4,397.4 | +33 |
| 20-day | 4,195.8 | +234 (below 50-day) |
| 50-day | 4,233.3 | +197 |
| 100-day | 4,490.9 | -61 (confirmed resistance) |
| 200-day | 4,618.4 | -188 |
| YTD | 4,697.3 | -267 |
| Level | Reference |
|---|---|
| 4,384.4 | one-SD support (downside objective) |
| 4,371-4,373.9 | second pivot + week low + 38.2% |
| 4,360.9 | two-SD support |
| 4,342.9 | three-SD support |
| 4,326.9 | third pivot support |
| 4,276.9 | 9-day average (how far from mean) |
| Metric | Reading |
|---|---|
| Proxy close | 400.70, -0.46% (vs futures +0.48%) |
| Call gamma / put gamma | -214.61M / +97.27M (net negative) |
| Call vs put volume | 764.45k vs 295.23k (2.6:1) |
| One-month implied / realized | 26.12% / 23.57% |
| Implied-vol rank / skew rank | 42.70% / 84.46% |
| Implied move | about 73 futures pts |
| Vol-expansion reference | 390 proxy (about 4,310 futures) |
| Concentration expiry | Sept 17 |
| Cohort | Long / Short |
|---|---|
| Managed money | 139,809 / 9,043 (>15:1) |
| Non-commercials | 227,013 / 29,379 |
| Commercials | 71,832 / 298,323 (+10,554 shorts) |
| Swap dealers | 20,753 / 228,388 |
| Open interest | 307,620 |
| Read | crowded long = capacity to sell, not buy |
| Input | |
|---|---|
| Hormuz | 6 vessels; adviser: strait stays shut |
| Dollar index | about 99.80 (safe-haven via dollar, not gold) |
| 10-year yield | 4.691%, +0.15% (real yields up) |
| Chicago Fed | inflation is the biggest problem |
| Brent | 88.91, +1.36% |
| Read | gold could not hold a 1-month high on this news |
| When | Event |
|---|---|
| Wed 08:30 | US CPI 0.1% m/m, 3.4% y/y (the event) |
| Wed 13:00 | US 10-year note auction |
| Thu 04:00 | Norway rate decision |
| Thu 08:30 | US PPI 4.9% y/y + a July dissenter speaks |
| Fri 10:00 | Consumer sentiment + inflation expectations |
| Sep 16 | Next policy meeting |



