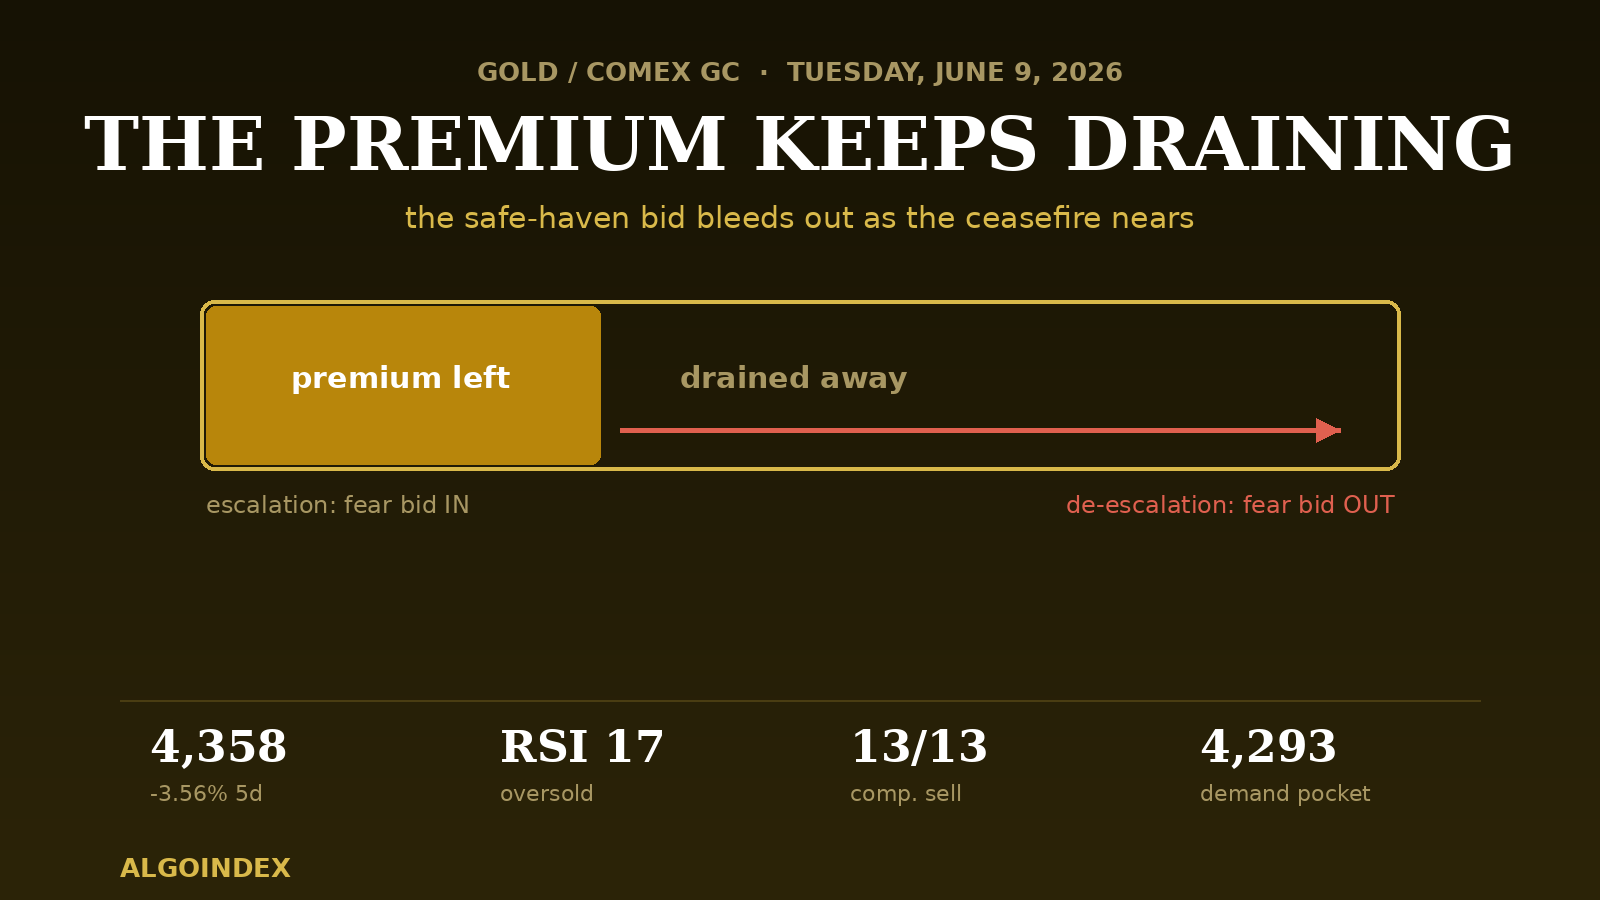
A week ago gold was defending its 200-day average. Yesterday it was trading beneath it as the safe-haven cushion deflated. Today the cushion keeps coming out. The front-month contract trades near 4,358, down about 0.15 percent from Monday's 4,363.4 settle and extending a slide that has now run 3.56 percent over five sessions and left the metal roughly 23.6 percent below its 52-week high. The driver is unchanged and relentless: as the Middle East moves toward an immediate ceasefire, the conflict premium that supported precious metals is draining out, and a firm dollar plus a patient central bank give a non-yielding asset no help. The one thing standing between gold and a deeper leg is how oversold it has become into tomorrow's inflation print.
The Premium Keeps Draining
The story is a continuation, not a new one. The fear premium that built into gold during the Middle East escalation is being priced out as both principal parties move toward an immediate ceasefire, and the entire metals complex is giving back conflict-premium gains together, with crude under the same pressure. This is a market-wide de-escalation trade, not a gold-specific event, which matters because it means the selling is driven by macro flow rather than anything broken in gold's own structure. Reinforcing it, Friday's firm payrolls print supports a stronger dollar and a more patient central bank, both headwinds for a metal that pays no yield. The dollar easing from its two-month high this morning is the one crack in that wall, hinting the most aggressive phase of the squeeze may be maturing even if the trend has not turned.
A Strong Downtrend Meets a Stretched Oscillator
The central tension into today is that the same readings can argue both ways. The trend is unambiguously lower: price below every moving average, a fully fanned bearish stack, and a directional system with strong trend strength and dominant downside pressure, the minus directional line near 28 to 30 against a plus line near 9 to 11. That says the prevailing move still has momentum behind it. But the short-window stochastics are pinned near 17 percent, the kind of stretched-oversold reading that precedes sharp relief bounces, and the dollar has begun to ease. Strong trend strength plus a washed-out oscillator is a market that can keep grinding lower and snap back violently from the same spot, which is why the disciplined play is to fade strength into resistance rather than chase weakness into oversold support.
The Level Map: Fulcrum, Fade Zone, Demand Pocket
The session organizes around three references. The daily pivot at 4,344.6 is the fulcrum, with the session low at 4,336 just beneath it. Overhead, the 4,389 to 4,396 band, the first pivot resistance stacked with a stochastic-stall level, is the higher-probability fade location given the dominant downtrend, with the heavier 4,429 to 4,432 zone above it the line a genuine relief attempt would have to clear. Below, the support thins to a target near 4,318 then 4,312, and then a dense demand pocket at 4,293 to 4,294, where the one-month low, the one-standard-deviation support, and the oversold relative-strength mark all converge into the most likely place for a bounce to start.
Three Ways the Session Resolves
Today's first-tier data is light, leaving price discovery to positioning and the geopolitical headline flow ahead of tomorrow's consumer-price report, the first-order catalyst for the metal via real yields. Three paths.
The Setup: Fade Strength, Don't Chase Weakness
In a strong downtrend the cleanest expression is to sell rallies into resistance rather than chase new lows into an oversold condition, especially the day before a marquee inflation release. The fade location is the 4,389 to 4,396 band on a visible rejection, taken patiently rather than on a blind limit.
Gold's correction is now several weeks old and several percent deep, and the force behind it, a draining fear premium and a firm dollar, has not yet reversed. But the metal is stretched, the dollar is wobbling off its high, and a marquee data point sits one session away. The structural bull case, official-sector demand and a long-term uptrend, is intact beneath the price action. What is unresolved is whether the correction has one more leg into the 4,290s before the buyers who have defended this market all year step back in, and tomorrow's number is the most likely trigger to decide it.
This analysis is for educational purposes and reflects conditions ahead of the Tuesday, June 9, 2026 cash open. It is not investment advice. Markets carry risk; conduct independent research before acting.