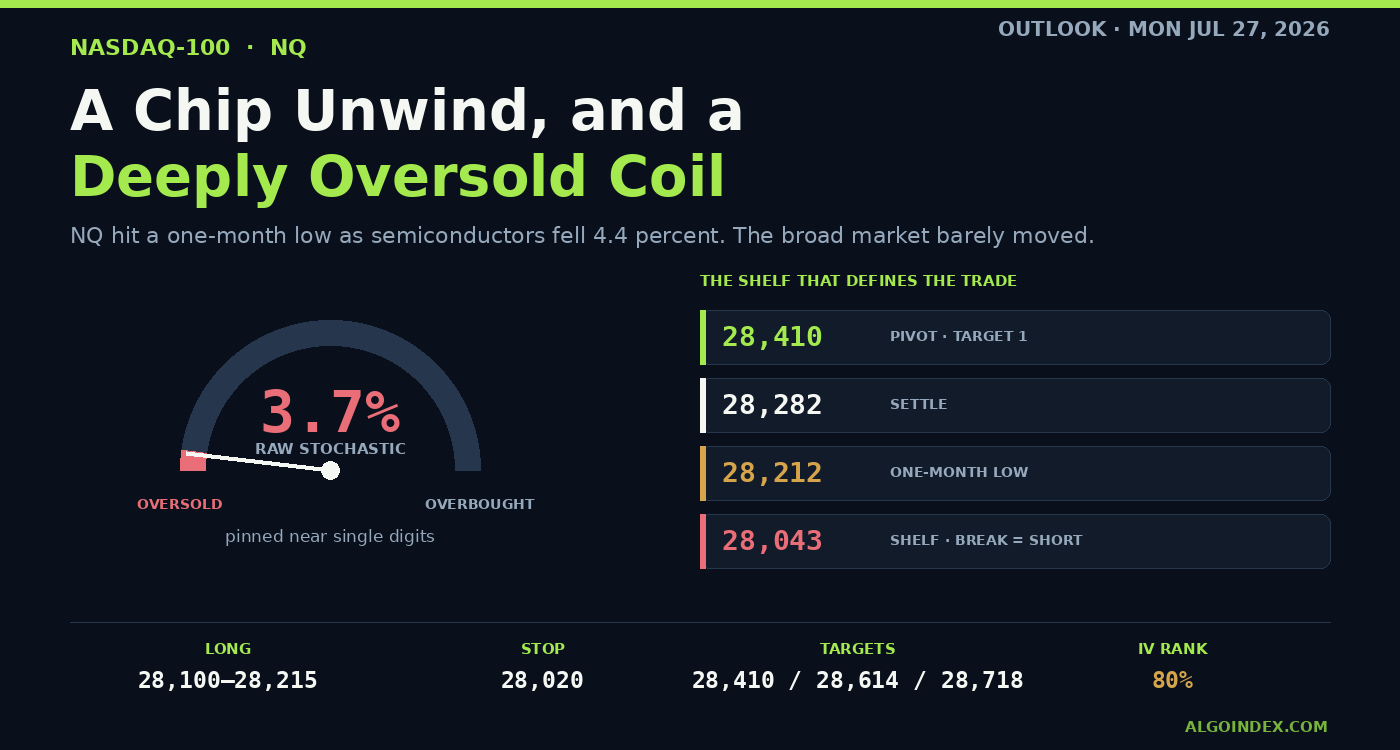
The Nasdaq-100 fell 1.18 percent to a one-month low as semiconductors shed 4.4 percent while the broad market barely moved, leaving raw stochastics pinned near 3.7 percent. Conditional long off the 28,043 to 28,212 shelf toward the 28,410 pivot; an accepted break flips it short.
The 60-second read
The Nasdaq-100 took Friday’s hit almost alone. The E-mini settled 28,282.25, down 1.18 percent at a fresh one-month low, while the S&P finished flat and the Dow rose. The cause was narrow and specific: chips shed about 4.4 percent while investors re-litigated how durable artificial-intelligence demand really is. Price now sits below its 5-, 20- and 50-day lines but comfortably above the 100- and 200-day, so it reads as a hard pullback nested in a longer uptrend. The interesting part is how stretched it got, with raw stochastics collapsing near 3.7 percent, deeply oversold. That sets a real tension for Monday between momentum sellers and a snap-back. Our lean is a conditional bounce off the shelf running 28,043 up to 28,212 toward the 28,410 pivot, flipping hard to the bearish case once 28,043 breaks and holds.
The thing to understand about Friday is how narrow it was. This wasn't the market falling. It was one sector falling hard enough to drag an index that happens to be full of it. Thursday’s note flagged the twin oil-and-AI shock hitting a growth index; Friday the oil half eased and the AI half did the rest.
Walk the session. NQ opened near 28,700, poked up to 28,736, then ground lower all day while the chip unwind picked up steam, basing near 28,212 and settling in the lower quarter of a 524-point range. Wide, but orderly. Over five sessions the contract has given back 491 points, and over twenty it has shed 1,442, roughly 4.85 percent, a fair gauge of how much of the July climb has already been surrendered.
A one-sector selloff, deeply oversold
-4.4%
Semiconductors
-1.18%
NQ E-mini
3.7%
Raw stochastic
80%
IV rank
A fresh one-month low on a chip unwind, with momentum pinned near single digits and options already loaded for the mid-week events.
Oversold is not the same as cheap
The momentum readings are the striking part. Raw stochastics near 3.7 percent on both the 9- and 14-day windows is roughly as pinned as that measure gets, and it's rare, and readings like it tend to precede either stabilization or a fast relief bounce. But the smoothed strength measures at 33 and 38.4 have not fully washed out, and the directional study is genuinely bearish, with negative pressure at 30.2 running well over positive at 9.1. The composite prints a 56 percent sell tilt, and it keeps building.
So the setup is a real fight rather than a clean signal. Momentum sellers have the trend, and an oversold market has the consolidation. That's why the plan is conditional on a level holding rather than a directional bet on the bounce arriving.
An oversold reading tells you the rubber band is stretched. It doesn't tell you which end lets go first, which is why the shelf has to hold before the long is worth taking.
The chips have to stabilize first
Semiconductors were the whole story, off about 4.4 percent amid renewed doubt about the sustainability of artificial-intelligence capital spending, even as one large chipmaker guided higher on data-center sales in the coming quarter. Word that a big supplier is lifting customer prices by double digits adds a cost wrinkle to the demand argument.
Because chip and AI sentiment sets the tone for Nasdaq leadership this cycle, that group steadying is all but required before any bounce can last. Watching how that sector opens tells you more about Monday than the durable-goods print will.
Negative positioning beneath spot
The options picture argues for respect on both sides. On the exchange-traded proxy, dealer readings are net negative on calls and puts alike, with the put side dominant around minus 1.27 billion against minus 432 million on the calls. In that state, hedging flows amplify moves in whichever direction price is already traveling, so both the bounce and the breakdown can run further than they would in a stabilizing market.
The proxy’s upper inflection near 703 maps to roughly 28,700 to 28,900 in the futures, right on the supply shelf. The heavier put-side positioning at 675 marks about 27,700 as the next downside magnet. And with implied-volatility rank near 80 percent, the options market has already loaded event premium for what is coming mid-week rather than pricing a calm stretch.
The shelf and the pivot: 28,043 and 28,410
Two numbers organize Monday. Beneath price, the 28,212 low doubles as the month's low and the first defense, backed by a dense shelf running 28,043 up to 28,084 where the target price, the first pivot support and a measured retracement all stack. That shelf is what the long leans on. Lose 28,043 on acceptance and 27,862 to 27,887 opens, then the band spanning 27,554 and 27,688.
Above, the 28,410 computed pivot is the fulcrum. Reclaim it and the path opens to the prior-close band at 28,608 and 28,620 where sellers should step back in, with the 28,700-to-28,736 supply shelf above that. Neutralizing the short-term downtrend entirely takes a reclaim of the 29,385-through-29,475 zone where the 18-day and the 20-day meet, which is a long way from here.
The trade
The base case is a conditional long: buy between 28,100 and 28,215 once the 28,212 low holds and gets reclaimed, ideally confirmed by taking back the 28,410 pivot, with the stop below 28,020 under the shelf. Scale out at 28,410, then the 28,608 and 28,620 pair, then 28,700 and 28,736, roughly 1:1.7 to the first target and about 1:3.9 to the last. Keep size modest, because this is mean reversion inside a downtrend, not a trend trade, and the negative-positioning backdrop cuts both ways.
The alternate carries the momentum: if 28,043 gives way and price accepts beneath it, a continuation short targets 27,887, then the band spanning 27,688 down to 27,554, with risk reset over 28,120. Stand aside if price saws inside 28,043 and the 28,410 pivot without a clean reclaim or break, if a weekend headline throws the open a full average range or more off the settle, and in the minutes around the 08:30 durable-goods release. Don't chase strength into that 28,608-through-28,736 supply without a pullback first.
The complete data picture
Every number behind Monday’s plan, charted first; the full numeric reference follows underneath.
CHARTED
Level map
CME Nasdaq-100 E-mini, front month · every reference from the review, to scale
BELOW THE SHELF: CONTINUATION 26,900-28,043ABOVE THE PIVOT: BOUNCE ALIVE 28,410-31,200THE SUPPORT SHELF / LONG ZONE 28,043-28,212
NQ settled 28,282.25 at a fresh one-month low after a 4.4 percent chip unwind. The 28,043 to 28,212 shelf is the support that defines the long; the 28,410 pivot is the fulcrum, and an accepted break under 28,043 flips the read to continuation toward 27,887 and the 27,554 to 27,688 band.
A narrow selloff
Chips did the damage; the broad market barely moved
Friday’s weakness was narrow, not broad. The chip sector shed roughly 4.4 percent on renewed questions about the durability of artificial-intelligence demand, dragging the tech-heavy index to a one-month low while the S&P finished flat and the Dow gained. A stabilization in semiconductors is close to a prerequisite for any durable bounce here.
Moving-average stack
Split by horizon: short down, long still up
Against the 28,282 settle, price sits below the 5-day at 28,836, the 20-day at 29,475 and the 50-day at 29,810, all now overhead resistance confirming the short and intermediate downtrend. It stays above the 100-day at 27,946, the 200-day at 26,947 and the year-to-date mean at 27,334, which anchors the longer uptrend and marks the 27,950-to-26,950 zone as the structural line for the bull case.
Momentum
Deeply oversold, with a strong short-term downtrend
The raw stochastics have collapsed to roughly 3.7 percent on both the 9 and 14-day, a deeply oversold read, while the smoothed relative-strength measures at 33 and 38.4 sit below the midline without a full washout. The directional study is firmly bearish, a 9-day trend-strength index of 32.5 with negative pressure at 30.2 over positive at 9.1, and the composite reads 56 percent sell and strengthening. That tension, momentum selling against an oversold snap-back, is the whole setup.
Expected range
One-ATR framing around the settle
The 14-day average true range is 669.55 points (2.37 percent) with an average daily range of 628 (2.22 percent) and the 9-day at 652. Historic volatility has risen to the 19-to-22 percent area from the low teens. That frames a one-ATR envelope of roughly 27,650 to 28,920 around the settle.
Primary setup
A conditional bounce off the shelf
Long the 28,100 to 28,215 zone on a hold and reclaim of the 28,212 low, ideally confirmed by a reclaim of the 28,410 pivot, stop below 28,020 beneath the target-price and first-pivot shelf. Targets the 28,410 pivot, then the 28,608 to 28,620 prior-close band, then the 28,700 to 28,736 supply. This is a mean-reversion trade, not a trend trade: keep size modest into the mid-week catalysts.
Dealer-positioning proxy
Nasdaq-ETF stand-in, negative on both sides
On the exchange-traded proxy, dealer readings are net negative on both sides, with the put side dominant near negative 1.27 billion against negative 432 million on the call side, a negative-positioning environment where hedging amplifies moves in the direction of travel. The proxy closed 691.92 with an evening mark near 684.73. The upper inflection near 703 maps to roughly 28,700 to 28,900 in the futures, aligning with the supply shelf, while the heavier put-side positioning near 675 marks about 27,700 as the next downside magnet. Implied-volatility rank near 80 percent, skew rank near 37.
The week ahead
All times Eastern · Monday is a positioning day
Monday is light: durable goods before the open (forecast plus 1.5 percent against a prior negative 4.5) and two note auctions. The gravity is mid-week, a rate decision and press conference Wednesday with two mega-cap technology reports that evening, growth and inflation data Thursday with two more, and a Bank of Japan decision Friday. The index path from Wednesday’s close will be set by those reactions.
Full numeric reference , every remaining figure from the review
Contract
CME Nasdaq-100 E-mini front month (NQU26). Review prepared Friday evening July 24 for the Monday July 27 regular session.
Session prints
The E-mini settled 28,282.25, down 338.50 points or 1.18 percent, at a fresh one-month low. It opened the cash window near 28,700, probed 28,736, then ground lower to base near the 28,212.50 low, a roughly 524-point range with the close in the lower quarter. The evening reopen prints a small further soft tilt around 28,282, with the current four-hour candle showing open near 28,700, high 28,736 and low 28,212. Semiconductors fell roughly 4.4 percent while the S&P 500 finished essentially flat and the Dow gained.
Range context
On five days NQ is down 491 points (1.71 percent); over twenty days 1,442 points (4.85 percent). The settle sits well beneath the 29,475 20-day average and near the lower end of the multi-week band. The 52-week high at 31,100 is roughly 9 percent overhead, the 52-week low at 23,170 sits 22 percent below, and the 13-week low is 27,259. The four-hour structure shows lower highs and lower lows, with swing resistance layered 28,608 to 28,736 and support at the 28,212 low, beneath which there is little structure until the 27,900 to 27,560 band.
Moving averages
Split by horizon. Price is below the 5-day at 28,835.80, the 20-day at 29,475.11 and the 50-day at 29,809.77, all now overhead resistance confirming the short and intermediate downtrend. It remains above the 100-day at 27,946.26, the 200-day at 26,946.98 and the year-to-date average at 27,334.04, which anchors the longer uptrend and marks 27,950 to 26,950 as the structural line for the bull case.
Oscillators and trend
The 9 and 14-day relative-strength reads sit at 33.0 and 38.4, beneath the neutral 50 line without a full washout on the smoothed measure. Raw stochastics are extreme: 3.77 percent on the 9-day and 3.74 on the 14-day, with smoothed percent-K near 19 to 21, deeply oversold. The directional-movement read shows a 9-day trend-strength index of 32.5 with negative pressure at 30.2 dominating positive at 9.1. The multi-indicator composite reads 56 percent sell and is strengthening, with the trend signal on sell.
Volatility
The 14-day average true range is 669.55 points (2.37 percent), the average daily range 628 points (2.22 percent), and the 9-day true range about 652. Historic volatility has risen to the 19 to 22 percent area across the 9 to 20-day windows, up from the low teens. That frames a roughly 630 to 670-point envelope around the settle, spanning about 27,650 downside to 28,920 upside on the one-ATR band.
Key levels
Resistance: the 28,410 computed pivot; the 28,608 to 28,620 prior-close and first-resistance band; the 28,702 one-SD band with Friday's 28,736 high (a 28,700 to 28,740 supply shelf); the 28,876 to 28,934 zone (two-SD and second pivot) guarding the 9-day average near 28,984; then 29,131 (third pivot) and the 29,385 to 29,475 band where the 18 and 20-day averages converge. Support: the 28,212 session and one-month low; the 28,043 to 28,084 shelf (target price and first pivot support, reinforced by the 28,071 measured retracement); then 27,862 to 27,887 (one-SD and second pivot), 27,554 to 27,688 (two and three-SD and third pivot), and the 27,259 13-week low.
Options and dealer positioning
Read from the Nasdaq exchange-traded proxy plus a post-close desk note dated July 24. The proxy closed 691.92 with an evening mark near 684.73, down about 1 percent. Dealer readings are net negative on both sides, put positioning dominant at roughly negative 1.27 billion against negative 432 million on the call side, with implied-volatility rank near 80 percent and skew rank near 37. The upper inflection near the 703 area maps to roughly 28,700 to 28,900 on NQ, aligning with the futures supply shelf, while heavier put-side positioning near 675 marks about 27,700 as the next downside magnet. The desk note describes the S&P entering a negative-positioning environment beneath 7,400 and flags forward implied volatility for the mid-week dates running several points above spot reads.
Macro drivers
Wednesday's central-bank rate decision, statement and press conference is the largest macro event; the market is priced for a hold, so the tension sits in forward guidance. Recent inflation cooled (consumer prices 3.5 percent, producer prices 5.5, both undershooting). Two of the largest index constituents report Wednesday evening and two more Thursday. Trade policy is back in focus with new tariff measures floated across roughly sixty nations and a retaliation threat toward the European Union tied to a large fine on a mega-cap technology parent; Middle East strikes continue. Friday's US flash surveys were firm: services 53.6, manufacturing 53.8, composite 53.6, alongside a new-home-sales beat, while WTI crude fell roughly 3 percent. The volatility index closed near 18.6 with its second-order gauge near 100.
Setup and paths
Primary conditional long: entry 28,100 to 28,215 on a hold and reclaim of the 28,212 low, ideally with a reclaim of 28,410 for confirmation; stop below 28,020; T1 28,410, T2 28,608 to 28,620, T3 28,700 to 28,736; about 1:1.7, 1:3.1 and 1:3.9 from the mid-entry. Invalidation on accepted trade below 28,020. Alternate short: on an accepted break and hold below 28,043, target 27,887 then 27,688 to 27,554, stop back above 28,120. Paths: A oversold bounce about 45 percent (hold 28,212, reclaim 28,410, tag 28,608 to 28,620, fade into the close), B continued grind about 35 percent (fail the pivot, break 28,212 and 28,043 toward 27,887 to 27,700), C consolidation beneath the pivot about 20 percent (chop 28,043 to 28,410). Monday bands: low 27,700 to 27,900, mid 28,100 to 28,450, high 28,650 to 28,900. No entries before 09:45 ET.
Calendar
04:00 ET German business-climate and expectations surveys; 08:30 ET US durable-goods orders (forecast plus 1.5 percent versus a prior minus 4.5) and core durable goods (forecast plus 0.9 percent), the single first-order item and it lands pre-open; 11:30 ET US 2-year note auction; 13:00 ET US 5-year note auction. Monday is a positioning day ahead of a decisive mid-week: the rate decision and press conference Wednesday, two mega-cap technology reports that evening, growth and inflation data plus two further reports Thursday, and a Bank of Japan decision Friday.
AlgoIndex publishes institutional-grade reviews on ES, NQ, GC, and CL, built on professional-grade market data and our own analysis, priced for individual traders.