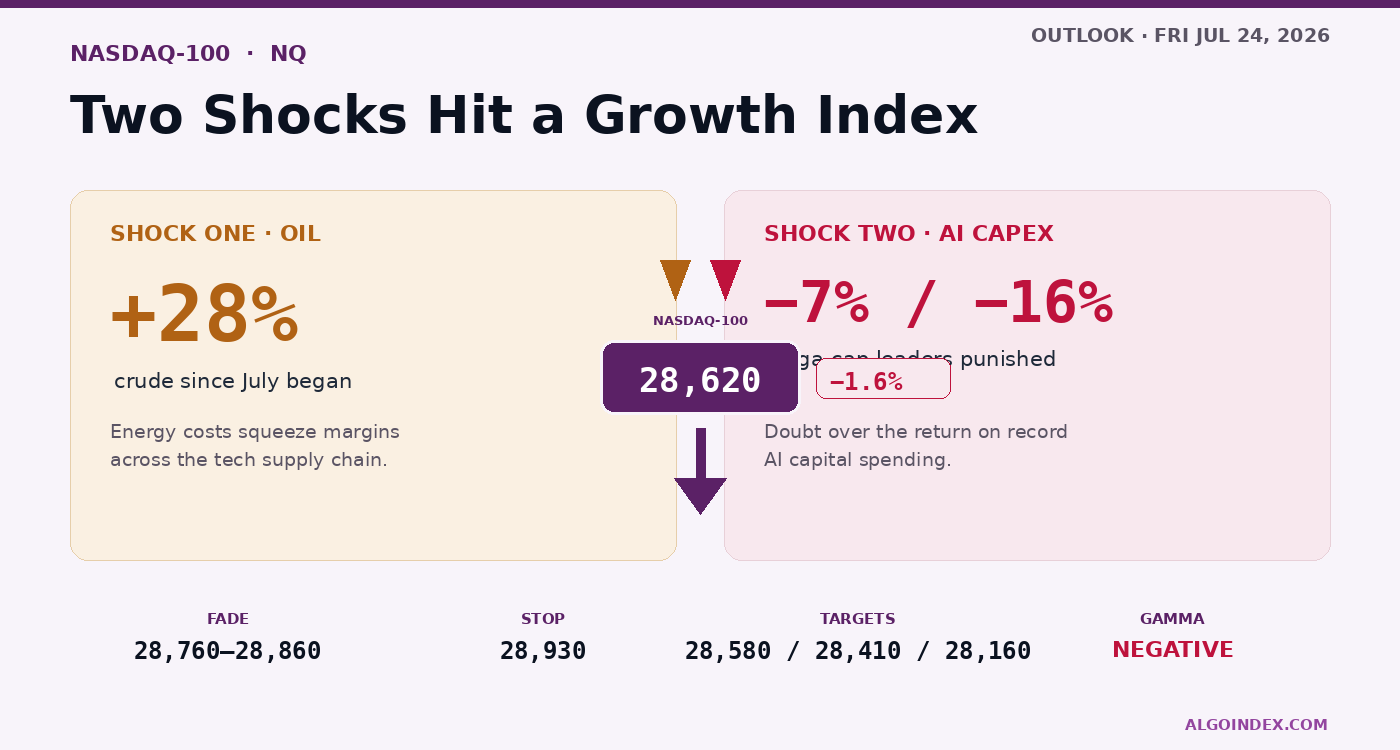
The Nasdaq-100 fell about 1.6 percent in its worst mega-cap day in a year as an oil spike and cooling AI-spending conviction hit together, with dealer positioning beneath its gamma-flip so hedging now amplifies moves. Fade rallies into 28,760 to 28,860 toward 28,410; a reclaim of 28,925 neutralizes it.
The 60-second read
The Nasdaq-100 took the brunt of Thursday’s selling. The September E-mini settled 28,620.75 and the cash index fell about 1.6 percent, the heaviest mega-cap day in more than a year, as the technology names that carried the whole market all year saw their sharpest one-day unwind. Two shocks did the damage at once: crude oil above 90, up roughly 28 percent since July began, and a crack in conviction on the artificial-intelligence spending cycle after a mega-cap leader was punished for raising its capital plans. Price slipped below its 5-day, its 20-day and its 50-day line while holding well above the rising long-term lines, so it's a hard correction, not yet a trend break. The wrinkle is mechanical: dealer positioning has fallen beneath its gamma-flip level, which means hedging now amplifies moves rather than calming them. We lean short, fading rallies into the 28,760-to-28,860 shelf, with the 09:45 flash surveys set to pick the direction.
This was leadership cracking, not a gentle drift. For an index this concentrated in a handful of giant technology names, when those names break together the whole thing goes with them, and on Thursday they broke together. Wednesday’s note flagged the same negative-gamma setup pinned into these reports; a day later the earnings landed and the amplifier switched on.
Look at the two engines. The first is oil. Crude has jumped above 90 as the conflict around Iran and the Strait of Hormuz intensifies, and rising energy costs squeeze margins right across the technology supply chain while reviving an inflation impulse the market had been happy to fade. The second is the artificial-intelligence trade itself. A dominant search-and-cloud name lifted its capital-spending plan and was sold hard for it, reopening the question of whether these enormous outlays will ever earn their keep.
Twin shocks hit a growth index
-1.6%
Nasdaq-100 cash
+28%
Crude since July
28,620
E-mini settle
62%
IV rank
The worst mega-cap day in over a year, driven by an oil spike and cooling AI conviction, into a negative-gamma backdrop. Still above the long-term trend.
Negative gamma is the accelerant
The positioning read's what makes this session different from an ordinary down day. The exchange-traded proxy for the index closed beneath both its volatility inflection and its gamma-flip level, which flips dealer hedging from a stabilizer into an amplifier. Below the flip, market makers hedge in the direction price is already moving, so a push lower tends to feed on itself rather than mean-revert. Aggregate gamma sits negative near 527 million, and implied volatility leapt over 12 percent, a sign that hedging demand is building rather than fading.
That backdrop cuts both ways, and that's the trap. The very short-term readings are stretched, with the raw stochastic buried near 12 percent, so an oversold market in a negative-gamma setting can produce a violent snap-back just as easily as a flush. Whichever way the morning data pushes price, the move is prone to extend.
A negative-gamma market is a market with the brakes off. It doesn't glide back to fair value; it overshoots in whichever direction it is shoved, which is why size and location matter more than a clean directional call here.
The averages rolled, the trend held
The technical picture is a two-speed split. Spot near 28,620 has dropped under its 5-day up at 28,934, its 20-day near 29,547, plus its 50-day at 29,832, for the first stretch below the short and medium lines in weeks sit overhead, and the four-hour chart is carving lower highs and lower lows off the 30,600 rejection. But the 100-day sits up at 27,915 with the 200-day beneath at 26,934, both far under price and rising, and the index remains up over 10 percent on the year. This is a correction inside a bull structure, not a change of environment.
The distance from price to the 20-day, more than 900 points, stands out on its own. A gap that wide often earns a bounce toward the fast average even mid-downtrend, which is exactly the counter-trend risk a short has to respect.
The bracket: 28,410 below, 28,925 above
Two levels frame Friday. Beneath price, the 28,580 target shelf leads into the 28,410 one-month low, the line whose loss would confirm the corrective leg is extending. Below that, the 28,150 area is the primary downside magnet, where the proxy’s principal gamma pocket lands in the futures, so a break of 28,410 has a clear objective. Overhead, the 28,760-to-28,860 shelf is where rallies are there to be sold, backed by the pivot near 28,780.
The number that flips the whole read is 28,925, the dealer flip line. Reclaim and hold above it and the amplified-move environment neutralizes, opening the 29,040-through-29,125 resistance. Until that happens, the mechanical bracket tilts to the downside.
The trade
The base case leans short: fade a rejection of 28,760 to 28,860 after the 09:45 gate, ideally a failed retest after a soft purchasing-manager print, with the stop on a close back above 28,930. Scale down to the 28,580 target, then the 28,410 low, then the 28,160 magnet. The reward against risk runs roughly 1:1.9 to the first target and about 1:5.4 to the last, which is the payoff for selling the bounce rather than chasing the break.
The counter-trade is event-driven and worth naming. A firm 09:45 print, helped by the after-hours semiconductor beat that rose about 7 percent, can lift price over 28,930 and keep it there, at which point a long on the 28,930-and-28,960 retest toward 29,040 and then 29,125 is viable with a stop back under 28,860, sized smaller because that's what it is, a counter-trend trade. Stand aside if the survey rips price outside the 28,400-through-28,925 bracket before any structure forms, and take nothing in the first fifteen minutes.
The complete data picture
Every number behind Friday’s plan, charted first; the full numeric reference follows underneath.
CHARTED
Level map
CME Nasdaq-100 E-mini, September front month · every reference from the review, to scale
BELOW THE LOW: NEGATIVE-GAMMA FLUSH 27,350-28,410ABOVE THE FLIP: TONE NEUTRALIZES 28,925-31,200FADE-THE-RALLY ZONE 28,760-28,860
The index settled 28,620 after its worst mega-cap day in over a year, below its 5, 20 and 50-day averages and in a negative-gamma environment. The 28,760 to 28,860 shelf is the fade zone; a loss of the 28,410 one-month low opens the 28,150 gamma magnet, and a reclaim of 28,925 neutralizes the amplified-move setup.
Moving-average stack
Bearish near-term, bullish long-term
Spot near 28,620 sits below the 5-day at 28,934, the 20-day at 29,547 and the 50-day at 29,832 for the first time in weeks, yet comfortably above the 100-day at 27,915 and the 200-day at 26,934. The gap to the 20-day is more than 900 points, wide enough to make a relief bounce toward the 5-day plausible even inside a downtrend.
Where the damage was
A mega-cap breakdown, with an after-hours offset
The seven largest technology names drove roughly three-quarters of the market’s hedging flow and logged their worst session since the April 2025 tariff selloff. A search-and-cloud leader fell about 7 percent for lifting its capital-spending plan, an electric-vehicle maker dropped roughly 16 percent. A large semiconductor beat after the close and rose near 7 percent, which could steady early Friday flow.
Momentum
Weak, but not yet washed out
The 9-day relative strength near 37 and the 14-day near 41 sit below the midline but above conventional oversold, and the raw stochastic near 12.6 percent flags a very short-term oversold market prone to sharp counter-trend snaps. The multi-indicator composite has flipped to a 48 percent sell, and the proxy’s implied-volatility rank near 62 percent says premium is now bid for movement, not compression.
Expected range
One-ATR framing, skewed down
Average true range runs 668 to 681 points, about 2.4 percent, framing a most-likely envelope of roughly 27,940 on the downside to 29,300 on the upside around the 28,620 settle. The one-month low near 28,410 and the 28,760 to 28,860 resistance are the edges that define the two-sided day, with a modest downside skew given the negative-gamma backdrop.
Primary setup
Fade the rally into overhead supply
Short-side interest on a rejection of 28,760 to 28,860 after the 09:45 gate, ideally a failed retest that follows a neutral-to-soft purchasing-manager print, stop on a reclaim and hold above 28,930. Targets 28,580, then the 28,410 one-month low, then the 28,160 gamma magnet. A strong 09:45 print or a sharp energy de-escalation favors the relief-bounce path instead.
Dealer-positioning proxy
Nasdaq-100 stand-in, beneath the flip, moves amplify
The proxy closed near 705, beneath both its volatility inflection at 706 and its gamma-flip at 709, a negative-gamma state where dealer hedging reinforces directional moves. Aggregate gamma notional is negative near 527 million. The principal downside concentration at the 700 strike maps to roughly 28,150 in the futures, so the near-term mechanical bracket is asymmetric to the downside until price is pushed back above the flip.
Friday’s calendar
All times Eastern · the 09:45 survey sets the tone
The defining event is the 09:45 flash purchasing-manager batch (manufacturing near 54.4, services near 51.5). In the negative-gamma setting, whichever way the data pushes price is prone to extend, so the morning is the session’s highest-opportunity and highest-risk window; the heavier events sit next week.
Full numeric reference , every remaining figure from the review
Contract
CME Nasdaq-100 E-mini front month (NQU26). Review prepared Thursday evening July 23 for the Friday July 24 regular session. Futures carry a roughly 145 to 165-point basis to cash.
Session prints
The September E-mini settled 28,620.75; the cash index closed near 28,476, off roughly 1.6 percent, the heaviest mega-cap distribution in more than a year. The E-mini has shed about 605 points (2.07 percent) over five sessions and 893 over twenty. Selling was front-loaded into the first ninety minutes. The evening reopen held a 28,620 to 28,710 band, lifted modestly by an after-hours semiconductor beat that traded up about 7 percent.
Range context
Lower highs and lower lows since the 30,600 rejection; the four-hour leg carried price through the 29,500 shelf and the 29,124 pivot without a bounce. The one-month high is 30,599.75 and the 52-week high 31,100; the one-month low is 28,408.25, the immediate line in the sand, with price in the lower third of the one-month range. Year to date the contract is still up more than 10 percent, so this is a correction inside a bull structure.
Moving averages
Bearish near-term, bullish long-term. Spot near 28,620 sits below the 5-day at 28,934, the 20-day at 29,547 and the 50-day at 29,832, and above the 100-day at 27,915, the 200-day at 26,934 and the year-to-date mean at 27,327. The gap to the 20-day, more than 900 points, is wide enough to make a relief bounce toward the 5-day plausible even inside a downtrend.
Oscillators and trend
The 9-day relative strength reads 36.86 and the 14-day 41.04, both below the 50 line but above oversold; the 20-day at 44.28 and 50-day at 50.57 show the deterioration is concentrated in the shorter windows. The 14-day stochastic sits at 31.78 percent (fast) and 30.10 percent (slow), with the raw near 12.6 percent, a very short-term oversold read. The multi-indicator composite has flipped to a 48 percent sell, the 20-day window a full sell and the 100-day still constructive.
Volatility
The 14-day average true range is roughly 681 points (2.38 percent), the 9-day about 668, with average daily range near 630 to 650. A one-ATR band on the 28,620 settle frames a most-likely envelope of roughly 27,940 downside to 29,300 upside, centred near 28,600. The equity volatility index closed near 18.7, up more than 12 percent Thursday, and the proxy's implied-volatility rank near 62 percent signals option premiums priced for movement.
Key levels
Resistance: the 28,710 to 28,780 shelf (daily pivot 28,778 plus upside gamma proxy); 28,860 to 28,920 (stochastic stall 28,859, one-SD 28,919); the 28,900 to 28,925 dealer gamma-flip; 29,040 to 29,125 (first and second pivots); 29,510 to 29,630 (20-day and second pivot 29,628); the one-month high 30,600 and record 31,100. Support: the 28,580 target price with one-SD near 28,323; the 28,400 to 28,410 one-month low; 28,275 to 28,320 (first pivot 28,275); the 28,145 to 28,200 downside gamma magnet (two-SD 28,199); then 27,930 (third pivot) and the 27,425 flush tail.
Options and dealer positioning
Read from the Nasdaq-100 exchange-traded proxy plus a PM desk note (July 23). The proxy closed near 705.27, beneath its volatility inflection at 706 and its gamma-flip at 709, a negative-gamma state where hedging amplifies moves. The principal upside gamma (call resistance) sits at the 730 strike, the downside concentration and primary strike coincide at 700, mapping to roughly NQ 28,150 to 28,160; upside call resistance far overhead near NQ 29,700, the nearer cash-index call resistance near NQ 28,710. Aggregate dealer gamma notional is negative near 527 million; implied-volatility rank near 62 percent. As short-dated put-selling positions expire, renewed put demand could push gamma further negative and widen the swing range.
Macro drivers
Twin shocks: crude oil above 90, up roughly 28 percent since July began, on the Iran and Strait of Hormuz escalation; and a crack in AI capital-spending conviction after a search-and-cloud leader lifted its outlay and fell about 7 percent, with an electric-vehicle maker down roughly 16 percent on falling profit. A semiconductor beat after the close rose near 7 percent (primary gamma strike near 110, call resistance at 120). Inflation had cooled, consumer prices 3.5 percent and producer prices 5.5, but the energy spike pressures that disinflation. A search-and-cloud firm's stake in a leading AI developer was reported near 124 billion. The next Federal Reserve decision and second-quarter output data sit the following week.
Setup and paths
Primary short: fade a rejection of 28,760 to 28,860 after 09:45 ET (stop above 28,930); T1 28,580, T2 28,410, T3 28,160; about 1:1.9, 1:3.6 and 1:5.4 from the mid-entry. Invalidation on sustained trade above 28,930, which opens 29,040 to 29,125. Alternate long on a reclaim: above 28,930 and holding, a long from the 28,930 to 28,960 retest targets 29,040 then 29,125, stop below 28,860, sized smaller. Paths: A data-driven fade about 45 percent (reject 28,710 to 28,780, work to 28,400 to 28,580, 28,150 on a break), B relief bounce about 35 percent (firm data lifts through 28,780 to the 28,900 to 28,925 flip test), C flush and reverse about 20 percent (break 28,400 to 28,150 then a negative-gamma snap-back). No overnight hold; no entries before 09:45 ET.
Calendar
07:00 ET second-quarter results from a major payments network and a large telecom carrier (a Nasdaq-100 constituent); 08:30 ET Canadian producer prices; 09:45 ET US flash purchasing-manager surveys (manufacturing near 54.4 versus 53.9 prior, services near 51.5 versus 51.2, composite near 51.8 versus 51.9), the single first-order event; 10:00 ET new home sales (near 0.606 million versus 0.580 prior); 11:30 ET a senior European Central Bank official. Overseas European and UK flash surveys populate the 03:15 to 04:30 ET window.
AlgoIndex publishes institutional-grade reviews on ES, NQ, GC, and CL, built on professional-grade market data and our own analysis, priced for individual traders.