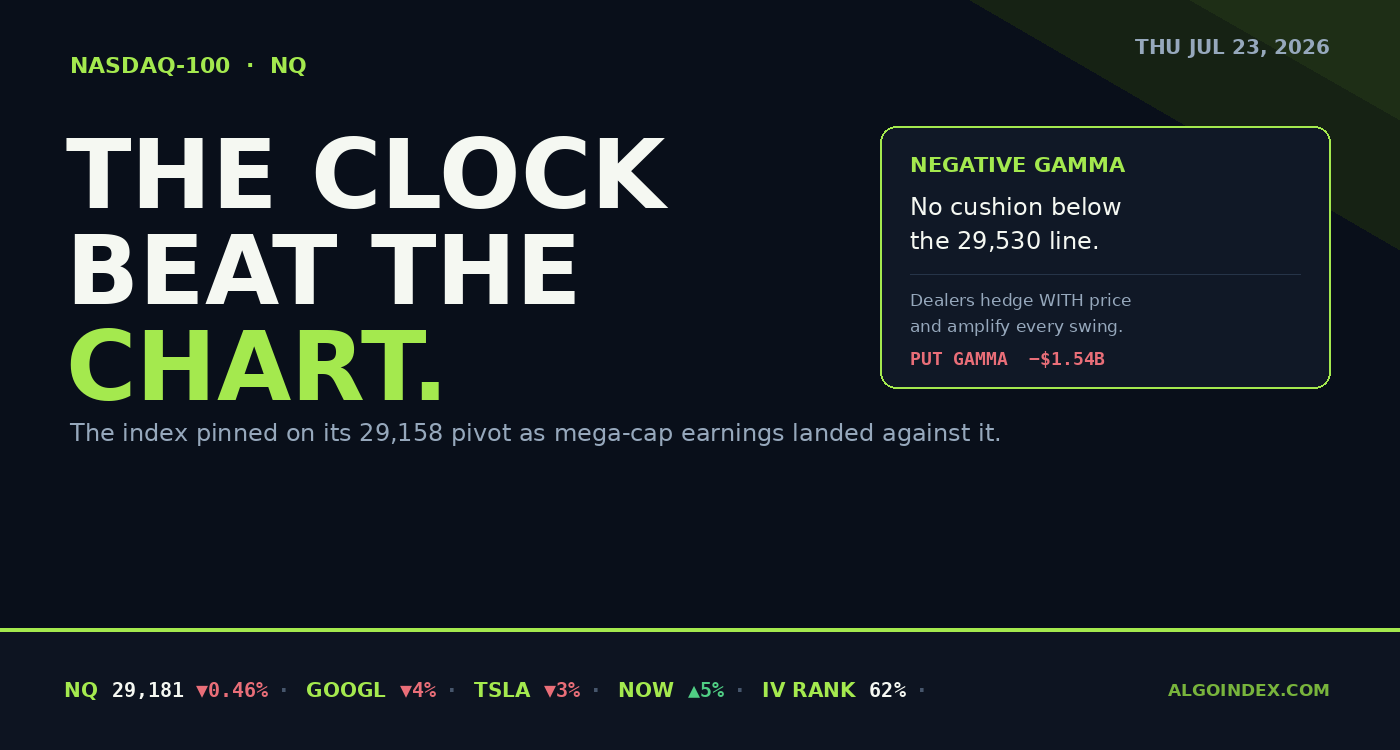
The Nasdaq-100 pinned on its 29,158 pivot as Alphabet and Tesla fell after the bell and the options proxy sat in negative gamma, which amplifies moves. Base case: long the 29,020 to 29,160 support toward 29,300; the 28,674 base is the magnet if the pivot breaks. Half size into Intel.
The 60-second read
The Nasdaq-100 spent Wednesday handing back most of Tuesday’s chip-led bounce, settling 29,181.25, roughly 135 points or 0.46 percent lower, as traders squared up before the loudest night of mega-cap earnings. Then the reports landed and they tilted against the index: Alphabet slipped about 4 percent even on a beat once it raised its spending plans, and Tesla lost about 3 percent on a soft quarter. Both carry real index weight, so the after-hours tone leans against Thursday’s open, and the reopened market confirmed it by drifting toward 29,160. Two facts frame the next session: the index is resting right on its 29,158 pivot, and the options structure underneath it sits in negative gamma, which amplifies moves instead of calming them. Our plan is to buy the 29,020 to 29,160 support if it holds, and to keep size light with Intel still to report after Thursday’s bell.
Wednesday was about the calendar, not the candles. The chart barely moved because everyone was waiting on the same after-hours prints, and the real session started at 4:00 p.m. when the reports began to drop. Wednesday’s note flagged this exact setup, an index compressed under its 20-day into the reports; now the results are in.
Zoom out and the setup is a short-term pullback sitting inside a longer climb. It holds over a rising 5-day line around 29,018, but has dropped beneath both the 20-day up at 29,568, plus the 50-day up at 29,841, while the 100-day and the 200-day both sit far under price and keep climbing. That's the profile of a market digesting a strong multi-month run, not one rolling over. The last two weeks have been distribution and rest, with the five-day change off about 183 points, the 50-day down roughly 647.
A pullback inside a bigger climb
29,181
Settle
-0.46%
On the day
-6%
Below the record
+25%
Above 52-wk low
Two weeks off the July 15 record near 31,100, still a quarter above the year’s low. The trend is intact; the near term is soft.
The mega-caps that matter fell
The night belonged to three names. Alphabet cleared the earnings bar but dropped roughly 4 percent once it pushed its 2026 capital-spending plan up toward the 195-to-205 billion zone, which is exactly the kind of number that makes investors ask how long heavy artificial-intelligence spending will weigh on margins even as it cements the growth story. Tesla gave up about 3 percent on a second-quarter profit miss and softer automotive margins. ServiceNow went the other way, up about 5 percent on a clean beat, and Texas Instruments cleared its number and set next quarter above the bar, a steadying read for chips.
Weight is what makes it bite. Alphabet and Tesla are heavyweight index members, so their slips do more damage to the Nasdaq than ServiceNow’s gain repairs. And the calendar keeps the pressure on: Intel reports after Thursday’s close and T-Mobile before the open, so single-name swings stay in charge of the session.
Negative gamma, no cushion
Here's the structural fact that separates this Nasdaq setup from the steadier S&P next door. The exchange-traded proxy for the index sits in negative gamma on both sides, a call figure near negative 163.5 million against a put figure near negative 1.54 billion. In plain terms, dealers are hedging in the direction the market is already moving, which pours fuel on intraday swings rather than smothering them. There's no shelf catching a fall the way positive gamma does elsewhere.
The line where that changes sits near a 715 strike on the proxy, roughly 29,530 on the index, which lands right on that 29,548-through-29,568 ceiling. Below that inflection, where the market is trading now, expect wider moves and less snap-back. A soft open can keep going rather than bouncing on its own.
Positive gamma is a shock absorber; negative gamma is an accelerator. Below the 715-equivalent line the Nasdaq has no mechanical brake, so location and size matter more than usual.
The pivot and the base: 29,158 and 28,674
Two levels organize Thursday. The first is the 29,158 pivot the index is sitting on, backed by the 29,022 overnight low just beneath it. Hold that shelf and the path opens back toward the 29,245 retracement and the 29,300 target. The second is the deeper base from 28,674 up to 28,817, a heavy volume shelf where the measured downside extensions gather; that is the highest-odds magnet if the pivot gives way, and it's where the long makes sense on a flush.
Overhead, everything routes through the ceiling from 29,548 up to 29,568, where the 20-day average meets the proxy inflection. Reclaim it and the short-term tone flips constructive toward 29,755 and the 29,841 fiftieth-day line. Short of that, rallies into the shelf are mechanical resistance tests, not trend, and they can be faded on a tight leash.
The trade
The base case is a long from support. Buy the 29,020 to 29,160 zone on a pullback that holds the 29,158 pivot, or on a reclaim once an early dip into 28,974 gets bought, with the stop set as soon as 28,930 gives way. Scale out at 29,300, then 29,365 to 29,422, then the 29,548-through-29,568 cap, roughly 1:1.6 to the first target and near 1:3.6 to the last. The trend is still up and a data-light session favors a rotation off a defended base, but the negative-gamma backdrop argues for half size.
The alternate is a lower-conviction short fade: if the market runs directly up into the 29,540s and stalls just beneath 29,568 with the composite still leaning net-sell, sell 29,540 to 29,570 with a stop above 29,610, aiming back at 29,365 then 29,245. It's a fade of a resistance test, not a directional short. Two rules sit over the whole map: stand aside into the 08:15 European rate decision until the reaction settles, and flatten ahead of the Intel print, because carrying index size through a mega-cap report in negative gamma is the definition of poor location.
The complete data picture
Every number behind Thursday’s plan, charted first; the full numeric reference follows underneath.
CHARTED
Level map
CME Nasdaq-100 E-mini, front month · every reference from the review, to scale
BELOW PIVOT: NEGATIVE GAMMA 28,300-29,158ABOVE PIVOT: ROTATION 29,158-31,200SUPPORT BASE / LONG ZONE 28,674-28,817
Price rests on the 29,158 pivot after giving back Tuesday’s chip-led bounce. The 28,674 to 28,817 base is the structural support and the long zone; the 29,548 to 29,568 shelf, where the 20-day meets the proxy’s volatility inflection, is the ceiling that separates more correction from a real recovery.
Moving-average stack
Short-term corrective, long-term intact
Against the 29,181 settle the index sits above its rising 5-day near 29,018 but below the 20-day near 29,568 and the 50-day near 29,841, while holding far above the 100-day at 27,920 and the 200-day at 26,936. The 20-day is the single most important overhead line: reclaiming it flips the short-term structure back constructive.
The mega-cap earnings drag
Index-weight names fell after the bell
Alphabet beat but fell about 4 percent after raising 2026 capital-spending guidance to a 195 to 205 billion range, and Tesla slid about 3 percent on a second-quarter profit miss; ServiceNow rose about 5 percent on a beat. Because Alphabet and Tesla carry real index weight, the net after-hours read is a headwind into Thursday, with Intel still to report after the close.
Momentum and volatility
Soft, not exhausted, in an amplifying environment
Relative strength across the 9 to 20-day sits in the low-to-mid 40s, soft but not oversold, and the multi-indicator composite reads net-sell near 40 percent. The proxy’s implied-volatility rank near 62 percent is elevated, and the negative directional index over the positive says a modest downtrend has been in force for one to two weeks.
Expected range
Scenario bands against the average-range envelope
Average true range runs 591 to 631 points, near 2 percent, so a plausible Thursday envelope is roughly 28,880 on the downside to 29,520 on the upside around the 29,181 settle, with a most-likely core between 29,150 and 29,300. The 29,548 to 29,568 ceiling and the 28,940 support are the edges that define the two-sided day.
Primary setup
Long from the support shelf
Long the 29,020 to 29,160 zone on a pullback that holds the 29,158 pivot, or a reclaim after an early flush into 28,974, stop on a sustained loss of 28,930. Targets 29,300, then 29,365 to 29,422, then the 29,548 to 29,568 ceiling. Flatten or reduce ahead of the Intel after-close report; do not carry index size through the print.
Dealer-positioning proxy
Nasdaq-100 exchange-traded stand-in, no cushion below the inflection
The proxy sits in negative gamma on both sides, a call reading near negative 163.5 million and a put reading near negative 1.54 billion, so dealers hedge with price and amplify intraday swings rather than damp them. The volatility inflection near a 715 strike maps to roughly 29,530, in line with the 29,548 to 29,568 ceiling; below it, expect wider moves and less mean reversion. Put-to-call open interest sits near 1.38, and the implied move runs about 1.5 percent.
Thursday’s calendar
All times Eastern · earnings digestion leads, Intel looms
The domestic slate is light: weekly jobless claims are second-tier and the 08:15 to 08:45 European rate window shapes cross-asset tone. The first-order driver stays the digestion of Wednesday’s after-close mega-cap prints layered onto the Intel report after Thursday’s bell.
Full numeric reference , every remaining figure from the review
Contract
CME Nasdaq-100 E-mini front month (NQU26). Review prepared Wednesday evening July 22 for the Thursday July 23 regular session. Forecast and setups are next-session-forward.
Session prints
The front month settled 29,181.25, down roughly 135 points or 0.46 percent, giving back most of Tuesday's chip-led rebound near 29,316. The reopened evening session held a compressed 29,021.75 to 29,142.50 window on light volume near 14,600 contracts; the reopened session drifted to roughly 29,120 to 29,170, and price near 29,160 sits below the 29,181 settle. The S&P 500 closed 7,499 (down 0.14 percent), the volatility index 16.64 (down 2.4 percent), the Dow front month near 52,400, gold near 4,128, and the yen near its weakest since 1986.
Range context
The index is two weeks into a corrective pullback from the July 15 high near 31,100 (also the 52-week high); the one-month high is 30,599. Range position is about 6 percent below the record and roughly 25 percent above the 52-week low at 23,170. The five-day change is negative 182.75 points, the 20-day negative 471, the 50-day negative 647. The 4-hour structure sits mid-range between a 29,400 recovery high (July 21) and a 28,600 swing low around July 17 to 18, after a mid-July peak near 30,000, with auto-derived extensions at 28,817, 28,674 and 28,516.
Moving averages
Against the 29,181 settle: above the 5-day at 29,018.45, below the 20-day at 29,568.35, below the 50-day at 29,841.27, above the 100-day at 27,919.63 and the 200-day at 26,936.30, with the year-to-date average at 27,330.28. Short-term corrective beneath the 20 and 50-day while the intermediate and long-term averages remain supportive and upward-sloping; the 20-day near 29,568 is the most important overhead line.
Oscillators and trend
Relative strength: 42.3 on the 9-day, 44.7 on the 14-day, 47.0 on the 20-day, 51.9 on the 50-day, none extreme. Short-lookback stochastics in the high-20s to high-30s, mildly washed out but not oversold. The 14-day negative directional index at 23.1 sits above the positive at 13.2, with a 9-day trend-strength reading near 28. The multi-indicator composite reads net-sell near 40 percent.
Volatility
Average true range roughly 631 points on the 14-day and 591 on the 9-day, near 2 percent, with average daily range close behind at 579 and 570, so a rough 580 to 630 point band applies; the volatility-of-volatility measure sits near 95.6. Historic volatility near 19 to 21 percent on the 14 and 20-day windows. The proxy carries an options-implied daily move of about 10.71 dollars, near 1.5 percent, and an implied-volatility rank near 62 percent, elevated. A one-day band on the 29,181 settle implies about 28,880 downside to 29,520 upside, most-likely core 29,150 to 29,300.
Key levels
Resistance: 29,245 (38.2 percent retracement), 29,300 (target and weak prior high), 29,365 (first pivot), 29,422 (one-SD), the 29,548 to 29,568 shelf (second pivot, 20-day and the proxy's 715-strike volatility inflection near 29,530), 29,601 (18-day), 29,755 (third pivot), 29,841 to 29,903 (50 and 40-day), 30,599 (one-month high), 31,100 (record). Support: the 29,158 pivot, 29,022 low, 28,974 (first support pivot), 28,940 (one-SD, prior-day low), 28,840 (two-SD), the 28,674 to 28,817 base, 28,516 (deep extension), 28,408 (one-month low).
Options flow and dealer positioning
Dealer levels are read through the Nasdaq exchange-traded proxy, which closed near 705.50 against a 708.95 prior close, sitting in negative gamma: a call-gamma reading near negative 163.5 million and a put-gamma reading near negative 1.54 billion, so dealers hedge with price and amplify intraday moves. The volatility inflection near a 715 strike maps to roughly 29,530. Put-to-call open interest sits at 1.38 with put volume outpacing calls. On the broad market, real-time hedging flow swung from positive 3 billion to negative 8 billion in delta, an implied 11 billion of dealer selling, from longer-dated put buying and short-dated call selling, absorbed by a positive-gamma S&P. The desk (July 22 5:45 PM ET) is risk-off below the S&P 7,480 inflection and buying short-dated out-of-the-money index puts; Alphabet near a 5 percent implied move with a 320 put base, Tesla near a 5 percent move with a 350 put base.
Macro drivers
Inflation cooled: consumer prices 3.5 percent year-on-year against a 3.8 percent forecast, producer prices 5.5 percent against 6.2 percent, disinflationary and friendly to long-duration growth, though a Fed governor kept a hawkish tail alive. Ten-year yields firmed and the dollar index sat near 101.1. Earnings after the close: Alphabet beat but fell about 4 percent on a lifted 195 to 205 billion 2026 capex guide (with a disclosure that its models process 22 billion interface tokens per minute), Tesla fell about 3 percent on a Q2 miss, ServiceNow rose about 5 percent, Texas Instruments beat and guided higher; roughly 88 percent of the first wave of S&P reporters beat. Geopolitics: a warning of a US response to any Iranian strike on Hormuz shipping kept crude bid, West Texas near 88.73 (up about 2 percent). Intel reports Thursday after the close, T-Mobile before the open.
Setup and paths
Primary long from support: entry 29,020 to 29,160 on a hold of the 29,158 pivot or a reclaim after a flush into 28,974, stop on a sustained loss of 28,930, T1 29,300, T2 29,365 to 29,422, T3 29,548 to 29,568; about 1:1.6, 1:2.6 and 1:3.6. Alternate short fade: 29,540 to 29,570 into the ceiling with a stall and a net-sell composite, stop above 29,610, back to 29,365 then 29,245. Paths: A base case about 45 percent (hold the pivot base, rotate 29,300 to 29,365, fade into the Intel close), B about 30 percent (pivot fails, 28,674 to 28,817 base tested), C about 25 percent (reclaim 29,365, challenge 29,548 to 29,568). No entries before 09:45 ET (standing session rule); half size given the negative-gamma environment and the Intel report.
Calendar
08:15 ET European central-bank rate decision and statement, with the press conference at 08:45 ET; 08:30 ET US initial jobless claims (near 210,500 versus 208,000 prior) and Canadian retail sales; 10:00 ET eurozone consumer confidence; 13:00 ET US 10-year inflation-protected auction. Earnings: T-Mobile before the open, Intel after the close (both Nasdaq names), with Thermo Fisher, Lockheed Martin and RTX in the morning. The larger single-event risk of the week is the Federal Reserve decision on July 29 alongside Meta and Microsoft earnings.
AlgoIndex publishes institutional-grade reviews on ES, NQ, GC, and CL, built on professional-grade market data and our own analysis, priced for individual traders.