
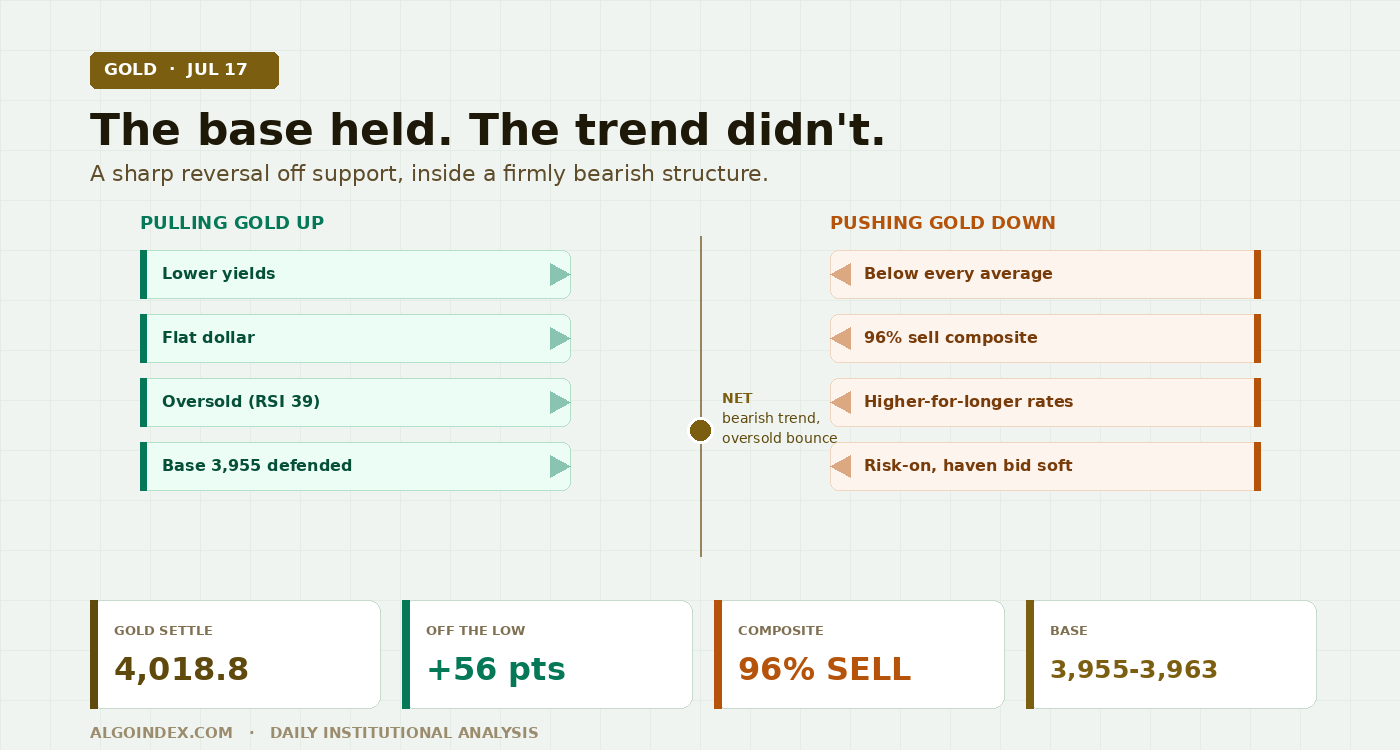
Gold settled Friday at 4,018.8, up 0.67 percent, but the number hides the story. Price gapped down to 3,980.1, flushed to 3,963.0, then reversed hard, recovering roughly 56 points to a 4,028.9 high before easing into the close, back above the prior close and the daily pivot. Buyers stepped in exactly where the market has repeatedly based over the past month, the 3,955 to 3,963 area. That reversal sits inside a firmly bearish daily structure: gold is below every major moving average, the composite reads a 96 percent sell, and the directional index is elevated. But short-term momentum is pressed near oversold. The cross-asset backdrop is genuinely two-sided, crude up 4 percent lifting inflation expectations against a flat dollar and lower yields. The plan: fade strength back into the 4,050 to 4,111 shelf, with a tactical long scalp on a hold of the 3,984 to 3,963 base. Neutral-to-cautiously-constructive short term, low conviction, against an intact bearish trend.
The daily chart and the intraday chart told opposite stories on Friday, and reconciling them is the whole task into Monday. The overnight leaned lower, setting up a gap-down cash open at 3,980.1 against the prior settle of 3,992.1. Sellers pressed to a session low of 3,963.0, a level that sits directly on the one-month and 13-week low of 3,955.4 and the first-standard-deviation support near 3,959.4. That confluence held, and from there the market reversed and worked steadily higher to 4,028.9 before settling at 4,018.8, a full-session recovery of about 56 points off the low on moderate volume of 110,455 contracts and open interest at 227,561.
Flat dollar (headwind removed)
Oversold momentum (RSI near 39)
The 3,955 to 3,963 base is defended
Inflation-hedge bid on the crude surge
96 percent sell composite, strong trend
Higher-for-longer rate path on crude inflation
Strong sentiment print leans dollar-supportive
Safe-haven premium subdued, risk-on tone
Net: an established bearish trend with an oversold bounce in progress. That is why the plan sells strength and only scalps the long off support.
The daily trend remains down, and the moving-average stack defines it: price is beneath the 5-day at 4,026.6, the 20-day at 4,091.6, the 50-day at 4,343.7, the 100-day at 4,612.1, the 200-day at 4,559.5 and the year-to-date mean at 4,696.5. Spot sits just under its 5-day, so the very first hurdle for any bounce is a daily close back above roughly 4,026, and everything above that is progressively harder. The one-month range has spanned a high near 4,350.2 and the 3,955.4 low, with today's close in the lower third. The five-day change of minus 2.43 percent confirms the near-term drift is still lower even after Friday's bounce, and the broader picture is a market that has given back a substantial portion of its prior advance, the 52-week high at 5,706.0 now nearly 30 percent overhead and the 52-week low at 3,441.5 roughly 17 percent below.
Momentum is bearish but stretched, which is the tension the reversal candle exploits. The 14-day relative strength sits near 39, below the neutral 50 line but not yet oversold, while short-window stochastics are low, the 9-day raw near 22 percent and the 14-day near 22.5 percent, both in the lower quartile and consistent with a market that has sold off enough to invite a mean-reversion bounce. The directional system confirms the trend is real: the 14-day directional index is elevated near 39.6 with the negative directional line near 26.8 dominating the positive near 9.3, the signature of an established downtrend, and the composite is a 96 percent sell. Friday's realized range of 65.9 points came in below the recent daily-range norm, so the session, despite its sharp reversal, was contained rather than expansive. Anchored on the settle with the roughly 99-point average daily range, a one-range envelope for Monday spans approximately 3,920 to 4,118.
"The 3,955 to 3,963 support base is the pivot that separates a stabilizing, dampened environment above from an amplified, fragile environment below."
Crude did the driving, both ways
The dominant driver was cross-asset, not gold-specific. Crude oil surged roughly 4 percent, lifting near-term inflation expectations, while the dollar index finished little changed and Treasury note yields drifted lower. That combination is genuinely two-sided: softer yields and a flat dollar lower the opportunity cost of holding a non-yielding asset and support gold, but a crude-led rebuild in inflation expectations that pushes back the timeline for policy easing works the other way. The University of Michigan preliminary sentiment reading jumped to 54.4 from a prior 51 against a forecast near 49.5, a notable beat, while the five-year inflation expectation held at 3.3 percent; the stronger sentiment leans mildly dollar-supportive and gold-negative. Other data was constructive for the economy and neutral for gold: housing starts at 1.427 million above the prior 1.31 million, import prices up 0.3 percent on the month, industrial production up 0.1 percent. Equities were soft, the broad index down roughly 1 percent and the technology index off about 1.5 percent, with the volatility index near 18.7, a mixed backdrop that on balance let the metal lean on its base and recover.
There were no fresh official-sector headlines and no acute geopolitical escalation on the session; the structural central-bank bid remains a slow-moving background support rather than an active catalyst, and the safe-haven premium is currently subdued, consistent with the risk-on tone in the sentiment print. Weekend headline risk is the relevant unknown, and a geopolitical surprise over the weekend is the most likely source of a Monday gap. Options positioning in the gold exchange-traded fund proxy skews defensive: put volume of roughly 210.7 thousand against call volume of 74.4 thousand, a put-to-call open-interest ratio near 0.64, one-month implied volatility near 24.4 percent against realized near 23.1 percent, and an implied-volatility rank near 37 percent, a moderate reading consistent with a market under pressure but not in outright panic.
Read through that proxy, the fund traded near 368.64 dollars, up 0.99 percent from a prior close of 365.01. Its high-volatility inflection sits near 360 and its low-volatility inflection near 399, placing current price between the two and above the lower trigger. Dealer gamma shows heavily negative put gamma near negative 871 million against smaller negative call gamma near negative 84 million, an environment in which hedging amplifies moves lower once price slips beneath the high-volatility inflection. Translated into the futures at the prevailing proxy ratio near 10.9, the 360 inflection maps to gold in the low 3,900s and the 399 inflection to the mid-4,300s, a wide band bracketing Friday's support and the deeper resistance shelf. It is a directional positioning guide, not a precise level source, but it reinforces that the 3,955 to 3,963 base is the line separating a dampened environment above from an amplified one below.
The trade: fade the shelf, scalp the base
With the daily trend firmly down, the primary trade is a with-trend fade of the counter-trend bounce into resistance. The first resistance is the 5-day average and first-standard-deviation band at 4,024.8, then the session high at 4,028.9, the second and third standard-deviation bands at 4,038.4 and 4,048.8, and the first meaningful pivot resistance at 4,051.5. The heavier shelf begins at the second pivot resistance of 4,111.0, reinforced by a stochastic-based inflection near 4,137.5 and the third pivot resistance at 4,150.0. Beneath price, the daily pivot at 4,012.5 is the immediate line in the sand, then the target-price reading at 3,984.0 and the prior close at 3,992.1, into the primary support base at 3,963.0, 3,959.4 and 3,955.4 stacked within a few points, the single most important area on the chart, with the first pivot support at 3,953.0 just beneath.
The alternate is the higher-probability long, but it is counter-trend and must be managed tightly: a scalp on a hold and reclaim of the 3,984 to 3,963 support base, entry 3,985 to 3,995 on confirmation the base is holding, stop below 3,950, targets 4,012 then 4,038 then 4,050, taking partials into the pivot. The macro override cuts against the short: a materially softer dollar or a further leg lower in yields can carry gold through resistance, so stand aside on a strong directional macro impulse against the position. Stand aside too if price opens directly at the 4,012 pivot and chops with no opening-range direction, if it opens inside the 3,990 to 4,024 pocket without a clear rejection or reclaim, or if a weekend macro gap places price beyond the entry zones. No entries before 09:45 or after 16:00 Eastern.
Expected range: low band 3,935 to 3,955, mid 3,990 to 4,030 around the pivot and 5-day, high band 4,050 to 4,110.
The base held again and the bounce is real, but the trend is still down. Sell the rally into resistance and only scalp the long off support.
The complete data picture
Every level and reading from the Friday evening GC review. Prices are COMEX gold front-month (August) futures unless a proxy construct is named. Nothing rounded away.
| Resistance (bottom to top) | Support (top to bottom) |
|---|---|
| 4,024.8 5-day average and one-SD band; 4,028.9 session high and minor supply | 4,012.5 daily central pivot (holds Friday's reversal) |
| 4,038.4 two-SD band; 4,048.8 three-SD band; 4,051.5 first pivot resistance and moving-average reclaim zone | 3,992.1 prior close; 3,984.0 target-price reading |
| 4,091.6 20-day average; 4,111.0 second pivot resistance (the heavier shelf); 4,137.5 stochastic inflection | 3,963.0 session low, 3,959.4 one-SD support, 3,955.4 one-month and 13-week low (the base); 3,953.0 first pivot support |
| 4,150.0 third pivot resistance; 4,343.7 50-day average; 4,350.2 one-month high | 3,945.8 two-SD support; 3,935.4 three-SD support; 3,914.0 second pivot support |
| 4,559.5 200-day; 4,612.1 100-day; 4,696.5 year-to-date; 5,706.0 52-week high (nearly 30 percent overhead) | 3,854.5 third pivot support; 3,441.5 52-week low (about 17 percent below) |
The base held again and the bounce is real. But the trend is still down, so sell the rally, scalp the low.
See how AlgoIndex turns trend and positioning into systematic signals. Read today's Nasdaq note and Wednesday's gold note.
View pricing


