
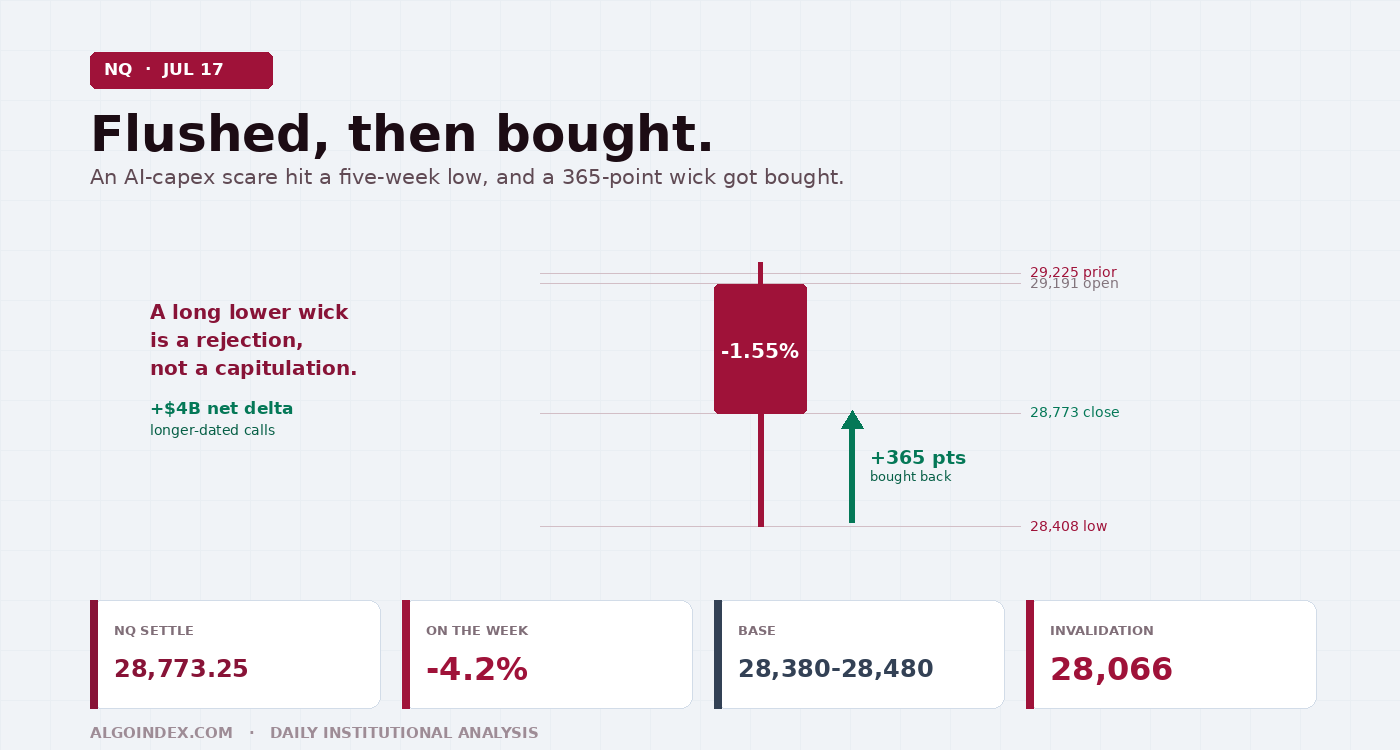
The Nasdaq-100 E-mini settled Friday at 28,773.25, down 452.50 points or 1.55 percent, a five-week closing low that capped a 4.2 percent weekly decline. The cause was a global rout in semiconductor and artificial-intelligence names after a Chinese startup unveiled a model claimed to rival the strongest Western systems, reigniting the fear that the multi-year AI capital-spending boom has stretched valuations too far. But the day was not a one-way collapse: the contract flushed to 28,408 and then recovered roughly 365 points into the close, and options-derived flow showed the Nasdaq attracting more than 4 billion dollars of net positive delta led by longer-dated call buying, dip-buying, not fleeing. The plan: a long from the 28,380 to 28,480 support base toward the 29,000 to 29,225 shelf, hard invalidation beneath 28,066. Cautiously constructive on a hold of support, neutral-to-bearish on a loss.
The shape of the day matters more than its color. NQ opened at 29,191.00, a touch below Thursday's 29,225.75 settle, and immediately came under pressure as an Asian technology selloff bled into US futures. The decline carried to 28,408.25 by midday, a genuine flush, and then dip-buying and an end-of-week short-cover bid lifted the contract 365 points off that low to settle at 28,773.25, well off the worst levels but still decisively red. Volume of 619,549 contracts confirmed heavy participation, while open interest of 290,695 held steady, the signature of position rotation rather than wholesale liquidation.
A long lower wick is a rejection, not a capitulation. Institutions leaned into the weakness as a dip rather than fleeing it.
Short-term structure has turned bearish, and there is no arguing that. Price sits below the 5-day at 29,391.65, the 20-day at 29,780.07 and the 50-day at 29,858.87, the multi-indicator composite reads 48 percent sell with every short-term study bearish, and the directional index has negative direction firmly in control. But the longer-term uptrend remains structurally intact: price holds well above the rising 100-day at 27,779.21 and 200-day at 26,869.71, the contract is still 24 percent above its 52-week low, and weighted alpha is a positive plus 18.88. This is a pullback within an uptrend, not a structural top. The prior 52-week high at 31,100.00 sits 7.5 percent above the market; the 52-week low at 23,170.50 is 24.2 percent below.
Deteriorating momentum, constructive undercurrents
The central contradiction into Monday is between deteriorating short-term momentum and a set of constructive undercurrents. The four-hour view shows a clear sequence of lower highs and lower lows over the past week, the signature of a controlled distribution rather than a panic, framing supply near 29,190 to 29,225 and demand at 28,408. The relative strength reads 41.18 on the 14-day and 35.95 on the 9-day, weak but holding above the oversold 30 threshold, with stochastic percent-K depressed at 27.24 and 34.70, leaving room for either a wash-out lower or a snap-back. The directional index tells the clearest story: on the 9-day, negative direction at 31.05 dominates positive at 11.70 with an average directional index of 23.07, a genuinely trending down-move on the short horizon. Only the 20-to-100-day average crossover still registers a buy.
Against that momentum stand three constructive tells. The recovery off the session lows is the first. The second is the options-derived hedging flow, which showed the Nasdaq attracting more than 4 billion dollars of net positive delta led by longer-dated call buying, read as genuine dip-buying interest, standing in contrast to the broader index where hedging flow finished modestly negative on balanced two-way activity. The third is positioning: data as of July 14 shows dealers and intermediaries net short but actively covering, short exposure cut by more than ten thousand contracts while long exposure grew by nine thousand, with asset managers still heavily net long and trimming only modestly. Dealers covering into weakness and asset managers holding longs is consistent with dip-buying, not a coordinated exit.
Layered on top is an elevated-volatility environment. Average true range expanded with the selloff, the 14-day at 707.09 points, 2.46 percent, and historic volatility jumped to 23.27 percent from 19.48 percent on the 9-day. Read through the Nasdaq-tracking exchange-traded fund proxy, the futures having no liquid listed-options complex of their own, the proxy settled near 695.50 against a prior close near 706.02, a decline of about 1.5 percent that mirrors the futures. Estimated net gamma notional stands at negative 472 million, placing dealers in negative gamma where hedging amplifies rather than damps directional moves. Put-side gamma dominates at negative 1.3 billion against call-side at negative 210 million, with a high-volatility inflection near 734 well above the market, where dealer stability would only improve on a move back toward it. Using the 14-day range around the settle frames a wide one-session band of roughly 28,065 to 29,480 for Monday.
"The selloff began in Asia, but the spending narrative is contested rather than broken: large cloud-compute leasing and defense-AI contracts cut the other way."
One model reprices the whole AI trade
The dominant driver is a sentiment shift around AI spending. The selloff began in Asia, where China's Shanghai Composite fell 3 percent and Japan's Nikkei dropped 4 percent after a Chinese startup launched a model it claims rivals the strongest Western systems, sparking concern that the industry's enormous capital-expenditure commitments may not be justified. That fear translated directly into the US semiconductor space, down more than 2 percent as measured by the sector fund, and by extension into the Nasdaq-100, which is disproportionately weighted toward the AI-infrastructure trade. Countervailing headlines, including reports of large cloud-compute leasing and defense-AI contracts among megacap and private players, suggest the spending narrative is contested rather than broken. Until the numbers arrive, the megacaps remain hostage to the valuation debate rather than company-specific news.
Geopolitics added a risk-off undertone. Reports indicated the United States is moving additional refueling aircraft toward Israel ahead of possible escalation, and separate sourcing suggested Iran has told Yemen's Houthis to close a key Red Sea gateway if US strikes hit its power network. Neither is a scheduled event, but both keep an energy-and-safety premium in the background that can flare without warning and would pressure high-beta technology first. The volatility complex woke up in response: the equity volatility index closed at 18.76, up more than 12 percent, and the volatility-of-volatility gauge rose nearly 8 percent to 104.87. Broad indices fell in tandem, the S&P 500 down 1.01 percent to a one-week low and the Dow off 0.77 percent, a market-wide risk reduction led by, but not confined to, technology. The macro calendar is quiet: Monday July 20 carries no high-impact US release, only Canada's inflation rate at a 3.2 percent forecast, so price action and the follow-through of the AI selloff set the tone. The consequential calendar risk is midweek: two of the largest index constituents report after a volatility-expiration event on Wednesday July 22, with a major central-bank decision Thursday July 23.
The trade: long the base, play the mean reversion
The confluence support base is the pivot of the whole plan. It runs 28,380 to 28,480, defined by Friday's low and one-month low at 28,408.25, the first pivot support at 28,381.00, the one-standard-deviation support at 28,364.94 and a computed downside target near 28,482.81, with the pivot point just overhead at 28,800.50. A hold and reclaim there, with the constructive dip-buying flow as tailwind, plays for a mean-reversion recovery toward the 29,000 to 29,225 supply shelf. A break below the base opens the two-standard-deviation support at 28,195.82, then the decisive band at 28,066 to 28,071 where the three-standard-deviation support and the 61.8 percent retracement of the 52-week rally overlap. Losing 28,066 shifts the structure outright bearish toward 27,988.75 and 27,569.25.
Target 1 at 28,800 is the pivot point, Target 2 at 29,000 a round-number magnet, Target 3 at 29,190 to 29,225 the first pivot resistance and prior-settle supply shelf. The alternate is the mirror trade for a weak open: short the 29,190 to 29,225 supply shelf on a failed rally and clear rejection, targeting 28,800 then a retest of 28,480, stop above 29,300, taken only if the market opens weak, rallies into resistance and rejects. Skip if the market opens mid-range near 28,700 to 28,800 and chops without testing either the base or the shelf, or if a large gap places price beyond the defined entry zones at the decision point.
Expected range: low 28,065, mid 28,750 to 29,000, high 29,480. The negative-gamma environment produces sharp swings around the resolution.
The AI trade got repriced in a single session, but the flush got bought. Monday is about whether 28,380 holds long enough for the dip-buyers to be right.
The complete data picture
Every level and reading from the Friday evening NQ review. Levels are September E-mini futures prices unless a fund-proxy construct is named. Nothing rounded away.
| Resistance (bottom to top) | Support (top to bottom) |
|---|---|
| 28,800.50 pivot point (immediate overhead) | 28,482.81 computed downside target; the 28,380 to 28,480 confluence base |
| 29,190 to 29,225: Friday's open, first pivot resistance 29,192.75, prior settle 29,225.75 | 28,408.25 Friday's low and one-month low; 28,381.00 first pivot support; 28,364.94 one-SD support |
| 29,391.65 5-day average; 29,549.50 reclaimed 9-day; 29,612.25 second pivot resistance; 29,680.13 18-day | 28,195.82 two-SD support |
| 29,780.07 20-day (descending overhead); 29,858.87 50-day; 29,971.32 40-day; 30,004.50 third pivot resistance | 28,066 to 28,071: three-SD support and the 61.8 percent retracement of the 52-week rally, the decisive shelf |
| 31,100.00 prior 52-week high (7.5 percent above) | 27,988.75 second pivot support; 27,569.25 third pivot support; 23,170.50 52-week low (24.2 percent below) |
A five-week low on an AI-capex scare, and a 365-point wick that got bought. The base at 28,380 is the whole story now.
See how AlgoIndex turns positioning and hedging flow into systematic signals. Read today's S&P 500 note and the pillar on how dealer call and put walls behave.
View pricing


