
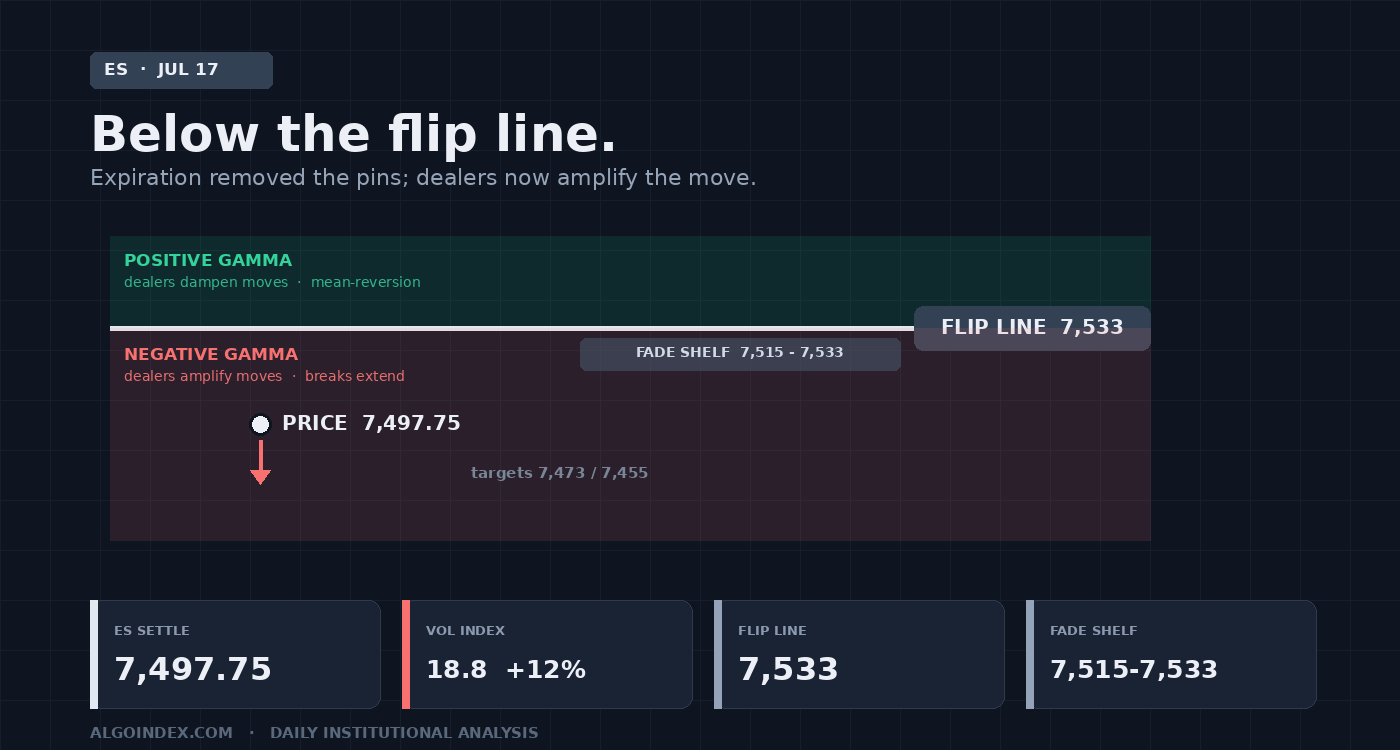
The S&P 500 E-mini settled Friday at 7,497.75, down 80.00 points or 1.06 percent, closing July options expiration with a broad, tech-led decline. A crowded semiconductor group led the market lower, the volatility index jumped roughly 12 percent to near 18.8, and, most important for Monday, the contract closed beneath its dealer gamma flip level. That puts dealers in negative gamma, where their hedging amplifies moves rather than damping them, and it lands right as expiration frees up positioning. The longer-term uptrend is still intact well above the 100 and 200-day averages, and longer-dated tech call buying reads as dip-buying, so this is cautiously bearish-to-two-sided rather than one-way lower. The plan: fade failed rallies into the 7,515 to 7,533 shelf toward 7,473 and 7,455, with an alternate long only on a confirmed reclaim of the 7,533 flip line.
One line decides Monday's character, and price closed on the wrong side of it. The dealer gamma flip level sits at 7,533.5 in E-mini terms. Above it, dealer hedging leans against the move and dampens it. Below it, hedging runs with the move and amplifies it. Friday's settle at 7,497.75 is roughly 36 points beneath that line, which means the market opens the post-expiration week in the part of the map where a break tends to extend rather than mean-revert, and where light overnight liquidity can produce outsized swings.
Reclaiming 7,533 neutralizes the condition and shifts the market back to two-sided. Until then, the path of least resistance leans lower.
Friday's regular session was a persistent, orderly distribution. ES gapped modestly lower from Thursday's 7,577.75 close, opened at 7,572.75, and put in its session high of 7,575.00 almost immediately before sellers took control. The decline was methodical rather than a single shock, working from the high down to a 7,473.00 low across a full 102-point traverse that exceeded the 14-day average daily range of roughly 84 points. The settle at 7,497.75 sits in the lower third of the day's range, a bearish internal, and the 18:00 Globex reopen near 7,494 to 7,498 confirmed the weak close with no reversal impulse.
A short-term pullback inside a longer advance
The structural contradiction into Monday is the tension between a bearish price close and a still-intact longer-term uptrend. The contract remains inside a broad multi-month advance but has rolled over from the upper boundary: the one-month high sits at 7,632.00 and the 13-week and 52-week highs are jointly pinned at 7,693.75, only about 2.6 percent overhead, while the one-month low is 7,357.25. Friday's close places price in the lower-middle of the one-month range after two failed attempts this week to press the highs, and the five-day change of minus 122.50 points, minus 1.61 percent, confirms a corrective week that unwound the prior push.
The moving-average stack has turned into a short-term headwind. Against the settle, price is below the 5-day at 7,568.90, the 20-day at 7,532.40 and the 50-day at 7,532.73. The 20-day and 50-day are compressed together near 7,532, forming a dense overhead battle zone roughly 35 points above the settle, and reclaiming that shelf is the single most important technical task for the bulls. Longer term the picture holds: price sits well above the 100-day at 7,229.86 and the 200-day at 7,109.58, with the year-to-date average at 7,180.52, keeping the primary trend intact. This is a short-term pullback inside a longer-term advance, not a completed reversal.
The four-hour structure has shifted from higher highs to a lower-high, lower-close sequence, a change of near-term character to the downside. The most recent four-hour candle printed 7,511.00 open, 7,516.75 high, 7,484.00 low and 7,494.75 close, an inside-to-lower bar keeping the immediate momentum pointed down. Oscillators reflect the same softening without a washed-out extreme: the 9-day raw stochastic has slipped to 17.89 percent, oversold on the short horizon, while the 14-day raw stochastic sits mid-range at 42.63 percent, and the 14-day relative strength reads 47.06, down 6.56 points, just under the neutral 50 line. Trend strength is low, the 14-day directional index at 15.90 beneath the 20 threshold, but the components lean bearish, the negative direction indicator at 22.69 well above the positive at 13.50. Realized volatility has ticked up, with the 14-day average true range at 92.21 points and Friday's 102-point range running above it, an expanded-range distribution day.
"The ingredients for a sharp corrective spasm are present, and only a trigger, whether geopolitical, macro-data, or an earnings miss, is required to activate it."
A leadership unwind, not a growth scare
The market's leadership problem is the central story. Friday's decline was concentrated in semiconductors, with the broad chip complex off more than 2 percent, as investors rotated out of the most crowded and expensive names, the underlying concern shifting toward whether hyperscaler spending translates into durable returns and sustained chip demand. The weakness was global, with Asian equity markets under pressure and Taiwanese shares slipping into correction territory. Regions with lower technology weighting, such as European indices, held up materially better, which underscores that this was a leadership-group unwind rather than a broad economic-growth scare. Defensive rotation was visible in the bid for Treasuries and the bounce in gold.
The rates backdrop is a modest, mixed tailwind. Treasuries rallied as the equity selloff pushed money toward safety, dragging yields lower across the curve, and markets pared back expectations for further Fed tightening this year. But survey-based inflation expectations stayed elevated, with the University of Michigan one-year reading near 4.5 percent, which keeps the policy path uncertain and prevents rate relief from fully offsetting the growth-and-valuation concerns weighing on technology. Renewed attacks and counterstrikes in the Middle East added a second layer of risk aversion, with crude holding near 85 dollars on the Brent benchmark and markets alert to the risk that a worsening confrontation disrupts tanker traffic through the Strait of Hormuz, a live, headline-sensitive overhang that can inject volatility independent of the earnings narrative.
Positioning paints a nuanced picture beneath the bearish surface, and it is the reason this is two-sided rather than one-way lower. Aggregate real-time hedging flow for the S&P finished near minus 1.6 billion in delta-notional terms, the net of roughly 2.0 billion of put buying against 1.4 billion of call buying. S&P single-stock flow was light and dominated by same-day expirations, while the Nasdaq complex saw a more constructive plus 4.3 billion in net delta notional, most of it longer-dated call buying that suggests institutional dip-buying interest into the technology weakness. The offsetting read is the dealer gamma reading, negative at roughly minus 0.37 for the cash index, which means dealers hedge in the direction of price and amplify moves in both directions, a setup that historically follows monthly expiration and argues for wider ranges. The put-to-call open-interest ratio near 1.29, with put volume exceeding call volume, confirms the defensive posture. That read comes from the post-close desk options-positioning note dated Friday, July 17 at 5:21 PM ET.
The trade: fade the shelf, respect the flip
The overhead structure is dense and well-defined, which is why failed rallies are the higher-probability trade until the shelf breaks. The first line is the daily pivot at 7,515.25, immediately followed by the 38.2 percent retracement at 7,527.05. The critical zone is 7,532 to 7,534, where the 20-day and 50-day averages group with the dealer gamma flip level at 7,533.5; a reclaim of that shelf neutralizes the negative-gamma condition and shifts the market back to two-sided. Support is thinner beneath the settle, which is what gives the downside its air pocket: the 50 percent retracement sits right at the settle at 7,494.63, then the four-hour swing low at 7,484.00, the computed target at 7,476.56 and the regular-session low at 7,473.00, the key line bulls must defend. Beneath it the market opens toward 7,462.20, the computed first support at 7,455.50 and the one-standard-deviation support at 7,453.66.
Target 1 at 7,484 is the four-hour swing low and computed target zone. Target 2 at 7,473 is the regular-session low, the line whose clean break opens the next leg. Target 3 at 7,455 is the computed first support and one-standard-deviation zone, above the secondary dealer support near 7,443. The alternate is the mirror image and plays a gamma flip back to positive: long on a confirmed reclaim of the 7,533 flip line that holds on a pullback retest, entry 7,533 to 7,536, stop below 7,515, targets 7,557 then the lower gamma wall at 7,563 and the volatility inflection level at 7,578. That setup aligns with the constructive longer-dated tech call buying. A Middle East escalation headline or a sharp overnight tech gap can override the technical setup in either direction, so reassess the opening range before committing, and skip if price chops directionlessly between 7,480 and 7,515 with no clean rejection or reclaim.
Expected range: low 7,455 to 7,443, mid 7,473 to 7,520, high 7,533 to 7,563. A break outside 7,443 or 7,563 signals a trend day and a volatility expansion consistent with the negative-gamma, post-expiration environment.
A leadership unwind closed the market below its flip line, right as expiration removed the pins. The trend still holds above, but Monday opens in the part of the map where moves travel further.
The complete data picture
Every level and reading from the Friday evening ES review. Levels are September E-mini futures prices, with cash-index equivalents noted where the review provides them. Nothing rounded away.
| Resistance (bottom to top) | Support (top to bottom) |
|---|---|
| 7,515.25 daily pivot; 7,527.05 the 38.2 percent retracement | 7,494.63 the 50 percent retracement (at the settle) |
| 7,532 to 7,534: 20-day and 50-day averages plus the dealer gamma flip level 7,533.5 (cash 7,490), the shelf that neutralizes negative gamma | 7,484.00 four-hour swing low; 7,476.56 computed target; 7,473.00 regular-session low, the key defense |
| 7,541.84 one-SD resistance; 7,543.5 primary gamma concentration strike (cash 7,500); 7,557.50 computed first resistance; 7,560.11 two-SD; 7,563.5 lower gamma wall (cash 7,520) | 7,462.20 the 38.2 percent retracement; 7,455.50 computed first support; 7,453.66 one-SD support |
| 7,568.90 5-day average; 7,574 to 7,575 three-SD and Friday's high; 7,577.75 to 7,578.5 prior close and volatility inflection level (cash 7,535) | 7,443 secondary dealer support (cash 7,400); 7,435 to 7,437 18-day average and two-SD; 7,413 to 7,421 three-SD and computed second support |
| 7,617.25 computed second resistance; 7,632.00 one-month high; 7,643.5 to 7,659.50 upper gamma wall and computed third resistance (cash 7,600); 7,693.75 52-week high | 7,353 to 7,357 one-month low and computed third support; 7,229.86 the 100-day, last major trend support; 7,109.58 the 200-day |
The uptrend still holds above. But the market closed below its flip line, and expiration just removed the pins.
See how AlgoIndex turns dealer positioning and hedging flow into systematic signals. Read Wednesday's ES note and the pillar on how dealer call and put walls behave.
View pricing


