
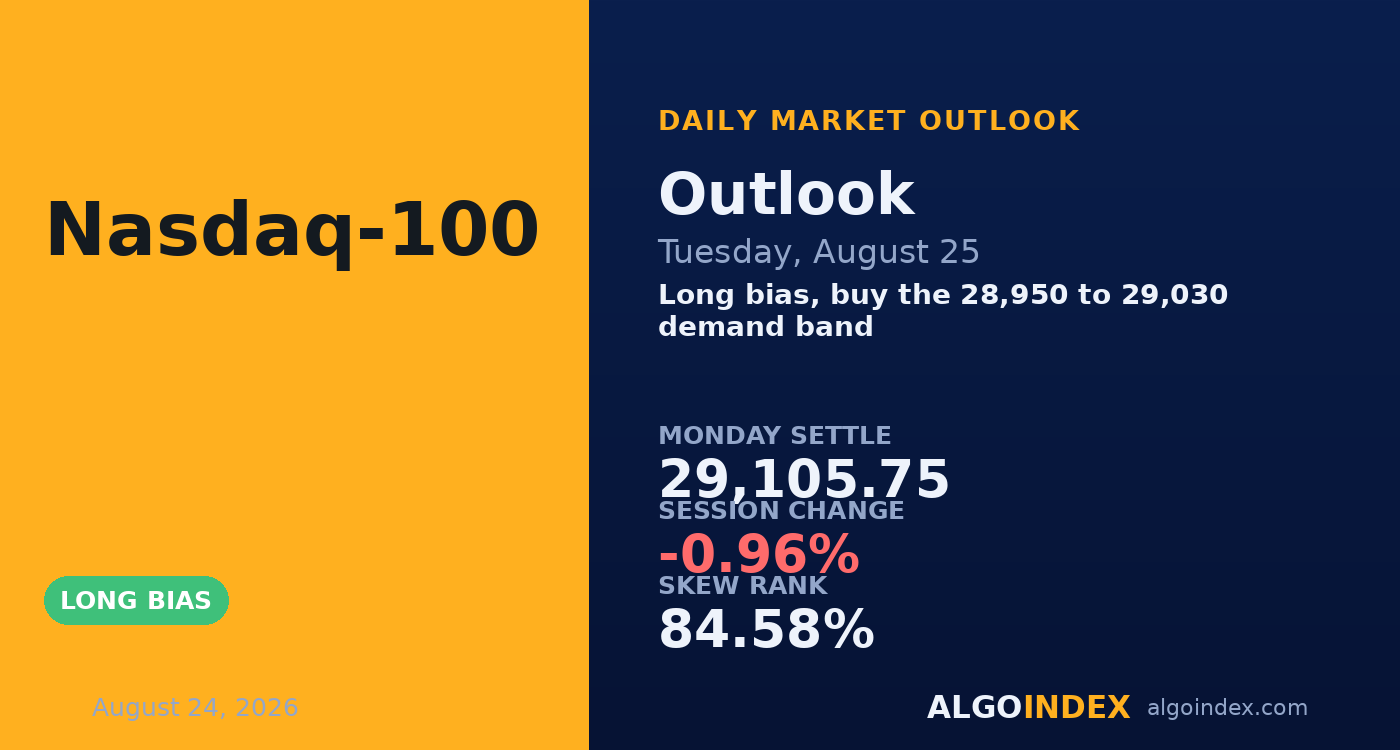
The September Nasdaq-100 settled Monday at 29,105.75, down 282.00 points, or 0.96 percent, and closed in the lower quarter of a 533.75-point range that ran from 29,480.50 down to 28,946.75. Here's the thing though: this wasn't a market selloff, it was a technology selloff. The broad benchmark gave up just 0.28 percent and the industrial average actually finished green. Memory and chip names did the damage, with the memory group off about 6 percent and the broad semiconductor complex about 3 percent, while money rotated into financials and staples. That's a rotation out of the AI infrastructure trade, not a general scramble for the exits.
The specifics matter here. The leading graphics-processor name fell about 3 percent and has now closed lower seven sessions running, its longest slide since 2022, and it walks into its own quarterly report Wednesday after the close carrying every bit of that damage. A late-Friday collapse in US-Canada trade talks piled on a second weight, producing a 50 percent tariff on roughly 20 billion dollars of goods. What's striking is that long yields fell 3 basis points and crude dropped more than 2 percent, both of which usually help long-duration tech, and the index sold off anyway. When a market ignores its own tailwinds, the weakness is coming from inside the sector.
Washed out up close, intact from a distance
The constructive read starts with where price stopped. Monday settled 8.18 points above the dealer gamma flip level at 29,098, the line that splits a dampening environment above from an amplifying one below, and it lifted 159 points off the session low into the bell, so responsive buyers showed up beneath 29,000 rather than letting it bleed out. The 9-day raw stochastic reads 11.39 percent, about as washed out as the short horizon gets, while the 20-day still holds near 61, and that split says recent rather than structural. Price sits above the 100-day by 213 points and the 200-day by more than 1,800, so nothing here has bruised the larger uptrend yet.
The catch sits directly overhead and in the mechanics. Price has lost the 5-day at 29,379, the 20-day at 29,307 and the 50-day at 29,505, so all three averages stack above as the first real work. And the options proxy carries negative gamma on both sides, about 103 million in notional, which means dealer hedging amplifies moves instead of pinning them: declines feed more selling and rallies feed more buying. That's exactly why Monday delivered a full average true range. Below the 29,098 flip, that same mechanism turns hostile, so the whole long thesis leans on holding that line.
Wednesday owns the week, not Tuesday
The calendar does the heavy lifting here. Tuesday's only first-order scheduled item is the 10:00 consumer confidence print at 90.2, with new home sales alongside it, and a second-tier data day into a knife-edge close usually drifts a market toward its mechanical reference points. Wednesday is the opposite animal, stacking the core inflation gauge at 08:30 and the quarter's most consequential chip earnings at 16:20 into one session. So Tuesday's job is small: hold the base and let positioning build. Above the settle, 29,151 and the 29,178 pivot are the first ceiling, then the tight 29,293 to 29,294 confluence where the one-standard-deviation line meets the volatility inflection level. Below, 29,098 is the trigger, and losing it opens 28,982 then Monday's 28,947 low.
Buy the base, cap into the pivot
The plan buys the 28,950 to 29,030 band on a pullback, leaning on the washed-out short-term readings and the responsive bid that already turned up beneath 29,000 rather than shorting into a light data day. The stop is 28,860, tucked under the whole demand shelf where the 28,875 pivot first support, the 28,893 100-day average and the 28,918 one-standard-deviation support all sit, so three references have to fail before it's wrong, about 130 points from the 28,990 entry midpoint. Targets run to the 29,178 pivot, then the 29,293 line where the one-SD resistance meets the volatility inflection level, then the 29,358 call-side ceiling only on an extension through the second target with real volume behind it. Size stays small, because this is entered a full session ahead of a Wednesday that can reprice the index by several percent. Two things override it outright: fresh weakness in the graphics-processor name during the cash session, an eighth straight down day beyond 3 percent, or a weak 13:00 two-year auction that lifts front-end yields. Positions come off before Wednesday's 08:30 inflation print and don't carry into the 16:20 earnings report. performance methodology sets out how we grade these calls.
A settle 8 points above the gamma flip, a stochastic washed out at 11 percent, and a 159-point lift off the low is a base worth buying at reduced size. The whole trade is patience: Tuesday holds the shelf, and Wednesday decides the week.
A washed-out short-term reading into a knife-edge close is a dip worth buying, sized small. The 28,875 to 28,918 shelf is the line that carries it, and Wednesday's inflation-plus-chip double bill is the event it's really waiting on.
This is the read our members get every session, before the bell, with the levels drawn and the setup defined. See how the same dealer-positioning work turns into systematic signals.
View pricingThe complete data picture
Every number behind Tuesday’s plan, charted first; the full numeric reference follows underneath.
Full numeric reference, every remaining figure from the review
| Average | Value | Settle vs |
|---|---|---|
| 5-day | 29,378.55 | below by 272.80 |
| 20-day | 29,306.72 | below by 200.97 |
| 50-day | 29,504.73 | below by 398.98 |
| 100-day | 28,892.72 | above by 213.03, the nearest support |
| 200-day | 27,278.47 | above by 1,827.28 |
| Level | Reference |
|---|---|
| 29,683 | primary gamma concentration strike, cash 29,600, the extended objective |
| 29,584 | secondary dealer-positioning strike, cash 29,500 |
| 29,480 | Monday session high, cash 29,397, first proof of a reclaim |
| 29,358 | primary call-side ceiling, cash 29,275, highest-value long objective |
| 29,294 | one-SD resistance and volatility inflection, cash 29,211, tightest upside confluence |
| 29,178 | pivot point, cash 29,095, minimum for a constructive Tuesday |
| 29,151 | 50 percent retracement of the 13-week span, cash 29,068, immediate ceiling |
| 29,106 | Monday settle, on the gamma-flip knife edge |
| 29,098 | dealer gamma flip level, cash 29,015, dampening above and amplifying below |
| 28,950 to 29,030 | primary demand band, the entry |
| 28,947 | Monday session low, cash 28,864, first line of defense |
| 28,875 to 28,918 | pivot first support, 100-day and one-SD support, the demand shelf, stop below |
| 28,772 | 50 percent retracement of the 4-week span, cash 28,689, next air pocket |
| 28,733 | primary put-side support base, cash 28,650 |
| Metric | Reading |
|---|---|
| Proxy fund last | 706.32, down 1.00 percent |
| Total gamma notional | negative 103.225 million, short gamma |
| Call gamma / put gamma | negative 861.13 million / negative 1.89 billion, both sides negative |
| Gamma flip boundary | 29,098 futures, settle 8.18 above |
| Volatility inflection | 29,293 futures |
| Primary call-side ceiling | 29,358 futures |
| Proxy put-to-call OI | 1.2, defensive tilt |
| Implied-vol rank | 29.10 percent proxy |
| Skew rank | 84.58 percent |
| Input | |
|---|---|
| 10-year yield | down 3 basis points to 4.70 percent, crude off more than 2 percent |
| Semiconductor complex | memory down about 6 percent, broad chips about 3 percent, the whole story |
| Rotation destination | financials up about 1 percent, staples about 2 percent, value over growth |
| Broad benchmark | down 0.28 percent, the industrial average up 0.26 percent, a tech-only problem |
| US-Canada trade | 50 percent tariff on about 20 billion of goods, retaliation set for September 8 |
| Graphics-processor name | down about 3 percent, seventh straight lower close, reports Wednesday 16:20 |
| Volatility of volatility | 88.64, up 3 percent, demand for optionality into the event stack |
| When | Event |
|---|---|
| Tue Aug 25 | consumer confidence 90.2 and new home sales 10:00, two-year auction 13:00, a positioning day |
| Wed Aug 26 | core PCE 3.3 percent 08:30, second-estimate GDP 1.5 percent, dominant chipmaker earnings 16:20 |
| Thu Aug 27 | jobless claims 208,000 08:30, central-bank symposium opens, seven-year auction 13:00 |
| Fri Aug 28 | final consumer sentiment 51 at 10:00, symposium continues |
The economic releases referenced above are published on the official government calendars below. Price levels are derived from standard technical and statistical methods, and the market read is AlgoIndex's own analysis. How we grade these calls is set out in our performance methodology.
- US Census Bureau, New Residential Construction (housing starts and building permits)
- US Bureau of Labor Statistics, Import and Export Price Indexes
- Federal Reserve, Industrial Production and Capacity Utilization (G.17)
- Federal Reserve, FOMC calendar and meeting minutes
- US Department of the Treasury, auction schedule and results
- AlgoIndex performance methodology



