
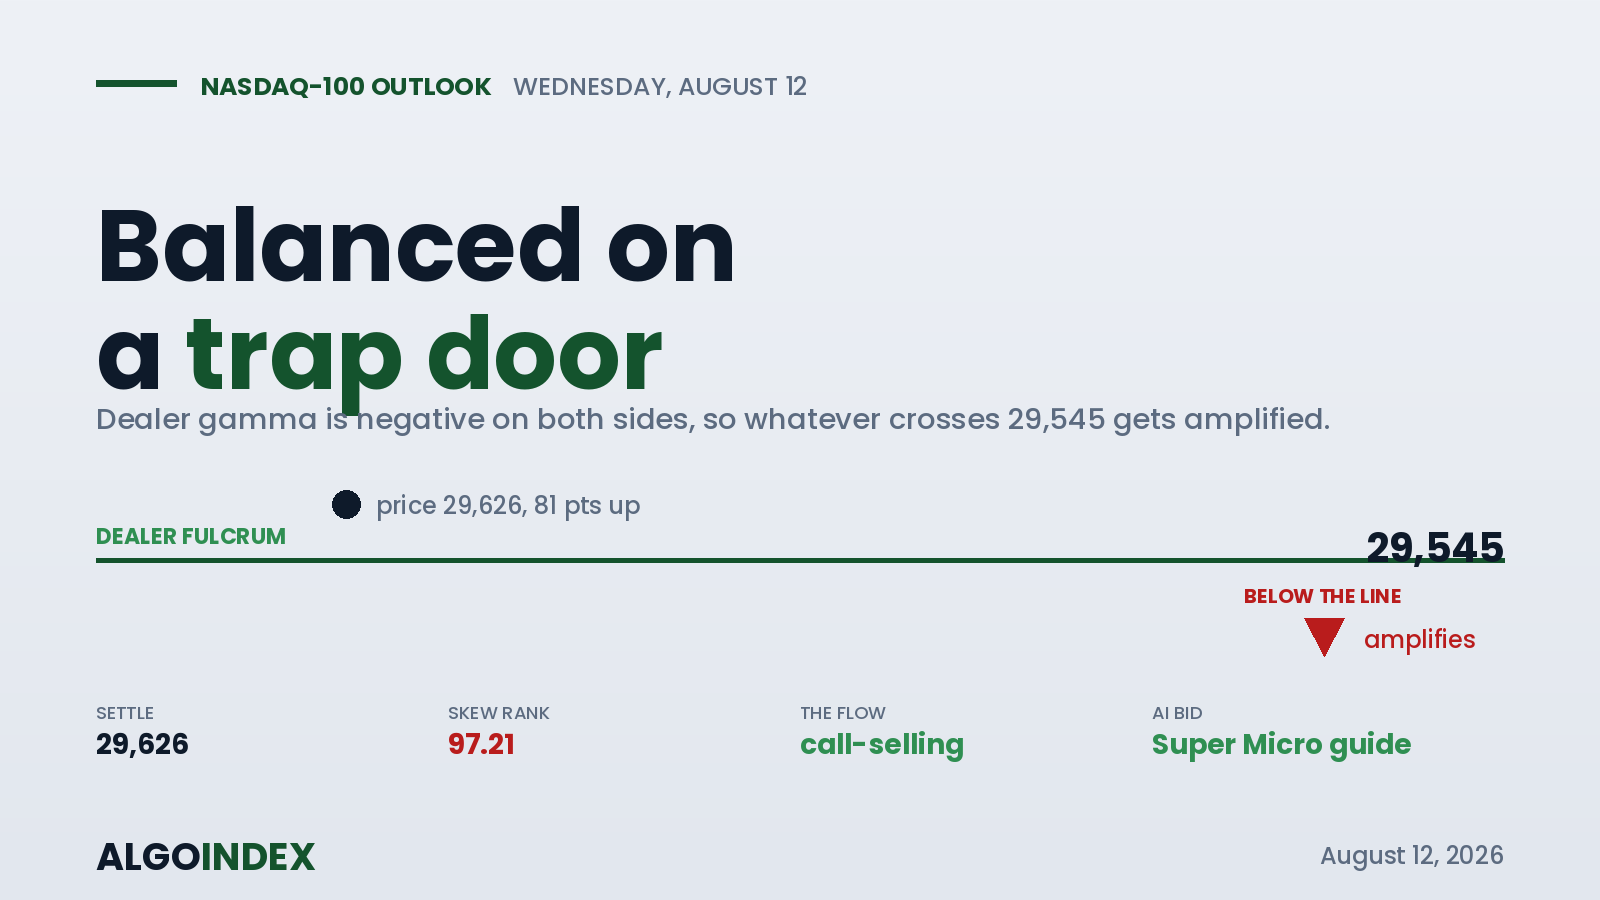
The Nasdaq-100 closed Tuesday sitting on a trap door. The September contract settled at 29,626.00, down about 98 points, and it did so parked directly on the one level that decides how violent tomorrow gets: the dealer hedging fulcrum at 29,545.
What makes that line dangerous is the gamma behind it. Total dealer positioning on the index proxy is negative on both sides of the book, calls and puts alike. Negative gamma means hedging flows move with price rather than against it, so once the fulcrum gives way in either direction, the move extends further and faster than the news justifies. The market closed 81 points above it. That is the whole setup into Wednesday's inflation print: a market balanced on a level that amplifies whatever crosses it, holding a great deal of insurance and very little outright short exposure, waiting for an 8:30 number to pick the direction.
This was mechanical, not a de-rating
The tell that Tuesday's decline was insurance rather than conviction is in the bond market. The 10-year yield reached a one-week high intraday and then reversed to close down two basis points, so bonds rallied while equities fell. For a long-duration index, a discount-rate repricing would have pulled yields the other way. This was hedging flow, not a change of view on the fundamentals. And the character of that flow matters: the Nasdaq's negative hedging was dominated by call selling, not put buying. Put buying is a bet the market falls. Call selling is upside monetization, and call sellers become forced buyers if price rallies through their strikes. The Nasdaq's flow was materially less bearish than the broad market's.
Soft in the middle, firming at the front
The intermediate structure here is genuinely weaker than the broad index, and it is worth being precise about. The 20-day average sits 600 points below the 50-day, a bearish crossover the composite flags as an outright sell, and negative direction leads positive on every window from 14 days out to 100. That is real, though much of it is a mathematical artifact of the July collapse still sitting inside the 20-day window, which will roll off over the next two weeks.
Against that soft backdrop, the very front has inflected up. On the 9-day window positive direction now leads, and trend strength accelerates from 7 on a 100-day basis to 24.56 on a 9-day. So the immediate momentum has turned while the intermediate structure stays soft, which is exactly the configuration that resolves violently when a scheduled catalyst forces the decision. The catalyst is Wednesday.
The AI bid that is not yet priced
The Nasdaq has its own catalyst independent of the inflation number. After the close, a major server and AI-infrastructure supplier guided next-quarter and full-year 2027 revenue roughly 25 percent above consensus, the strongest single AI-demand datapoint in weeks. For the second session running, the AI complex acted as the shock absorber for this index rather than its source of volatility. If the group opens firm on that guidance, it provides a bid that has nothing to do with the print, and the specific thing to watch at the open is Nasdaq strength against the broad market. That relationship confirms whether the AI bid is live.
Negative gamma on both sides of the book means the reaction to the number will be bigger than the number itself deserves.
Buy the fulcrum, respect the trap door
The plan buys a post-print retest of the 29,545 to 29,570 shelf that holds, because above that level dealer activity stabilises and the 50-day average sits right on it, giving a two-way confluence of positioning and trend. The stop sits below 29,470, beneath the four-way support at 29,477 to 29,500, and targets run to 29,645, then 29,725, then the 29,830 ceiling. A core inflation print of 0.4 percent or higher voids it outright, because negative gamma on both sides means a genuine surprise produces an unbounded move that no confluence holds against. Half size, no entries before 9:45. See how we track these setups in our performance methodology.
A market this heavily insured has already paid for the fall, which means the surprise, if there is one, is a rally nobody is hedged for.
This is the read our members get every session, before the bell, with the levels drawn and the setup defined. See how the same dealer-positioning work turns into systematic signals.
View pricingThe complete data picture
Every number behind Tuesday’s plan, charted first; the full numeric reference follows underneath.
Full numeric reference , every remaining figure from the review
| Average | Value | Spot vs |
|---|---|---|
| 5-day | 29,667.15 | -41.15 |
| 20-day | 28,949.00 | +677 (below 50-day: SELL) |
| 50-day | 29,549.34 | +76.66 |
| 100-day | 28,448.29 | +1,177.71 |
| 200-day | 27,157.49 | +2,468.51 |
| YTD | 27,473.39 | +2,152.61 |
| Proxy level | Futures equiv |
|---|---|
| Call ceiling 730 | about 30,010 |
| Vol inflection 721 | about 29,545 (spot) |
| Gamma flip 714 | about 29,110 |
| Primary put support 660 | about 29,105 |
| Concentration strike | about 29,005 |
| Gamma | negative both sides = amplifies |
| Metric | Reading |
|---|---|
| Real-time hedging delta | -3.5B, dominated by CALL SELLING |
| One-month implied / realized | 20.29% / 25.10% |
| Implied-vol rank / skew rank | 37.06% / 97.21% |
| Options-implied move | about 379 futures pts (1.28%) |
| Call gamma / put gamma | -354.31M / -1.04B |
| Put-to-call OI | 1.18 |
| 25-delta risk reversal | -0.037 (put bid) |
| Top gamma expiry | Aug 20 |
| Cohort | Net |
|---|---|
| Leveraged funds | short (fast money pressing) |
| Dealers | long (covered shorts) |
| Read | call-selling = upside monetization, not shorting |
| Skew | 97.21% (bought insurance) |
| Implication | insurance decays into a buy on a benign print |
| Open interest | 274,618 |
| Input | |
|---|---|
| Hormuz | adviser: strait stays shut |
| 10-year yield | 4.68%, -2 bps (bonds rallied) |
| NDX vs broad index | -0.33% (mechanical hedging, not de-rating) |
| Super Micro | after-close guide about 25% above consensus |
| AI news flow | cloud accelerator deploy, 1.1B startup raise |
| Volatility index | 15.27, -1% (fell on a down day) |
| When | Event |
|---|---|
| Wed 08:30 | US CPI 0.1% m/m, core 0.2% (the event) |
| Wed 10:30 | Crude inventories (API +9.07M) |
| Wed 13:00 | US 10-year note auction |
| Thu 08:30 | US PPI + claims + 2 Fed speakers |
| Fri 08:30 | US retail sales |
| Aug 20-21 | proxy gamma expiry + monthly OPEX |



