
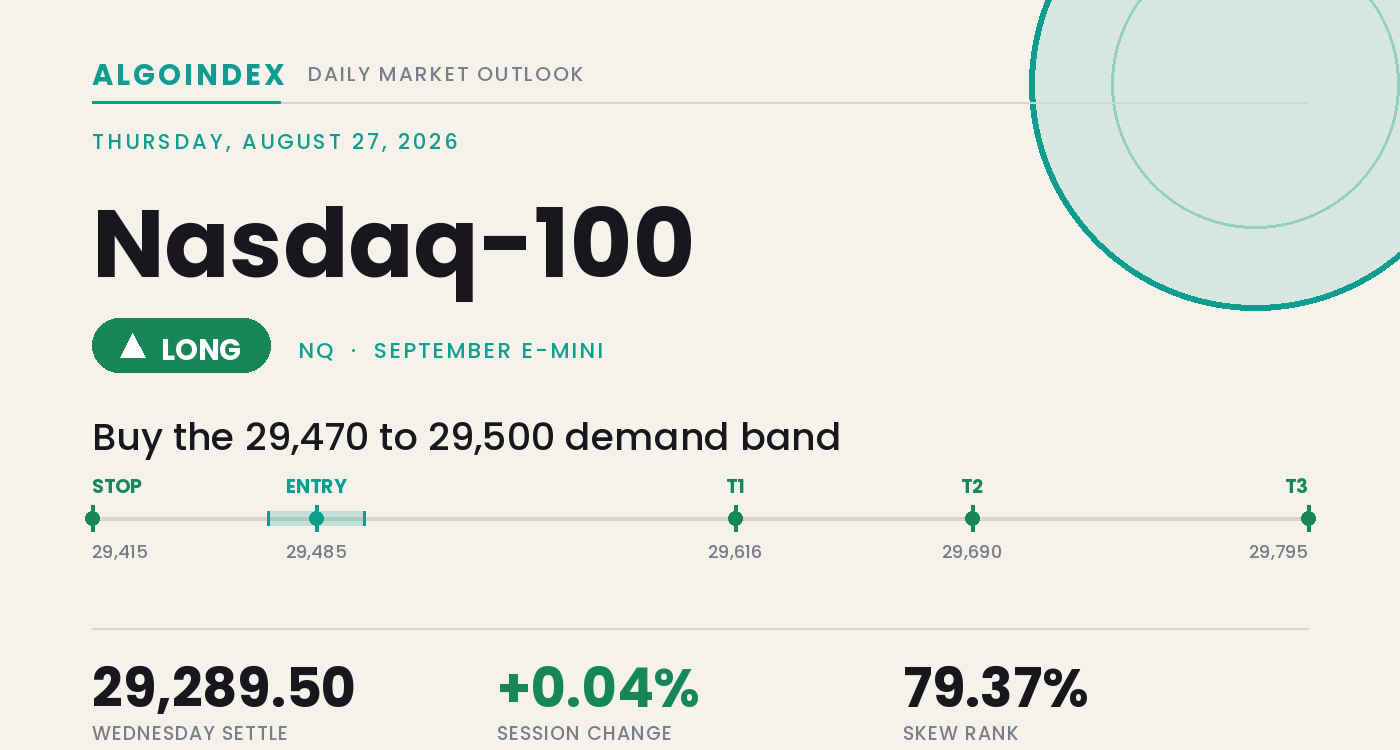
The September Nasdaq-100 settled Wednesday at 29,289.50, higher by just 12.75 points or 0.04 percent, a number that hides how little the regular session resolved. Price opened at 29,288.00, flushed to 29,096.00 after the 8:30 AM ET inflation data, recovered to 29,437.75, and closed within 13 points of where it began. The cash index finished marginally lower near 29,209, a measured basis of plus 80.50 points. The session's whole purpose was to wait. Two first-order events bracketed the day: the monthly personal-consumption price data before the bell and the largest chipmaker's quarterly report after the close. On a settlement basis the contract sat 182 points below its 20-day average and 170 below its 50-day, the profile of an index losing its intermediate footing. Then the earnings landed.
The report changed the picture entirely, and it did so after the closing bell. Revenue came in at 96.2 billion dollars against 92.38 billion expected, data-center revenue at 89.0 billion against 85.86 billion, and the shares rose roughly 4 percent in extended dealing. The Globex reopen carried the September contract 270.50 points off the settle to a high of 29,582.25, and at that price it trades 88 points above its 20-day average and 100 above its 50-day. One after-hours print reclaimed a moving-average band the regular session had spent all day beneath. The tension into Thursday is not direction so much as retention. The tightest structure on the board is the 12-point span between the 50-day at 29,459.68 and the 20-day at 29,471.84, a band the market fell through by day and vaulted back over at night. A session that cannot hold it converts the entire overnight advance into an unfilled gap pointing back at the settlement.
An overnight beat that reclaimed the band
The constructive case rests on the reclaim and on washed-out short-horizon momentum. The regular session recovered the entire post-data decline and settled above the daily pivot, and then the earnings beat lifted price back over the 20-day and 50-day averages in one move. Short-dated stochastics support a turn: the 9-day and 14-day percent-K both read near 19.86, close to oversold, while the 20-day near 64 keeps the wider structure intact. Price still holds nearly 300 points above the 100-day and almost 2,000 above the 200-day, so the primary uptrend is undented. This is a correction inside an advance, not a reversal of it, and depressed fast momentum inside a firmer slow read is the configuration that most often resolves upward once a catalyst supplies the push.
The problem is retention and the calendar. Until a regular session confirms the reclaim on a closing basis, the daily frame is still a market trading beneath its 20-day with an overnight excursion above it. Trend strength is absent: the 14-day directional index reads 16.37 and the 20-day 13.94, both under the 20 line, and the negative directional line leads the positive across every horizon. The multi-indicator composite returns a neutral hold with a bearish short-term direction. Layered on top is short dealer gamma in the options proxy, roughly negative 78 million notional with a 0.900 tilt, which means hedging flows amplify a move rather than pin it. A Thursday advance that gets going tends to extend, and so does a failure.
Thursday is a question of retention, decided at 1:00 PM ET
The board splits cleanly. Overhead, friction begins at the 29,582.25 overnight high and the converted 29,500 cash strike near 29,580, thickens at the 29,616 second pivot resistance where the 38.2 percent retracement sits, and runs to the 29,680 to 29,690 band where the five-day high and a mapped concentration overlap. Beneath, the 29,460 to 29,472 decision band is the pivot of the entire session. Weekly jobless claims arrive at 8:30 AM ET, an hour before the 9:30 AM ET cash open, with consensus at 208,000. The afternoon carries the weight: the seven-year note auction at 1:00 PM ET, prior stop 4.473 percent on a 2.490 bid-to-cover, is the most consequential scheduled item, because with thirty-year yields at their highest since 2007 a weak auction presses directly on the longest-duration index. A Federal Reserve official speaks twice, and the 12:55 PM to 1:10 PM ET window carries compounded event risk.
Buy the reclaimed band, respect the auction
The plan buys a controlled pullback into the reclaimed 29,470 to 29,500 band that holds and turns, leaning on the earnings reclaim and washed-out short-horizon stochastics rather than chasing the overnight high. The stop is 29,415, sited 45 points beneath the 50-day average so a marginal probe does not trigger the exit, about 70 points from the 29,485 entry midpoint. Targets run to 29,616 at the second pivot resistance and 38.2 percent retracement, then 29,690 at the five-day high and mapped concentration where the descending swing sequence ends, then 29,795 at the third pivot resistance only if momentum extends on expanding volume and the 1:00 PM ET auction clears well. The read voids in real time on two consecutive 30-minute closes beneath the 50-day at 29,459.68, which converts the overnight advance into a rejected gap and turns the bias toward the settlement at 29,289.50. A weak seven-year auction invalidates the long regardless of price, and positions should stand down across the 12:55 PM to 1:10 PM ET window. Size stays trimmed. Our published record lays out how we grade these calls.
One after-hours earnings beat reclaimed a moving-average band the regular session had spent all day beneath, so Thursday is a question of retention rather than direction. Constructive above the 29,460 to 29,472 band, capped into the 29,616 pivot, and the 1:00 PM ET seven-year auction is the referee.
A washed-out fast stochastic and an overnight reclaim of the average band make a pullback worth buying at reduced size. The edge is the reclaimed 29,470 to 29,500 band, the stop is 29,415, and the failure is two 30-minute closes back beneath the 50-day at 29,459.68.
This is the read our members get every session, before the bell, with the levels drawn and the setup defined. See how the same dealer-positioning work turns into systematic signals.
View pricingThe complete data picture
Every number behind Thursday’s plan, charted first; the full numeric reference follows underneath.
Full numeric reference, every remaining figure from the review
| Average | Value | Settle vs |
|---|---|---|
| 5-day | 29,272.05 | above by 17.45 |
| 20-day | 29,471.84 | below by 182.34, above by 88.16 on the overnight |
| 50-day | 29,459.68 | below by 170.18, above by 100.32 on the overnight |
| 100-day | 28,989.70 | above by 299.80, the nearest cushion |
| 200-day | 27,312.17 | above by 1,977.33 |
| Level | Reference |
|---|---|
| 30,343.00 | one-month high, cash 30,262.50, set Aug 17 |
| 30,080.50 | round-number concentration strike, cash 30,000 |
| 29,794.58 | third pivot resistance, cash 29,714.08, target 3 |
| 29,689.75 | five-day high, cash 29,609.25, the swing-sequence definer, target 2 confluence |
| 29,680.50 | mapped concentration strike, cash 29,600 |
| 29,616.17 | second pivot resistance, cash 29,535.67, target 1, with the 38.2% retracement at 29,610.77 |
| 29,582.25 | overnight session high, cash 29,501.75, the immediate ceiling |
| 29,470 to 29,500 | entry band, the reclaimed decision-band pullback |
| 29,471.84 | 20-day average, cash 29,391.34, decision band top |
| 29,459.68 | 50-day average, cash 29,379.18, decision band base |
| 29,415 | stop, sited below the decision band |
| 29,355.50 | upper flow concentration, cash 29,275 |
| 29,330.50 | volatility inflection level, cash 29,250 |
| 29,289.50 | September settle, cash 29,209, gap-fill objective |
| 29,274.42 | daily pivot point, cash 29,193.92 |
| 29,096.00 | session low, cash 29,015.50, held the post-data flush |
| 29,080.50 | primary gamma concentration strike, cash 29,000, strongest support base |
| 28,996.50 | dealer gamma flip level, cash 28,916 |
| 28,989.70 | 100-day average, the trend cushion |
| Metric | Reading |
|---|---|
| Proxy fund last | 714.32 in extended dealing, up 0.52 percent |
| Call gamma / put gamma | negative 999.47 million / negative 1.92 billion, both sides negative |
| Total dealer gamma notional | about negative 78.43 million with a positioning tilt of 0.900, short dealer positioning |
| Effect of short gamma | hedging flows amplify directional movement rather than damping it |
| Proxy put-to-call OI | 1.19, a persistent put tilt |
| Proxy call / put volume | 730,710 calls against 778,660 puts |
| Dominant expiries | gamma September 17, delta June 2027 |
| Index hedging flow | about plus 6 billion positive delta across the session, put selling and call buying concentrated in same-day expiries |
| Implied-vol rank and skew rank | 27.37 percent against 79.37 percent |
| Input | |
|---|---|
| Long-end Treasury yields | thirty-year rates extended to levels last seen in 2007 after warm inflation data, the principal duration headwind |
| Core personal-consumption inflation | 3.7 percent annual against 3.6 expected and preliminary core 3.6 against 3.4, removing the case for policy easing |
| Semiconductor earnings | the largest chipmaker beat with 96.2 billion revenue against 92.38 and 89.0 billion data-center against 85.86, shares up about 4 percent after hours |
| Dollar index | higher on the inflation data, a coherent negative for duration |
| Crude oil | lower on Gulf de-escalation optimism |
| Volatility index | 15.21, down 0.18, vol-of-vol 85.24, muted hedging into the event |
| Durable goods | up 1.1 percent against 0.5 expected, with firm income against flat real consumption |
| Software complex | a major customer-relationship platform beat at 5.90 adjusted against 2.91 a year earlier, AI monetization reaching the operating-margin line |
| When | Event |
|---|---|
| Thu Aug 27 | jobless claims 8:30 AM ET, a Federal Reserve official 10:00 AM ET, the seven-year auction 1:00 PM ET, the central-bank symposium running all day |
| Fri Aug 28 | the preliminary benchmark payrolls revision 10:00 AM ET, consensus 157,000 against a prior negative 911,000, final consumer sentiment and a symposium appearance |
| Sat Aug 29 | the central-bank symposium concludes |
| Sep 16 | the policy meeting and accompanying projections, the next scheduled first-order macro concentration |
The economic releases referenced above are published on the official government calendars below. Price levels are derived from standard technical and statistical methods, and the market read is AlgoIndex's own analysis. How we grade these calls is set out in our performance methodology.
- US Bureau of Economic Analysis, Personal Income and Outlays (PCE)
- US Bureau of Economic Analysis, Gross Domestic Product
- US Bureau of Economic Analysis, release schedule
- US Census Bureau, Advance Durable Goods (M3) release schedule
- US Energy Information Administration, Weekly Petroleum Status Report
- US Department of the Treasury, auction schedule and results
- AlgoIndex performance methodology



