
Crude's Sunday reopen went both ways in under four hours. The November contract printed a 92.62 high, 6 cents beneath Pivot R1, and by 9:48 PM ET it traded near 90.42, down 1.43 points from Friday's settle, after an 89.63 low. The Sunday update gives that order and ties the weakness to two reports: Russia lifted its diesel export restrictions after Friday's supply arrangement, and the Energy Department approved an emergency exchange of up to 4 million barrels from the strategic reserve for the hurricane disruption. In its words, together they eased the product shortage.
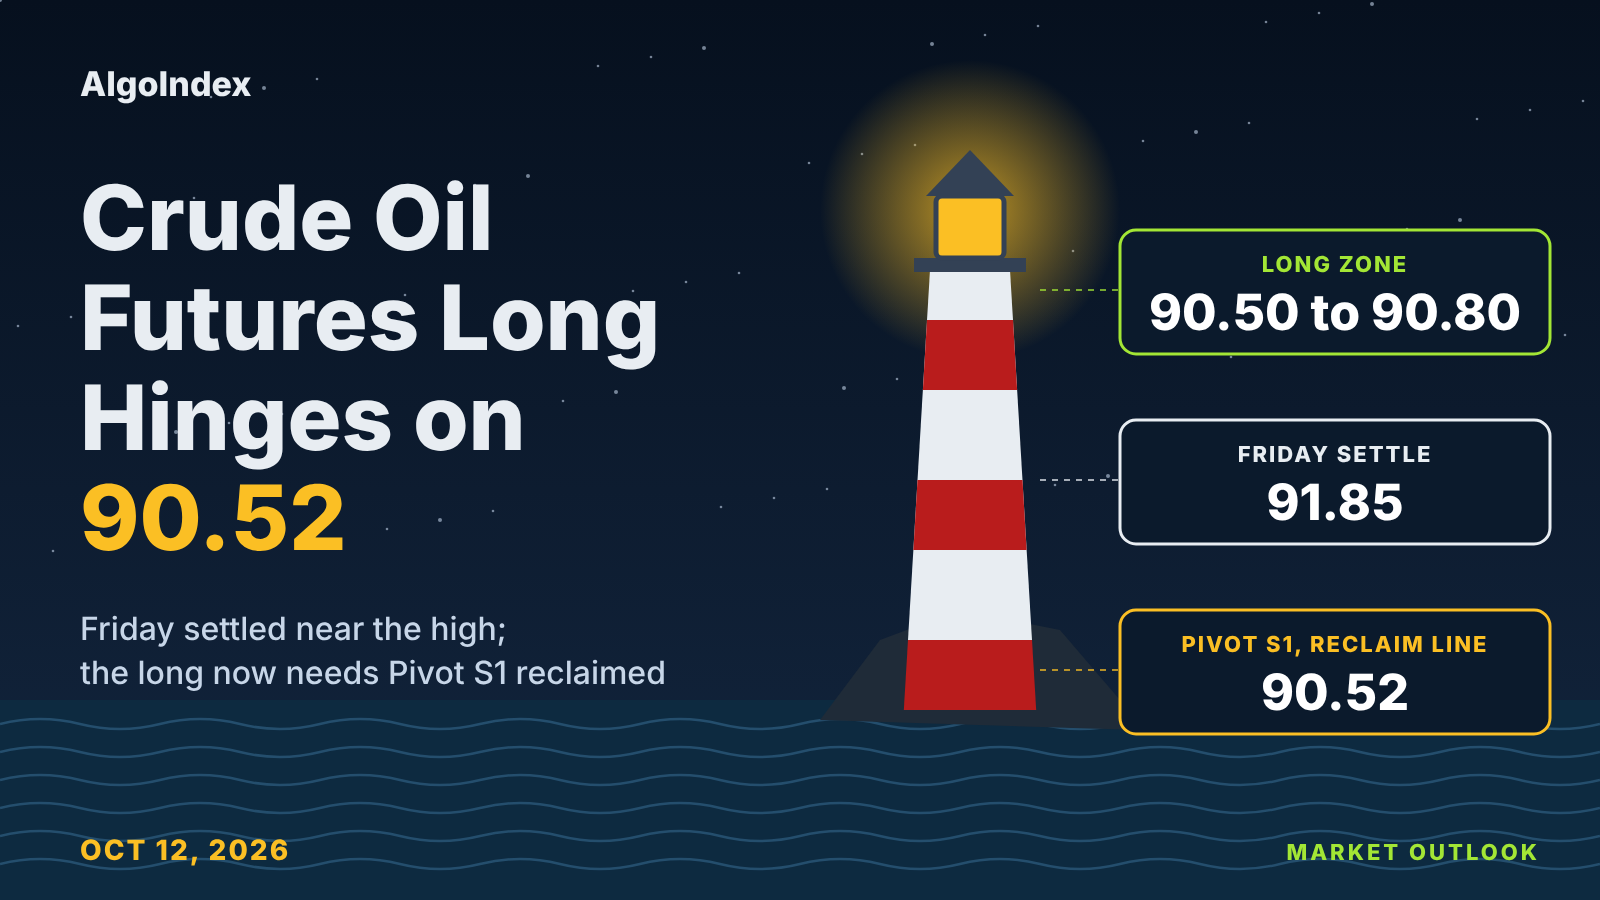
That low matters for Monday's plan. It went through the 90.50 to 90.80 long band and 2 cents beneath the 89.65 stop. So the update treats the long as written as invalidated by price before the session; it stands again only if the contract reclaims and holds Pivot S1 at 90.52 into the 9:30 AM ET cash open. Otherwise there is no trade.
Friday had looked firmer. November WTI settled at 91.85, up 36 cents or 0.39 percent, after a 90.01 to 92.17 inside day, a 2.16 point range that was the narrowest for the November contract since the 1.37 point range of 08/28. The settle finished at 85.2 percent of it. Provider commentary said crude shook off early losses on concerns about Middle East supply after Iran said it targeted a tanker attempting to transit the Strait of Hormuz, with support from Gulf of Mexico production curbed by Hurricane Isaias, while dollar strength limited the gain.
November crude settled at 91.85, 51 cents above the 91.34 Pivot Point, above the 5-day and 9-day settlement averages and 1.03 beneath the 20-day at 92.88. The primary setup was a long from 90.50 to 90.80 around Pivot S1 at 90.52 and the 9-day average crossing price at 90.61, stop 89.65 beneath two standard deviations support at 89.71, targets 91.65, 92.65 and an extended 93.65. Sunday's 89.63 overnight low traded through the band and beneath the stop, so the long as written is invalidated by price; per the Sunday update it stands only if the contract reclaims and holds 90.52 into the 9:30 AM ET cash open. At 9:48 PM ET it traded near 90.42, 10 cents beneath that line. Otherwise the 89.18 Pivot S2 to 88.77 Thursday low area is the next test. Crude settles at 2:30 PM ET on the Columbus Day holiday, and the weekly petroleum status report is delayed to Thursday.
Friday's 90.01 low ran through the long band and held 1.06 above the stop
First, the grading. In Friday’s outlook we set a long from 90.15 to 90.45, stop 88.95, with targets at 91.65, 93.00 and an extended 94.35. Friday's bar, from the review, opened at 91.29 at the Thursday 6:00 PM ET reopen, 84 cents above the band, marked a high of 92.17 and a low of 90.01, and settled at 91.85 at 2:30 PM ET. The low went 14 cents beneath the band's 90.15 bottom, so the whole band traded. The stop held, 1.06 beneath the low.
The first target traded too. The 92.17 high cleared 91.65 by 52 cents, and the settle finished 20 cents above it. The order is the gap in the record. The 91.29 open sat 36 cents beneath the target, and no complete intraday series was preserved, so the record cannot say whether 91.65 traded after the band did. The 93.00 target missed by 83 cents and the 94.35 extended target by 2.18. No fill and no result is asserted.
The card's risk lines stayed far away. Its invalidation was a settle beneath Pivot S1 at 89.11, and the settle finished 2.74 above it. Its acceptance line sat at 89.61, and the low held 40 cents above that, so no 30-minute close beneath it was possible.
Our ranges fit the day. The low-range case of 89.90 to 92.60 contained the whole session, with the low 11 cents above its bottom and the high 43 cents beneath its top, and the wider cases held too. The weighted path expected a hold between Pivot S1 at 89.11 and Pivot R1 at 93.54, with a dip toward the band holding above Pivot S1. The low stayed 90 cents above that pivot and the high 1.37 beneath the other. The Globex band of 89.90 to 92.60 held the full range as well.
Pivot S1 at 90.52, the 90.50 to 90.80 band and the 89.71 line
Sunday rearranged the map. The 92.62 overnight high sits 9 cents above the 38.2 percent retracement from the four-week low at 92.53 and 45 cents above Friday's 92.17 high, and 6 cents beneath Pivot R1 at 92.68. The 89.63 overnight low sits 3 cents beneath the 38.2 percent retracement from the 13-week high at 89.66 and 8 cents beneath 89.71, where two standard deviations support and the 40-day crossing price coincide. The 9:48 PM ET quote of 90.42 sits 8 cents beneath the band's bottom.
Resistance starts at the 18-day average crossing price at 91.90, 5 cents above the settle. Friday's 92.17 high, the 92.53 retracement, Pivot R1 at 92.68 and the published target price at 92.70 form the next band; the 20-day average at 92.88 sits just above. Thursday's 93.20 high, one standard deviation resistance at 93.37 and Pivot R2 at 93.50 come next, then two standard deviations resistance at 93.99. Then the extended references. The 50 percent retracement of the four-week range at 94.28, three standard deviations resistance at 94.48, Pivot R3 at 94.84 and the 38.2 percent retracement from the four-week high at 96.02 are the extended references, with the 101.69 one-month high beyond.
Support begins at the 91.34 Pivot Point. The 9-day crossing at 90.61, Pivot S1 at 90.52 and one standard deviation support at 90.33 form the band that anchored the setup, with the 9-day average at 90.47 and the 5-day at 90.10 among them. Friday's 90.01 low, the 89.71 line and the 89.66 retracement come next. Three standard deviations support at 89.22, Pivot S2 at 89.18, Thursday's 88.77 low and Pivot S3 at 88.36 follow, then the 50-day average at 86.99 and the 86.86 one-month low. The 50 percent retracement of the 13-week range at 85.94, the 100-day at 82.04, the 200-day at 75.84 and the 70.19 13-week low lie far beneath.
The settle splits the averages. It sits 1.75 above the 5-day at 90.10, 1.38 above the 9-day at 90.47 and 4.86 above the 50-day at 86.99, and 1.03 beneath the 20-day at 92.88. The 100-day at 82.04 and the 200-day at 75.84 sit 9.81 and 16.01 beneath. The 5-day rose 15 cents from 89.95 as the 10/02 settle of 91.11 left the window; the 20-day fell 20 cents from 93.09 and the 50-day rose 27 cents from 86.72. The 30 older settlements in the 50-day window averaged 83.07. Monday's crossing prices are 90.61 for the 9-day, 91.90 for the 18-day and 89.71 for the 40-day.
Momentum sits mid-range. Relative strength reads 52.57 on the 9-day, 53.12 on the 14-day and 54.19 on the 20-day. The raw stochastic reads 63.32 percent on the 9-day and 50.30 percent on the 14-day, and the 14-day %K at 35.91 percent sits above %D at 26.25 percent. Positive direction leads: 18.86 against 13.09 on the 9-day with the ADX at 18.25, and 20.29 against 13.84 on the 14-day with the ADX at 22.33. Historic volatility reads 34.56 percent and 33.54 percent. The composite multi-indicator read held at 32 percent buy, strength average and direction strengthening; it read 32 percent buy a week ago and 100 percent buy a month ago. The short-horizon group averages 20 percent buy, the medium 25 percent buy and the long 67 percent buy, and the trend indicator reads hold.
Ranges narrowed. The 14-day average true range stands at 3.97 points, 4.32 percent of the settle, and the 14-day average daily range at 4.24; the 9-day figures are 3.99 and 3.98 and the 20-day 3.86 and 4.23. One average true range either side of the settle spans 87.88 to 95.82, and the deviation bands run 90.33 to 93.37, 89.71 to 93.99 and 89.22 to 94.48. Eight sessions of daily ranges read 3.38, 4.89, 5.62, 3.14, 3.19, 3.02, 4.43 and 2.16. The prior week spanned 87.89 to 96.54 and this week 86.86 to 93.20, closing 74 cents higher. The 101.69 high sits 9.84 above the settle and the 86.86 one-month low 4.99 beneath it.
Russian diesel, Gulf shut-ins and a narrower heating oil margin
Supply news came from Moscow and Washington on Friday, per the news feed. At 2:46 PM ET and 2:47 PM ET the President said Russia would supply more than 300 thousand metric tons of diesel, another 500 thousand tons in November and 1 million tons thereafter. At 2:50 PM ET and 3:00 PM ET a Treasury general license authorised Russian-origin diesel transactions through April 7, 2027. Moscow followed. At 3:56 PM ET a state media report said Russia's president confirmed readiness to supply oil and products, and at 4:11 PM ET and 4:12 PM ET Russia's deputy prime minister said diesel export restrictions are lifted immediately and exports will rise in November and December. These are statements carried by the news feed; no volumes were measured. No new statement from the producer alliance was captured.
Products told the story. The November gasoline contract settled at 3.2952 dollars a gallon, down 0.0208 or 0.63 percent, and November heating oil at 4.7384, down 0.1445, per the news feed at 2:31 PM ET and the provider's settlement rows. On settlement arithmetic the gasoline margin stands at 46.55 dollars a barrel against 47.78 on Thursday, and the heating oil margin at 107.16 against 113.59. That 6.43 narrowing came on the day the Russian diesel arrangement was announced. The news feed carried at 12:33 PM ET that 1.5 million barrels a day, or 72 percent, of Gulf of Mexico oil production and 59 percent of gas production is shut in.
The Gulf stayed loud. Per the news feed, Iranian state-affiliated media reported between 8:33 AM ET and 8:35 AM ET that a large liquefied petroleum gas tanker was hit and caught fire, with Iran's military saying offending vessels would be pursued throughout the region. At 8:51 AM ET the maritime security agency received a report of an incident 13 nautical miles west of Al Jazeera in the United Arab Emirates, and at 8:52 AM ET explosions were reported in Erbil, Iraq. At 9:39 AM ET a press report said Houthi forces had placed concrete blocks on roads at Bab al-Mandeb. At 11:36 AM ET the President said the Iran matter would be over soon, one way or the other, and at 11:38 AM ET that 28 million barrels of oil had been taken out of Hormuz the day before. At 4:57 PM ET, after the settle, the Saudi-led coalition said it is carrying out a wide-ranging operation against Houthi capabilities. Diplomacy ran alongside. The Kremlin said at 3:58 PM ET that the leaders' call focused on Ukraine and touched on Iran, and Ukraine's president criticised the diesel arrangement at 3:45 PM ET and 3:46 PM ET. None was confirmed for this review.
Other inputs were mixed. The weekly rig survey, released at 1:01 PM ET per the news feed, showed the oil rig count at 462 against 456 a week earlier and the total at 603 against 598. Citing industry sources, the news feed carried at 1:32 PM ET and 1:33 PM ET that a presidential directive on diesel costs would push officials to use the Defense Production Act to raise oil and fuel output. Brent outpaced WTI. Brent's December contract settled at 104.72, up 44 cents or 0.42 percent, widening its premium over November WTI to 12.87 from 12.79. The dollar index closed at 102.21, up 0.07 percent, after a 101.92 to 102.33 session, and the ten-year yield index at 5.24 percent, up one basis point. Sentiment data came in soft. The University of Michigan preliminary sentiment index printed 46.3 against a 47.6 forecast at 10:00 AM ET, with one-year inflation expectations at 4.7 percent and five-year at 3.5 percent, per the news feed and unconfirmed against a primary release. The S&P 500 closed at 7,811.54, up 0.59 percent, and December gold at 4,216.3, up 1.43 percent.
Speculators cut length. The positioning report as of October 6, 2026 puts managed money long at 178,353 contracts, down 30,675, against short at 124,755, down 4,681, a net long of 53,598 against 79,592 a week earlier. Commercials held 894,330 long, up 20,693, against 1,020,788 short, up 4,533. The news feed carried the non-commercial net position at 99.1 thousand against 109.5 thousand. Open interest reads 188,142, Thursday's figure, down from 206,677 on Wednesday, and Friday's volume was 202,301 contracts against 341,641. The November contract expires on 10/20/26, with first notice on 10/22/26, so roll activity into December grows through the week. No dealer-positioning dataset was read for crude, and none is implied.
The weekend added more, per the news feed. A missile struck the domestic terminals at Riyadh's airport on Saturday, October 10, a second strike was reported Sunday, airport operations were suspended, and the President said Saturday that the United States may join Saudi strikes on the Houthis. A drone hit a tanker near Oman's Sohar anchorage just outside the Strait of Hormuz. The Energy Department approved an emergency exchange of up to 4 million barrels from the strategic reserve for the hurricane disruption, and Russia lifted its diesel export restrictions after Friday's supply arrangement. By 9:48 PM ET the contract traded near 90.42 inside an 89.63 to 92.62 overnight range.
The trade map for Monday
The review's primary setup was a long from 90.50 to 90.80. Friday settled above the 5-day and 9-day averages near the top of an inside-day range, positive direction leads on both windows and the composite's direction reads strengthening. The band wraps Pivot S1 at 90.52 and the 9-day crossing at 90.61. The stop sits at 89.65, beneath the 89.71 line, with targets at 91.65, 31 cents above the Pivot Point, 92.65, 3 cents beneath Pivot R1, and an extended 93.65, 15 cents above Pivot R2. The settle still sits beneath the 20-day average and the composite reads only 32 percent buy, so the review called it an analyst judgment against live supply headlines.
Sunday changed its standing. The 89.63 low traded 87 cents beneath the band's bottom and 2 cents beneath the stop, which in the update's reading invalidates the long as written before Monday's session. A settle beneath 89.71, the card's own invalidation, has not been tested yet; Monday's 2:30 PM ET settle decides it. The update leaves one way back. The long stands only if the contract reclaims and holds Pivot S1 at 90.52 into the 9:30 AM ET cash open, and at 9:48 PM ET it sat 10 cents beneath that line. Failing that, there is no trade, and the 89.18 Pivot S2 to 88.77 Thursday low area is the next test, with Pivot S3 at 88.36 beneath.
Now the arithmetic. From the 90.65 midpoint the risk to the stop is 1.00, 25.2 percent of the 14-day average true range of 3.97. The targets sit 1.00, 2.00 and 3.00 above the midpoint. Exact multiples, on paper.
The review's scenario ranges, written before the reopen, are analyst judgment. The low-range case runs 90.50 to 92.70, the most likely 90.00 to 93.50 and the high-range case 87.90 to 95.80. Session by session it expected roughly 90.30 to 93.00 through Globex, absent a headline shock, with a neutral to higher bias above the Pivot Point, 90.20 to 93.20 through London, 90.20 to 93.40 in the morning and 90.00 to 93.50 into the 2:30 PM ET settle. Sunday broke those bands. Its 89.63 low already sits 67 cents beneath the Globex band's bottom and 37 cents beneath the most likely case's; only the high-range case still holds it, 1.73 above its bottom. A gap beneath Friday's 90.01 low was the review's own reset signal for the level map.
Monday's calendar is light: Bank of England policymakers at 5:30 AM ET and 8:50 AM ET and a regional Federal Reserve president at 12:10 PM ET, per the news-feed calendar and unconfirmed, with crude settling at 2:30 PM ET on the Columbus Day holiday and participation possibly lighter. Japanese producer prices at 7:50 PM ET, with a 7.6 percent year-on-year forecast, the Australian central bank's minutes at 8:30 PM ET and the International Monetary Fund's World Economic Outlook at 10:00 PM ET follow, also unconfirmed. The producer group's monthly report is listed for Tuesday, October 13, with that date itself marked unconfirmed. The September consumer price index lands at 8:30 AM ET on Wednesday, October 14, 2026, retail sales and producer prices at 8:30 AM ET on Thursday, October 15, 2026, and the weekly petroleum status report at 12:00 PM ET that day, delayed one day by the holiday; the Fed chair speaks on Friday, October 16, 2026, as the calendar lists them.
In the review's analyst judgment the most probable path held the contract between Pivot S1 at 90.52 and Pivot R2 at 93.50, with a dip toward the band that holds above Friday's 90.01 low weighted above a break lower. It named an alternative. That was a weekend supply response, such as a fast restart of Gulf output or further Russian product flows, carrying the contract through 89.71 toward Pivot S3 at 88.36. The Sunday low went through 89.71. The diesel news the update cites matches the second of those triggers.
Friday's low held 40 cents above the old card's acceptance line; Sunday's low went 2 cents through the new card's stop.
The complete data picture
Every number behind Monday’s plan, charted first, then the full level lists, then the complete numeric reference underneath.
Full numeric reference, every remaining figure from the session review
1. Executive Summary
The November crude contract settled at 91.85 on Friday, up 36 cents or 0.39 percent from Thursday's settle of 91.49, after trading between 92.17 and 90.01, a 2.16 point daily range. The settle finished at 85.2 percent of the range, and the 2.16 point range was 0.51 times the published 14-day average daily range of 4.24 points. Friday was an inside day against Thursday, with a lower high and a higher low, and its 2.16 point range was the narrowest for the November contract since the 1.37 point range of 08/28. Over the week the contract rose 74 cents, or 0.81 percent, from the 91.11 settle of 10/02.
Provider commentary said crude shook off early losses on concerns about Middle East supply after Iran said it targeted a tanker attempting to transit the Strait of Hormuz, with support from Gulf of Mexico production curbed by Hurricane Isaias, while dollar strength limited the gain. The news feed carried at 8:33 AM ET an Iranian state-affiliated media report that a large liquefied petroleum gas tanker was hit and caught fire, and at 12:33 PM ET that 1.5 million barrels a day, or 72 percent, of Gulf of Mexico oil production is shut in. At 2:46 PM ET the President said, per the news feed, that he had concluded a call with Russia's president and that Russia would supply diesel to the market, and at 2:50 PM ET the Treasury issued a temporary general license for Russian-origin diesel. Only session extremes and selected 30-minute bars were captured, so no price move in this review is tied to a specific headline beyond those time stamps.
Brent's December contract settled at 104.72, up 44 cents or 0.42 percent, so Brent's premium over November WTI widened to 12.87 from 12.79. The ten-year yield index closed up one basis point at 5.24 percent and the dollar index closed at 102.21, up 0.07 percent. After the settle the news feed carried, at 4:11 PM ET and 4:12 PM ET, statements from Russia's deputy prime minister that diesel export restrictions are lifted immediately, and at 4:57 PM ET a statement from the Saudi-led coalition that it is carrying out a wide-ranging operation against Houthi capabilities in Yemen.
The Monday session follows a weekend in which the diesel arrangement, the Gulf storm shut-ins and the Hormuz tanker reports all remain open. The published 14-day average true range of 3.97 points is 4.32 percent of the settle. The Primary Setup below is a long from the 90.50 to 90.80 band, around Pivot S1 at 90.52 and the 9-day average crossing price at 90.61, stopped at 89.65 beneath two standard deviations support at 89.71, with objectives at 91.65, 92.65 and an extended 93.65.
2. Price Action & Technical Structure
2.1 Intraday and Session Review
The Friday session opened at 91.29 at the Thursday 6:00 PM ET reopen, 20 cents beneath Thursday's settle, marked a daily high of 92.17 and a daily low of 90.01, and settled at 91.85 at 2:30 PM ET. No complete intraday series was preserved for this session, so this review makes no claim about when the high or the low printed or about the path between them.
The news feed recorded the NYMEX settlement at 91.85 at 2:31 PM ET. After the settle, the chart's 4:30 PM ET bar closed at 91.66; that post-settlement quote is not used as the settlement anywhere in this review. Globex is closed for the weekend, so the provider's day open, high and low of 91.29, 92.17 and 90.01 belong to the completed Friday session, and the pivot ladder published for Monday is built from that session.
The session extremes used here are the completed-session inputs behind the published pivot ladder rather than an independently read bar, back-solved from the outer pivot pairs and verified against every rung. Pivot R3 at 94.84 minus Pivot S3 at 88.36, divided by three, returns 2.16, and Pivot R2 at 93.50 minus Pivot S2 at 89.18, divided by two, returns the same 2.16. Three times the Pivot Point of 91.34 less the 91.85 settle gives a high plus low sum of 182.17, one cent from the 182.18 of the solved pair because the published pivot is rounded, and the pair of 92.17 and 90.01 reproduces all seven published rungs. Independent corroboration: the provider's overview, the provider's settlement row and the chart's completed Friday daily bar carry the same 92.17 high and 90.01 low.
2.2 Daily Structure
Friday printed an inside day against Thursday: the 92.17 high sits 1.03 points beneath Thursday's 93.20, and the 90.01 low sits 1.24 points above Thursday's 88.77. The settle at 85.2 percent of the range leaves a short upper shadow of 32 cents on the daily bar. The sequence of session highs over the last six sessions reads 93.51, 91.88, 90.05, 90.98, 93.20 and 92.17, and the sequence of session lows reads 87.89, 88.74, 86.86, 87.96, 88.77 and 90.01. Settlements over the same six sessions ran 91.11, 89.43, 89.44, 88.28, 91.49 and 91.85.
The prior week, September 28 through October 2, spanned 96.54 to 87.89. This week, October 5 through October 9, spanned 93.20 to 86.86 and closed 74 cents higher. The 52-week, 13-week and one-month high of 101.69 sits 9.84 points above the settle, and the one-month low of 86.86 sits 4.99 points beneath it.
No prior-quarter high or low was captured for this review, so the 13-week extremes serve as the available quarterly reference: 101.69 above and 70.19 beneath.
2.3 4-Hour and Swing Structure
Daily ranges for the last eight sessions ran 3.38, 4.89, 5.62, 3.14, 3.19, 3.02, 4.43 and 2.16. The settlement changes over the same eight sessions read plus 1.04, plus 2.45, minus 1.76, minus 1.68, plus 0.01, minus 1.16, plus 3.21 and plus 0.36.
The retracement grid published for Monday places the 38.2 percent retracement from the 13-week high at 89.66, 2.19 points beneath the settle, and the 50 percent retracement of the 13-week range at 85.94. Above the settle, the 38.2 percent retracement from the four-week low sits at 92.53, the 50 percent retracement of the four-week range at 94.28 and the 38.2 percent retracement from the four-week high at 96.02. No four-hour series was captured for this review, so swing structure here rests on daily bars only.
2.4 Moving Averages
The averages cited in this subsection were computed for this review from the provider's daily settlement series for the November contract, which holds 260 completed sessions through Friday. The 5-day average stands at 90.10, the 9-day at 90.47, the 20-day at 92.88, the 50-day at 86.99, the 100-day at 82.04 and the 200-day at 75.84.
The 91.85 settle sits 1.75 points above the 5-day average, 1.38 points above the 9-day and 4.86 points above the 50-day, and 1.03 points beneath the 20-day. The 5-day average rose 15 cents from Thursday's 89.95, because the 10/02 settle of 91.11 left the window and was replaced by 91.85. The 20-day fell 20 cents from 93.09 and the 50-day rose 27 cents from 86.72.
The 20-day average sits above the 50-day because the last 20 settlements averaged 92.88 against 86.99 for the full 50, which means the 30 older settlements in the 50-day window averaged lower, at 83.07. The projection grid gives the prices at which each average would be crossed on Monday: 90.61 for the 9-day, 91.90 for the 18-day and 89.71 for the 40-day.
2.5 Oscillator and Trend Readings
The oscillator figures below are as published on the provider's technical page dated for the Friday session and read after the settle; Globex is closed for the weekend, so the page reflects the completed session. The 9-day relative strength reads 52.57, the 14-day relative strength 53.12 and the 20-day relative strength 54.19.
The 9-day raw stochastic reads 63.32 percent and the 14-day raw stochastic 50.30 percent, while the 14-day stochastic %K reads 35.91 percent and the 14-day stochastic %D 26.25 percent, so the smoothed lines remain in the lower half of their range, with %K above %D.
The 9-day directional index ADX reads 18.25 with the 9-day +DI at 18.86 and the 9-day -DI at 13.09; the 14-day directional index ADX reads 22.33 with the 14-day +DI at 20.29 and the 14-day -DI at 13.84, so positive direction leads on both. The 9-day historic volatility reads 34.56 percent and the 14-day historic volatility 33.54 percent.
The composite multi-indicator read published for the Friday session is 32 percent buy, unchanged from the prior session's snapshot, with signal strength described as average and direction as strengthening. The snapshot history reads 32 percent buy a week ago and 100 percent buy a month ago. The short-horizon group averages 20 percent buy, the medium-horizon group 25 percent buy and the long-horizon group 67 percent buy, and the composite trend indicator reads hold.
2.6 Volatility and Expected Range
The published 14-day average true range stands at 3.97 points and the 14-day average daily range at 4.24 points; the 9-day average true range is 3.99 with a 9-day average daily range of 3.98, and the 20-day average true range is 3.86 with a 20-day average daily range of 4.23. Friday's 2.16 point range was 0.51 times the 14-day average daily range.
Adding and subtracting the 14-day average true range of 3.97 points from the 91.85 settle frames Monday between 87.88 and 95.82. The published standard-deviation bands are narrower because they are built from five settlements: one deviation spans 90.33 to 93.37, two spans 89.71 to 93.99 and three spans 89.22 to 94.48. These bands describe settlement dispersion, not intraday reach.
3. Key Levels
3.1 Resistance
The settle at 91.85 sits 5 cents beneath the 18-day average crossing price at 91.90, the first resistance. Friday's 92.17 high, the 38.2 percent retracement from the four-week low at 92.53, Pivot R1 at 92.68 and the published target price at 92.70 form the next band. Thursday's 93.20 high, one standard deviation resistance at 93.37 and Pivot R2 at 93.50 come next, followed by two standard deviations resistance at 93.99. The 50 percent retracement of the four-week range at 94.28, three standard deviations resistance at 94.48, Pivot R3 at 94.84 and the 38.2 percent retracement from the four-week high at 96.02 are the extended references, with the 101.69 one-month high beyond.
3.2 Support
Beneath the settle, the Pivot Point at 91.34 comes first. The 9-day average crossing price at 90.61, Pivot S1 at 90.52 and one standard deviation support at 90.33 form the band that anchors the setup. Friday's 90.01 low, the 40-day average crossing price at 89.71, two standard deviations support at 89.71 and the 38.2 percent retracement from the 13-week high at 89.66 form the next grouping. Three standard deviations support at 89.22, Pivot S2 at 89.18, Thursday's 88.77 low and Pivot S3 at 88.36 follow, then the 86.86 one-month low and the 50-day settlement average at 86.99.
4. Macro Drivers
4.1 OPEC and Supply Policy (Quotas, Compliance, Saudi/Russia Signals)
No new statement from the producer alliance was captured on the feeds read for this review. The supply news of the day came from Russia and the United States: the news feed carried at 2:46 PM ET and 2:47 PM ET the President's statements that Russia would supply more than 300 thousand metric tons of diesel, another 500 thousand tons in November and 1 million tons thereafter, at 2:50 PM ET and 3:00 PM ET a Treasury general license authorising Russian-origin diesel transactions through April 7, 2027, at 3:56 PM ET a state media report that Russia's president confirmed readiness to supply oil and products, and at 4:11 PM ET and 4:12 PM ET statements from Russia's deputy prime minister that diesel export restrictions are lifted immediately and that exports will rise in November and December. These are statements carried by the news feed rather than volumes measured for this review.
4.2 EIA and API Inventory (Crude Stocks, Gasoline, Distillates, Cushing, SPR)
The calendars captured for this review contain no inventory release for Friday. The next weekly petroleum status report is scheduled for 12:00 PM ET on Thursday, October 15, 2026, as the calendar lists it, delayed one day by the Columbus Day holiday. The weekly rig survey, released at 1:01 PM ET per the news feed, showed the oil rig count at 462 against 456 a week earlier and the total rig count at 603 against 598. The news feed carried at 1:32 PM ET and 1:33 PM ET, citing industry sources, that a presidential directive on diesel costs would push officials to use the Defense Production Act to raise oil and fuel output.
4.3 Geopolitical Backdrop (Middle East, Iran, Russia/Ukraine, Venezuela)
The news feed carried at 8:33 AM ET to 8:35 AM ET Iranian state-affiliated media reports that a large liquefied petroleum gas tanker was hit and caught fire, with Iran's military saying offending vessels would be pursued throughout the region. At 8:51 AM ET the maritime security agency received a report of an incident 13 nautical miles west of Al Jazeera in the United Arab Emirates, and at 8:52 AM ET explosions were reported in Erbil, Iraq. At 9:39 AM ET a press report said Houthi forces had placed concrete blocks on roads at Bab al-Mandeb. At 11:36 AM ET the President said the Iran matter would be over soon, one way or the other, and at 11:38 AM ET that 28 million barrels of oil had been taken out of Hormuz the day before. After the settle, at 4:57 PM ET, the Saudi-led coalition said it is carrying out a wide-ranging operation against Houthi capabilities. On Russia and Ukraine, the Kremlin said at 3:58 PM ET that the leaders' call focused on Ukraine and touched on Iran, and Ukraine's president criticised the diesel arrangement at 3:45 PM ET and 3:46 PM ET. These are statements carried by the news feed rather than events confirmed for this review.
4.4 Demand and Refining (Refinery Utilization, Crack Spreads, Seasonal Pattern)
The November gasoline contract settled at 3.2952 dollars a gallon, down 0.0208 or 0.63 percent, and the November heating oil contract settled at 4.7384, down 0.1445, per the news feed at 2:31 PM ET and the provider's settlement rows. On the settlement arithmetic the gasoline margin, 42 gallons times the gasoline settle less the WTI settle, stands at 46.55 dollars a barrel against 47.78 on Thursday, and the heating oil margin at 107.16 against 113.59. The narrowing of the heating oil margin by 6.43 dollars came on the day the Russian diesel arrangement was announced. The news feed carried at 12:33 PM ET that 1.5 million barrels a day, or 72 percent, of Gulf of Mexico oil production and 59 percent of gas production is shut in. No refinery utilisation figure and no seasonal demand series were captured, so neither is asserted.
4.5 Dollar and Cross-Asset (DXY, Commodities Complex, Equity Risk-On/Off)
The dollar index closed at 102.21, up 0.07 percent, after a session range of 101.92 to 102.33, per the provider's quote. The ten-year yield index closed at 5.24 percent, up one basis point. The thirty-year yield index closed unchanged at 5.60 percent. The University of Michigan preliminary sentiment index printed 46.3 against a forecast of 47.6 at 10:00 AM ET, with one-year inflation expectations at 4.7 percent and five-year expectations at 3.5 percent, per the news feed and unconfirmed against a primary release. Brent's December contract settled at 104.72, up 0.42 percent, so its premium over November WTI widened to 12.87 from 12.79. The S&P 500 cash index closed at 7,811.54, up 0.59 percent, and gold's December contract settled at 4,216.3, up 1.43 percent.
4.6 Institutional Positioning (COT, Money Manager and Commercial Hedger, Speculator Length)
The positioning report as of October 6, 2026, shown on the provider's overview for this review, puts managed money long at 178,353 contracts, down 30,675, against short at 124,755, down 4,681, a net long of 53,598 against 79,592 a week earlier. Commercials held 894,330 long, up 20,693, against 1,020,788 short, up 4,533. The news feed carried the non-commercial net position at 99.1 thousand against 109.5 thousand, so speculative length was reduced in the week to Tuesday.
Open interest on the November contract is shown at 188,142, which is Thursday's figure, down from 206,677 on Wednesday; Friday's open interest had not been reported at the time of capture. Friday's volume was 202,301 contracts against Thursday's 341,641. The November contract expires on 10/20/26, per the provider, with first notice on 10/22/26, so roll activity into December grows through the coming week.
5. No Liquid Options Proxy
This review covers crude without a positioning dataset. There is no dealer-positioning surface read for this instrument in for this review, no gamma map, no options concentration levels and no flow attribution, and none is inferred from any other instrument. Every level in section 3 originates in published pivot arithmetic, published standard-deviation bands, published retracement and moving-average projections, settlement averages computed from the provider's daily record, or the completed-session extremes described in section 2.1.
This is a statement about coverage, not about the existence of listed crude options. No such dataset was read for this review, so no claim resting on one appears anywhere in this review or in the derived public post. The positioning inputs used for crude are the weekly positioning report, the official inventory report, the Brent spread and the product margins.
6. Forecast
6.1 Night Session (6:00 PM ET Sunday to 3:00 AM ET Monday, Globex/Asia)
Globex reopens at 6:00 PM ET on Sunday, October 11, after two days of weekend headline exposure: the Russian diesel arrangement, the Gulf of Mexico shut-ins, the Hormuz tanker reports and the 4:57 PM ET Friday statement on the coalition operation against the Houthis are all unresolved at the close. A gap above Thursday's 93.20 high or beneath Friday's 90.01 low would reset the level map. Bias neutral to higher above the 91.34 Pivot Point, expected Globex band roughly 90.30 to 93.00 absent a headline shock.
6.2 London Session (3:00 AM to 8:00 AM ET Monday)
A Bank of England policymaker is listed at 5:30 AM ET, per the news-feed calendar and unconfirmed. Friday's inside day leaves Thursday's 93.20 high and 88.77 low as the outer boundaries. Bias neutral to higher, expected band roughly 90.20 to 93.20, with the 90.50 to 90.80 band the first meaningful support beneath the Pivot Point.
6.3 Morning Session (9:00 AM to 12:00 PM ET Monday, US Open / Pit Session)
A second Bank of England policymaker is listed at 8:50 AM ET, per the news-feed calendar and unconfirmed. Monday, October 12, is the Columbus Day holiday, with Globex on normal hours and products settling at normal times, as the calendar lists it, so participation may be lighter than usual. Expected band roughly 90.20 to 93.40, with Pivot R1 at 92.68 the first meaningful resistance above Friday's 92.17 high.
6.4 Afternoon Session (12:00 PM to 2:30 PM ET Monday, NYMEX Pit Close)
A regional Federal Reserve president is listed at 12:10 PM ET, per the news-feed calendar and unconfirmed. Crude settles at 2:30 PM ET. Expected band roughly 90.00 to 93.50.
6.5 Night Session Forward (6:00 PM ET Monday)
The Tuesday session opens at 6:00 PM ET Monday. Japanese producer prices are listed at 7:50 PM ET, the Australian central bank's minutes at 8:30 PM ET and the International Monetary Fund's World Economic Outlook at 10:00 PM ET, all per the news-feed calendar and unconfirmed. The producer group's monthly report is listed for Tuesday, October 13, as the calendar lists it, with that date itself marked unconfirmed.
6.6 Expected Range (Monday Full Session)
Low-range scenario: 90.50 to 92.70
Mid-range scenario (most likely): 90.00 to 93.50
High-range scenario: 87.90 to 95.80
6.7 Most Likely Path
In this review's analyst judgment the most probable path holds the contract between Pivot S1 at 90.52 and Pivot R2 at 93.50, with weekend Gulf, Hormuz and Russian supply headlines deciding the side. A dip toward the 90.50 to 90.80 band that holds above Friday's 90.01 low is weighted above a break lower, because Friday settled above the 5-day and 9-day settlement averages near the top of its range, positive direction leads on the 9-day and 14-day directional systems, and the composite direction is described as strengthening. The alternative that would invalidate this reading is a weekend supply response, such as a fast restart of Gulf output or further Russian product flows, that carries the contract through 89.71 toward Pivot S3 at 88.36.
7. Monday Economic Calendar
Globex reopens at 6:00 PM ET on Sunday, October 11. Monday, October 12, is the Columbus Day holiday, with Globex on normal hours and products settling at normal times, as the calendar lists it; the Federal Reserve is closed and its daily statistical releases move to Tuesday, as the same calendar lists it.
A Bank of England policymaker is listed at 5:30 AM ET and a second at 8:50 AM ET, and a regional Federal Reserve president at 12:10 PM ET, all per the news-feed calendar and unconfirmed. Crude settles at 2:30 PM ET. Japanese producer prices are listed at 7:50 PM ET with a forecast of 7.6 percent year on year, the Australian central bank's minutes at 8:30 PM ET and the International Monetary Fund's World Economic Outlook at 10:00 PM ET, all per the news-feed calendar and unconfirmed. The captured calendars carry no crude-specific scheduled release for Monday and no mega-capitalisation earnings entry.
Later in the week, the producer group's monthly report is listed for Tuesday, October 13, as the calendar lists it, with that date itself marked unconfirmed. The consumer price index for September is scheduled for 8:30 AM ET on Wednesday, October 14, 2026, as the calendar lists it, and the next weekly petroleum status report for 12:00 PM ET on Thursday, October 15, 2026, as the calendar lists it. The November contract expires on 10/20/26, per the provider. In this review's judgment the first-order influence on crude on Monday is unscheduled: how the Russian diesel arrangement, the Gulf shut-ins and the Hormuz tanker reports develop over the weekend.
8. Primary Trade Setup
Direction: Long
Rationale: Friday's settle sits above the 5-day and 9-day settlement averages at 85.2 percent of an inside-day range, positive direction leads on the 9-day and 14-day directional systems, and the composite direction is described as strengthening; a dip into Pivot S1 at 90.52 and the 9-day average crossing price at 90.61 offers a long with a defined risk point beneath two standard deviations support at 89.71. The settle still sits beneath the 20-day average and the composite reads only 32 percent buy, and the Russian diesel arrangement and any restart of Gulf output are the main risks to a long, so the setup is an analyst judgment against live supply headlines.
Entry Zone: 90.50 to 90.80
Stop Loss: 89.65 (beneath two standard deviations support at 89.71 and the 40-day average crossing price at 89.71)
Target 1 (T1): 91.65 (31 cents above the 91.34 Pivot Point)
Target 2 (T2): 92.65 (3 cents beneath Pivot R1 at 92.68)
Target 3 (T3, extended): 93.65 (15 cents above Pivot R2 at 93.50)
Risk-to-Reward: Approximately 1:1 to T1, 1:2 to T2, 1:3 to T3
Invalidation: A settle beneath two standard deviations support at 89.71 negates the thesis. Short of that, the edge is removed by acceptance beneath Friday's 90.01 low rather than by a touch, defined as two consecutive 30-minute closes beneath 90.01.
Macro override: A weekend restart of Gulf of Mexico output, or confirmed Russian product flows that extend the heating oil margin compression, would remove part of the supply premium. In that scenario a drop through the 89.65 stop invalidates the long before the targets, and Pivot S3 at 88.36 and the 86.86 one-month low become the references within one 14-day average true range of 3.97 points.
Sources and methodology
This outlook is built from our session review of the November WTI crude contract, the November ’26 contract, prepared after Friday's close on October 9, 2026 for the Monday, October 12, 2026 session, and from the Sunday evening update written at 9:48 PM ET on October 11, 2026, which carries the overnight quotes, the weekend headlines and the update's reading of the setup. Friday's completed extremes are the inputs behind the published pivot ladder: Pivot R3 at 94.84 less Pivot S3 at 88.36, divided by three, and Pivot R2 at 93.50 less Pivot S2 at 89.18, divided by two, both return 2.16, and three times the 91.34 Pivot Point less the settle gives 182.17, a cent from the 182.18 of the solved pair of 92.17 and 90.01. The provider's overview, settlement row and the chart's completed Friday bar carry the same extremes, and only those figures and the review's statements are used to grade Friday's card. No complete intraday series was preserved for Friday, so no claim is made about when the high or low printed and no price move is tied to a specific headline.
The moving averages were computed from the provider's 260-session daily settlement series; the oscillators are cited as published for the Friday session, read after the settle. No dealer-positioning dataset was read for crude; the positioning inputs are the weekly positioning report, the Brent spread and the product margins. The order of Sunday's high and low and the reports linked to the weakness are as stated in the Sunday update, which was written with the session still open. Scenario ranges are analyst judgment, and items marked unconfirmed come from the news-feed calendar or press reports.
Friday’s outlook for this contract is here, and the gold contract’s Friday outlook covers the metal that rose 1.43 percent on Friday. Outlooks for ES, NQ, GC and CL are collected on the market outlook page, and our forward trading record is on the performance statement.



