
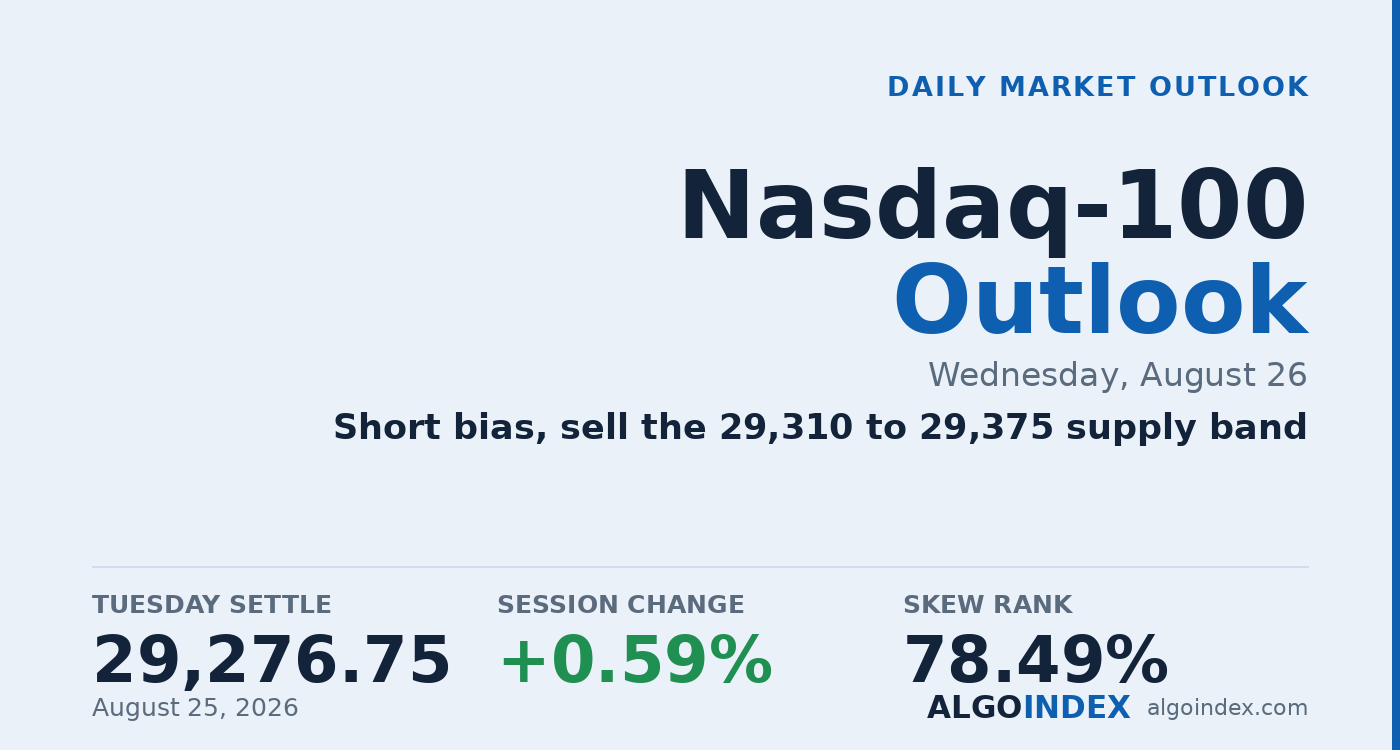
The September Nasdaq-100 settled Tuesday at 29,276.75, up 171.00 points or 0.59 percent, clawing back about 60 percent of Monday's slide and finishing in the upper third of a 408.75-point range. Here's what's worth marking: the bid came from the front of the index, not the back. Chips added about 2 percent and the memory names about 4 percent, and most of the megacaps went along for the ride. Cash outran the broad market by a wide margin, up 0.64 percent against 0.32 percent, and that gap is the fingerprint of a duration bid rather than a broad risk chase.
The engine behind the move was cross-asset, not company-specific. Crude fell more than 3 percent on reports that the Strait of Hormuz might reopen, and that drop pulled inflation expectations and the 10-year yield down about 6 basis points to near 4.64 percent. Nasdaq-100 names carry the longest duration in the equity market, so a lower discount rate hits them hardest, and falling yields helped support the rebound on a day when the domestic data actually came in soft. Consumer confidence missed at 89.4 and new home sales fell short too. The catch is that a genuinely green session still left price parked below its 5-day, 20-day and 50-day averages, which pile into a dense band between 29,310 and 29,375 right overhead. Tuesday didn't resolve the downtrend question. It just pushed it into Wednesday.
A green day that stopped at the ceiling
Start with the constructive read, because there's a real one. Tuesday settled 37 points above the daily pivot at 29,240 and lifted about 260 points off its 29,017 low into the bell, so buyers turned up right where the volume distribution said they would, on the heavy node between 29,030 and 29,050. The 9-day stochastic sits at 17 percent, about as washed out as the short lens gets, while the 20-day near 65 keeps the wider picture intact. Price still holds more than 335 points above the 100-day and nearly 2,000 above the 200-day. The larger uptrend hasn't been dented.
The problem sits directly overhead and in the mechanics. Price has lost the 5-day at 29,317, the 20-day at 29,374 and the 50-day at 29,491, so all three stack above as the first real work, and the 14-day negative directional index at 24.58 still tops the positive at 16.09. On top of that, the options proxy carries negative gamma on both sides, roughly 3.0 billion combined, which means dealer hedging feeds moves instead of pinning them. A rally draws more buying and a slide draws more selling. That's exactly the setup that turns a first push into the overhead band into a place to fade, not to chase.
Wednesday runs the week, and it runs before the bell
The calendar does the heavy lifting. At 8:30 AM ET in the morning, an hour before the open, the core inflation gauge lands alongside the second GDP estimate and durable goods, so the market digests the print and the bell reflects the reaction rather than waiting for it. Consensus has the monthly core ticking up from 0.1 to 0.2 percent, and since Tuesday's whole gain rode a 6 basis point yield drop, any print that reverses that move reverses the advance mechanically. Above the settle, the 29,310 to 29,375 band holds five separate references and is the first genuine test. Below, the pivot at 29,240 is the first support, then the 29,127 to 29,151 shelf. Then the session's real weight, the largest chipmaker's report, hits at 4:20 PM ET after the close and prices at the 6:00 PM ET Globex reopen.
Fade the band, cover into the shelf
The plan sells a failed push into the 29,310 to 29,375 band rather than shorting the first touch, because five references converge there and the trend still leans lower on the short horizon. The stop is 29,435, set above Tuesday's 29,425.75 high and the 29,426.62 first-standard-deviation resistance, about 93 points from the 29,342 entry midpoint. Targets run to the 29,240 pivot, then the 29,130 retracement shelf where three statistical references stack, then 29,055 at the top of the heaviest volume node, valid only on an extension through the second target with volume behind it. Size stays small, since this is worked a full session ahead of an inflation print and an after-hours earnings report that can move the index several percent. Two things flip it: a soft core print that gaps the market through 29,375 before the fade can form, in which case the alternate long from the 29,004 to 29,065 shelf takes over, or any reversal of the Hormuz de-escalation that sends crude and yields higher at once. Exposure carried into the 4:20 PM ET report is earnings-event exposure rather than the technical setup described here. Our performance methodology lays out how we grade these calls.
A settle 37 points over the pivot and about 260 off the low is a real bounce, but it died right where five references stack between 29,310 and 29,375. Constructive underneath, capped on top, and the fade is the first push into that band that can't hold.
A washed-out bounce that stalls at a stacked ceiling is a fade on the first failure, sized small. The edge is the 29,310 to 29,375 band, the stop is 29,435, and Wednesday's inflation-plus-chip double bill is the event it's really built around.
This is the read our members get every session, before the bell, with the levels drawn and the setup defined. See how the same dealer-positioning work turns into systematic signals.
View pricingThe complete data picture
Every number behind Wednesday’s plan, charted first; the full numeric reference follows underneath.
Full numeric reference, every remaining figure from the review
| Average | Value | Settle vs |
|---|---|---|
| 5-day | 29,316.70 | below by 39.95 |
| 20-day | 29,374.46 | below by 97.71 |
| 50-day | 29,491.17 | below by 214.42 |
| 100-day | 28,941.14 | above by 335.61, the nearest support |
| 200-day | 27,295.09 | above by 1,981.66 |
| Level | Reference |
|---|---|
| 30,343 | one-month high, cash 30,288, the recovery objective |
| 29,871 | pivot third resistance, cash 29,816 |
| 29,649 | pivot second resistance, cash 29,594, correction-complete line |
| 29,523 to 29,551 | second supply pocket, cash 29,468 to 29,496, the heaviest overhead volume node |
| 29,449 to 29,489 | first supply pocket, cash 29,394 to 29,434 |
| 29,410 to 29,427 | session-high shelf, cash 29,355 to 29,372, rejected within a point Tuesday |
| 29,310 to 29,375 | primary overhead band, cash 29,255 to 29,320, the short entry and five stacked references |
| 29,277 | Tuesday settle |
| 29,240 | daily pivot point, cash 29,185, first target and minimum bull condition |
| 29,127 to 29,151 | retracement shelf, cash 29,072 to 29,096, second target |
| 29,106 to 29,115 | Monday settle and volatility inflection, cash 29,051 to 29,060 |
| 29,004 to 29,065 | primary support shelf, cash 28,949 to 29,010, seven references and the alternate long |
| 28,941 to 28,947 | 100-day average and weekly low, cash 28,886 to 28,892, the trend-change line |
| 28,645 | pivot third support, cash 28,590 |
| Metric | Reading |
|---|---|
| Proxy fund last | 710.72, up 0.62 percent |
| Call gamma / put gamma | negative 796.8 million / negative 2.22 billion, both sides negative |
| Combined gamma | about negative 3.0 billion, dealer hedging amplifies moves |
| Dealer call-side ceiling | about 29,330 futures, inside the overhead band |
| Negative-gamma concentration strike | about 29,371 futures, overhead band top |
| Dealer gamma flip and concentration | about 29,004 and 29,055 futures, the primary support shelf |
| Same-day-expiry pull | about 29,247 futures, a mild downward magnet into the close |
| Proxy put-to-call OI | 1.19, a persistent put tilt |
| 25-delta risk reversal | negative 0.046 on the cash index |
| Implied-vol rank and skew rank | 31.74 percent versus 78.49 percent |
| Input | |
|---|---|
| 10-year yield | down about 6 basis points to near 4.64 percent, the crude-led disinflation channel that lifted duration |
| Crude oil | down more than 3 percent on Hormuz de-escalation reports, the international grade below 90 dollars |
| Semiconductor complex | chips up about 2 percent and memory about 4 percent, a positioning flush reversing |
| Broad benchmark | cash up 0.64 percent versus 0.32 percent for the large-cap index, a duration-led bid |
| Consumer confidence | 89.4 against 90.2 expected and 90.8 prior, with new home sales 0.607 million, soft domestic data |
| Graphics-processor name | reports Wednesday 4:20 PM ET with an about 5 percent implied move, dealer gamma negative across strikes |
| Volatility index | 15.46, down 2.40 percent, vol-of-vol down 3 percent to 85.67, a complacent read into the event stack |
| When | Event |
|---|---|
| Wed Aug 26 | core PCE 3.3 percent and second-estimate GDP 1.5 percent 8:30 AM ET, crude inventories 10:30 AM ET, five-year auction 1:00 PM ET, dominant chipmaker earnings 4:20 PM ET |
| Thu Aug 27 | jobless claims 208,000 8:30 AM ET, central-bank symposium opens, seven-year auction 1:00 PM ET, networking-silicon earnings with about a 9 percent implied move |
| Fri Aug 28 | policy authority keynote 10:00 AM ET on the symposium's second day, French preliminary CPI and Canadian output data |
The economic releases referenced above are published on the official government calendars below. Price levels are derived from standard technical and statistical methods, and the market read is AlgoIndex's own analysis. How we grade these calls is set out in our performance methodology.
- US Bureau of Economic Analysis, Personal Income and Outlays (PCE)
- US Bureau of Economic Analysis, Gross Domestic Product
- US Bureau of Economic Analysis, release schedule
- US Census Bureau, Advance Durable Goods (M3) release schedule
- US Energy Information Administration, Weekly Petroleum Status Report
- US Department of the Treasury, auction schedule and results
- AlgoIndex performance methodology



