
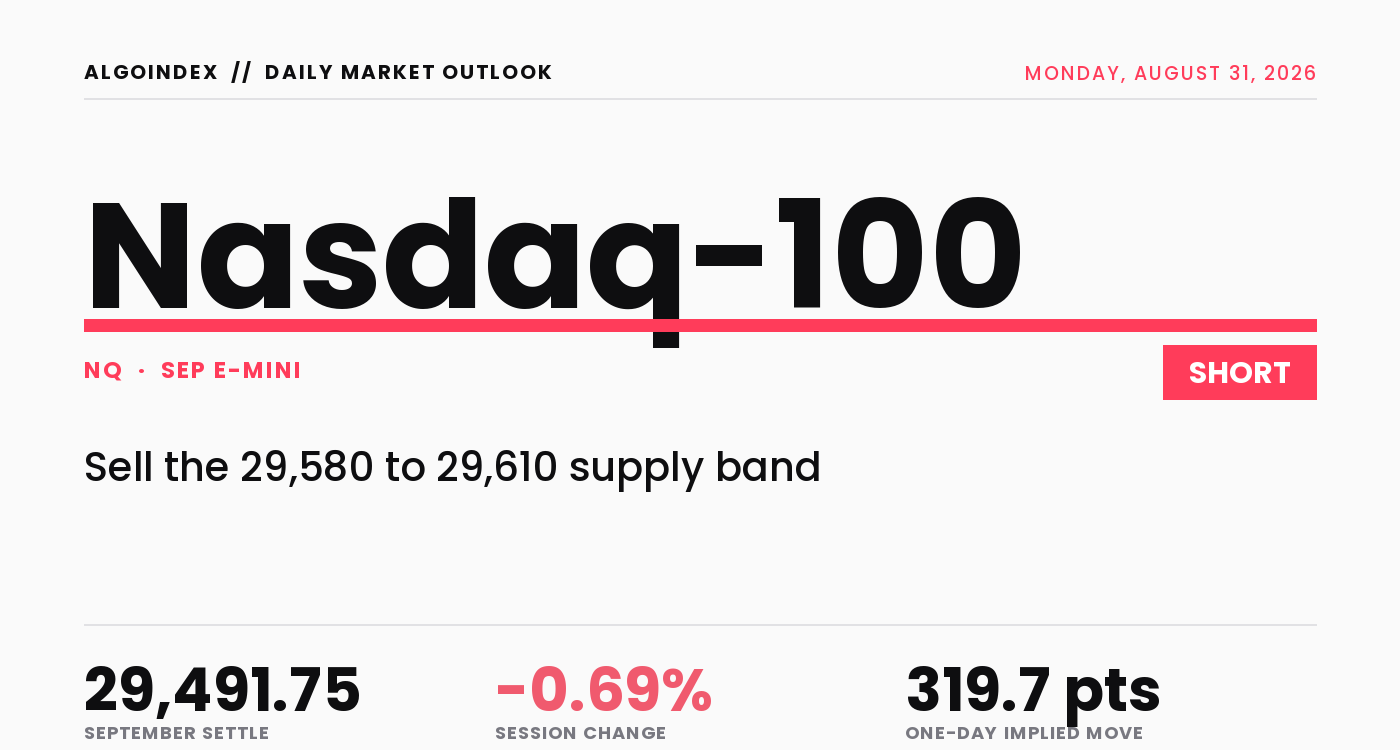
The September Nasdaq-100 settled Friday at 29,491.75, down 204.00 points or 0.69 percent from Thursday’s 29,695.75 close. The session opened at 29,635.50, extended to a 29,811.50 high, then reversed for the balance of the day to print a 29,436.25 low and close in the bottom 14.8 percent of a 375.25-point range. Volume of 572,237 contracts ran 1.12 times the 510,598 20-day average, so the reversal carried participation rather than drifting lower on a thin book. This was a distribution session with a weak close, not a quiet fade, and the index gave 44 basis points to the broad market on the day as the damage concentrated in the semiconductor and AI-infrastructure complex.
The driver was a repricing of policy risk. A hawkish address at the central-bank symposium at 10:00 AM ET pushed the odds of a hike at next month’s meeting to 57 percent from 36 percent and moved the 2026 path from one hike to two, with the 10-year yield closing 5 basis points higher at 4.72 percent and the dollar index up 0.55 percent. An index whose valuation rests more heavily on discounted future cash flows than any other major benchmark absorbs that shift worse than the broad market does. The contradiction is that growth data deteriorated on the same morning, the Chicago-area barometer collapsing to 47.1 against a 57.9 consensus and the benchmark payrolls revision printing negative 79,000. A central bank threatening to tighten into contracting activity is the least comfortable environment long-duration equity can occupy, and the contract closed only 54.57 points above its 50-day average after trading to within 0.93 points of it.
A distribution close beneath the 20-day average
The structural read starts with location. At 29,491.75 the contract sits below only its 20-day average at 29,599.11 while holding above the 5-day at 29,371.90, the 50-day at 29,437.18, the 100-day at 29,089.93 and the 200-day at 27,344.26. That is a market that has lost its short-term momentum without breaking its intermediate structure. The settle closed inside a 161.93-point compression band between the 50-day and the 20-day, roughly a third of the way up from the lower boundary. The single most informative fact of the day is that the 29,436.25 low printed 0.93 points beneath the 50-day average and held it to the point into the close, which makes 29,437 the defining line: holding it keeps the intermediate structure intact, and failing it converts the whole configuration.
Momentum confirms the caution without demanding it. The 14-day relative-strength reading is 50.95, down 3.02 on the session and the definition of neutral, with the 20-day, 50-day and 100-day windows all between 50 and 54, so no timeframe is oversold or overbought. The stochastics are the bearish component: the 9-day and 14-day raw reads at 46.40 and 39.03 percent have rolled through their midlines while the 20-day and 50-day at 65.31 and 60.78 percent remain elevated, the divergence a stalling advance shows before it resolves. The directional system reads 15.06 on the 14-day window with the negative indicator above the positive, a range with a mild downward lean rather than a trend, which caps how far a single session should be expected to extend without a fresh catalyst.
The 29,599 to 29,611 recovery band decides Monday
Two structures frame the session. Overhead, the band from 29,599 to 29,611 stacks the 20-day moving average, the 38.2 percent retracement from the 13-week high at 29,610.77 and the 18-day average crossing at 29,624.23 inside 25 points, the most important resistance on the board. Recovering it neutralizes Friday’s damage; failing it is the trigger for the primary read. Above sits the 29,695.75 to 29,811.50 settle-and-high band, and beyond that the 29,723.42 first pivot resistance used as the stop reference. Beneath price, the 29,437 shelf pairs the 50-day average, the session low at 29,436.25 and the relative-strength midline at 29,427.66, and a break there opens 29,348, then 29,265, then 29,205. Monday carries no scheduled United States release across the cash session, so the technical map does more of the work than usual and weekend headlines set the tone into the 9:30 AM ET open.
Fade the retest, respect the shelf, size it down
The plan sells a rally into the 29,580 to 29,610 confluence band, taken only on a visible failure to hold above it rather than on the touch, leaning on a close in the bottom sixth of Friday’s range, the fast stochastics rolled through their midlines, and a policy repricing that is only one session old while positioning data shows speculative accounts had been adding length into it. The stop is 29,735, sited above the first pivot resistance at 29,723.42 and the one-standard-deviation resistance at 29,718.64 so the exit sits beyond the mechanical band rather than inside it, about 140 points from the 29,595 entry midpoint. Targets run to 29,437 at the triple-confluence shelf, then 29,348 at the first pivot support, then 29,205 at the second pivot support only if the 50-day shelf breaks on expanding volume rather than on a probe, for approximately 1 to 1.13, 1 to 1.76 and 1 to 2.79. A sustained hold above 29,611 with the 20-day average converting to support voids the read, and a close above 29,723 with the semiconductor complex participating unlocks 29,811 and then the 29,941 to 29,955 band. Two items override the technical structure. A weekend de-escalation of the Strait of Hormuz situation combined with a Chinese manufacturing survey above 50 would remove both overnight downside catalysts and open the reopen above the entry band, invalidating the read before it can be taken. A further hawkish symposium comment or a published rule restricting Chinese access to advanced chips would gap the market beneath the entry zone and favor the alternate long from 29,440 to 29,470 on a second defence of the 50-day average instead. Size stays trimmed for a Monday that follows two days of closed-market headline exposure. Our published record lays out how we grade these calls.
A close in the bottom sixth of the range on above-average volume, the settle trapped 107.36 points beneath the 20-day average, the fast oscillators rolled over and positioning that went into the weekend longer than a week earlier. The 29,599 to 29,611 recovery band is the referee: a failed retest activates the short toward the 29,437 shelf, while a reclaim converts Friday’s decline into a single-session shakeout.
A distribution close beneath the 20-day average is a rally to fade at the recovery band, not a print to chase. The edge is the failed retest of 29,580 to 29,610, and the invalidation is a sustained hold above 29,611.
This is the read our members get every session, before the bell, with the levels drawn and the setup defined. See how the same dealer-positioning work turns into systematic signals.
View pricingThe complete data picture
Every number behind Monday’s plan, charted first; the full numeric reference follows underneath.
Full numeric reference, every remaining figure from the review
| Average | Value | Settle vs |
|---|---|---|
| 5-day | 29,371.90 | settle above by 119.85, 0.41 percent |
| 20-day | 29,599.11 | settle below by 107.36, 0.36 percent |
| 50-day | 29,437.18 | settle above by 54.57, 0.19 percent, the defining shelf |
| 100-day | 29,089.93 | settle above by 401.82, 1.38 percent |
| 200-day | 27,344.26 | settle above by 2,147.49, 7.85 percent |
| Year-to-date | 27,627.58 | settle above by 1,864.17, 6.75 percent |
| Level | Reference |
|---|---|
| 31,100.00 | 52-week and 13-week high, set June 3 |
| 30,343.00 | one-month high, set August 17 |
| 30,098.67 | third pivot resistance, the extended weekly upside objective |
| 29,955.08 | second pivot resistance, paired with the 40-day average stall near 29,941.00 |
| 29,884.74 | three-standard-deviation resistance, the statistical envelope of a single advance |
| 29,811.50 | session high, the reversal origin and first supply reference |
| 29,723.42 | first pivot resistance, one-standard-deviation resistance four points away at 29,718.64, the stop reference |
| 29,695.75 | prior settle, the price that erases the loss entirely |
| 29,610.77 | 38.2 percent retracement from the 13-week high |
| 29,599.11 | 20-day moving average, with the 18-day average crossing at 29,624.23, the recovery band |
| 29,579.83 | pivot point, the base of the retest zone |
| 29,491.75 | September settle, the reference point for the session |
| 29,437.18 | 50-day moving average, session low at 29,436.25 and 50 percent relative-strength midline at 29,427.66, the triple-confluence shelf and target one |
| 29,382.56 | 9-day moving-average cross, the acceptance confirmation beneath the shelf |
| 29,348.17 | first pivot support, target two |
| 29,283.20 | 40-day moving-average cross, one-standard-deviation support 18.34 points below at 29,264.86 |
| 29,204.58 | second pivot support, target three |
| 29,170.88 | two-standard-deviation support, the top of the deep shelf |
| 29,150.75 | 50 percent retracement of the 13-week range |
| 29,142.95 | 38.2 percent retracement from the four-week high, the base of the deep shelf |
| 29,089.93 | 100-day moving average, sitting almost on the three-standard-deviation support at 29,098.76 |
| 28,972.92 | third pivot support, the extended downside objective |
| Metric | Reading |
|---|---|
| September options surface | 20 days to the September 17 expiry, implied volatility 17.21 percent, a 20 dollar point value |
| Implied one-day move | 1.084 percent, 319.7 points on a 29,491.75 settle, 81.0 percent of the 394.73-point 14-day average daily range |
| Implied against realized | 17.21 percent implied sits 33.72 percent above the 12.87 percent 14-day realized and just beneath the 17.63 percent 20-day realized, priced near four-week movement |
| Fund-proxy conversion ratio | 41.16, measured from the 29,491.75 settle against the 716.43 proxy close at the 4:00 PM ET mark, a same-day conversion convenience rather than a fixed basis |
| Positioning bias (week ended Aug 25) | speculative and real-money accounts added length and covered shorts into the policy shift while dealer and commercial accounts sold into that demand, so the market entered the weekend less hedged than a week earlier |
| Cohort | Weekly change |
|---|---|
| Non-commercial | flipped from net short 10,416 to net long 10,039, a 20,455-contract swing |
| Leveraged funds | cut net short from 61,771 to 41,232, covering 20,539 contracts |
| Asset managers | extended net long to 73,216, adding 4,884 |
| Dealers and intermediaries | deepened net short from 35,042 to 63,248, adding 28,206 |
| Commercials | net short 37,136 after adding 22,886 to the short side |
| Survey date | August 25, three sessions before Friday, so it describes the position going in |
| Input | |
|---|---|
| Federal Reserve policy | symposium remarks turned hawkish, the probability of a hike at next month’s meeting moved to 57 percent from 36 percent and the 2026 path repriced from one hike to two, the 10-year yield 5 basis points higher at 4.72 percent |
| Semiconductor cycle | Marvell Technology fell roughly 10 percent on soft third-quarter margin guidance, ADI down 3.40 percent, ADSK down 3.67 percent and AMD down 2.33 percent, a margin problem that generalizes across the supply chain |
| Sector rotation | platform mega-caps advanced with Alphabet up 1.74 percent, Apple up 1.63 percent and Meta up 1.21 percent against a broad decline in semiconductors and AI infrastructure |
| Growth data | the Chicago-area business barometer printed 47.1 against a 57.9 consensus and the preliminary benchmark payrolls revision came in at negative 79,000 against a positive 183,000 consensus |
| AI capex financing | two hardware-purchase debt packages of 2.4 billion and 1 billion dollars were arranged in the private-credit market, financing more sensitive to the front end of the curve as it reprices higher |
| Cross-asset | the dollar index up 0.55 percent at 99.677, the volatility index at 14.42, gold down 2.88 percent to 4,529.9 and crude near 83.40, a real-rate move rather than a flight to safety |
| Institutional positioning | the commitments data for the week ended August 25 shows speculative accounts adding length and dealers deepening a net short, the configuration in which a second down session extends |
| Geopolitical | the Strait of Hormuz situation escalated in the final hour of the session, press-attributed and unconfirmed, the largest weekend risk on the board |
| When | Event |
|---|---|
| Sun Aug 30 | the overnight Asian sequence, headlined by the official Chinese manufacturing survey at 9:30 PM ET, 49.5 consensus against a 49.2 prior, the first-order event for the index across the window |
| Mon Aug 31 | no scheduled United States release across the cash session, a positioning session ahead of a heavy data week, German preliminary consumer prices at 8:00 AM ET the only pre-market overlap |
| Tue Sep 1 | the manufacturing purchasing-managers survey and the job-openings report at 10:00 AM ET, 55.1 against a 55.6 prior and 7.313 million against a 7.359 million prior, the prices-paid component carrying unusual weight |
| Wed Sep 2 | the private payrolls estimate at 8:15 AM ET, 45,000 against a 44,000 prior, the Bank of Canada decision at a 2.25 percent expected hold, and factory orders |
The economic releases referenced above are published on the official government calendars below. Price levels are derived from standard technical and statistical methods, and the market read is AlgoIndex's own analysis. How we grade these calls is set out in our performance methodology.
- US Bureau of Economic Analysis, Personal Income and Outlays (PCE)
- US Bureau of Economic Analysis, Gross Domestic Product
- US Bureau of Economic Analysis, release schedule
- US Census Bureau, Advance Durable Goods (M3) release schedule
- US Energy Information Administration, Weekly Petroleum Status Report
- US Department of the Treasury, auction schedule and results
- AlgoIndex performance methodology



