
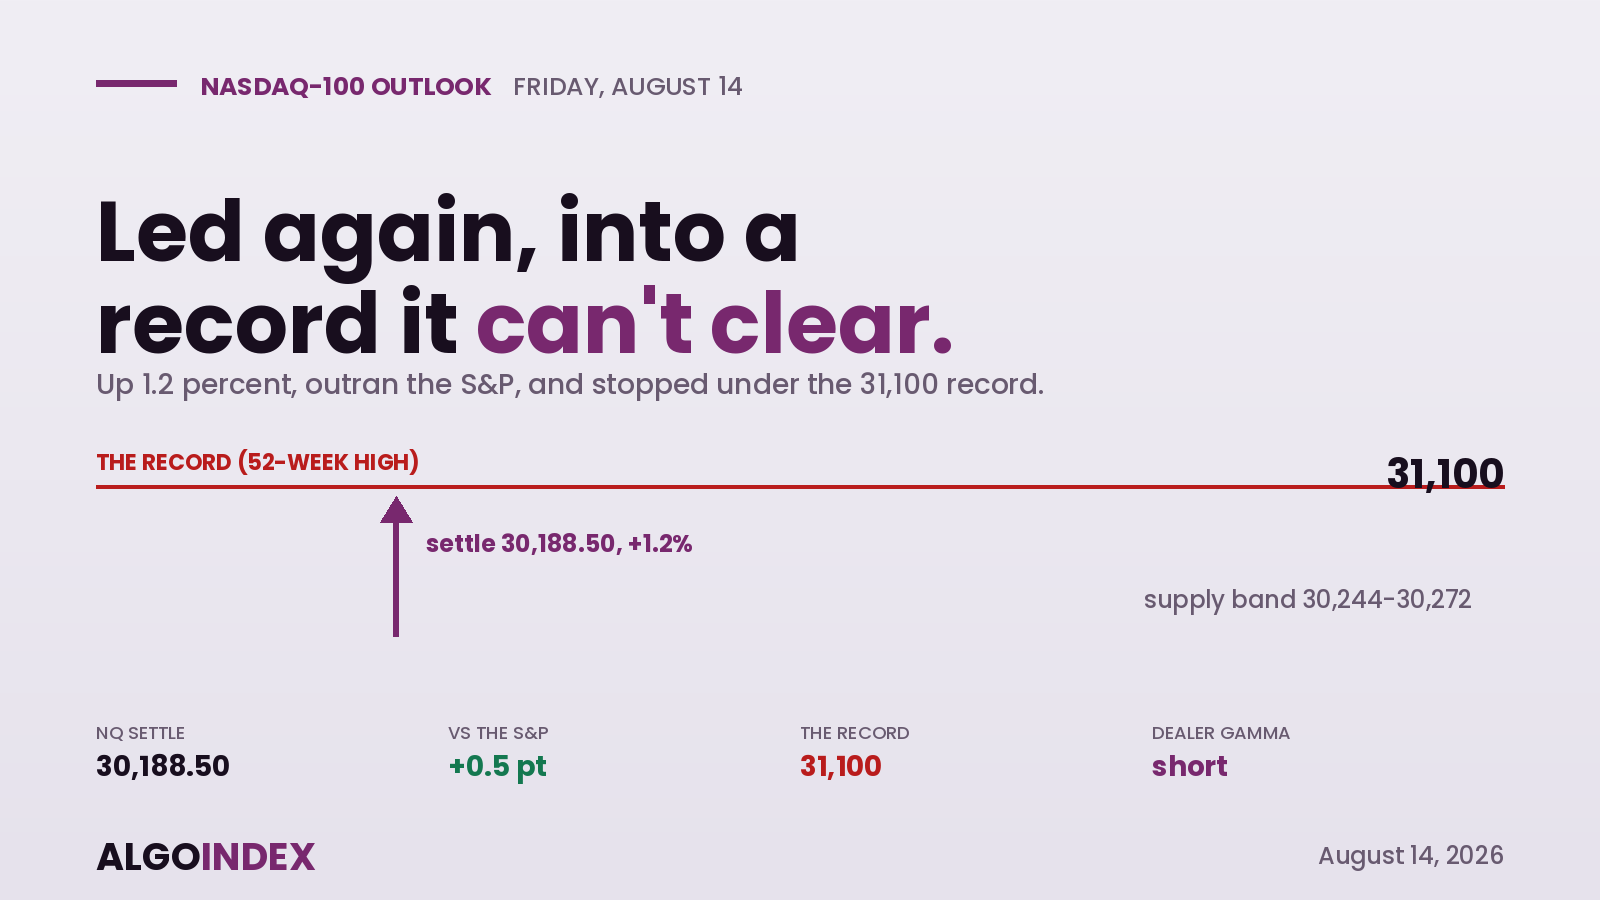
The Nasdaq 100 did on Thursday what it has done for most of this recovery: it led, and it led hard. The September E-mini settled at 30,188.50, up about 1.2 percent, outpacing the S&P 500 by half a point on the session as a second cool inflation print in two days rekindled the technology bid. The move had the shape of a trend day, not a spike: pullbacks were shallow, the close held near the highs, and the evening reopen defended the gains rather than fading them. It's the cleanest kind of advance there is.
The catch is where it stopped. The contract is now pressed into a dense band of supply that runs from Thursday's high up toward the record near 31,100, and it is grinding into that band overbought, with the short-window stochastics pinned above ninety. Underneath the strength, dealer positioning has flipped to a short-gamma posture, which means hedging now reinforces whatever the market does next instead of damping it. So the question into Friday isn't whether the trend is intact. It plainly is. The question is whether a market this stretched can climb a well-defined wall without first pausing, and what happens to the move once the amplifier is running in either direction.
Leadership that's a strength and a risk
The outperformance is the whole story, and it's concentrated. The Nasdaq beat the Dow by a full percentage point because the largest technology weights did the heavy lifting, with memory names up more than five percent offshore, a storage name up fourteen on an investor day, and a streaming name up five on an activist disclosure. That concentration is a strength while the artificial-intelligence story holds, because that's exactly where the index weight sits. But it's also the risk: when two or three names carry the index, a stumble in any one of them moves the whole thing, and there isn't much breadth underneath to absorb it.
The news flow under the move was relentless, fresh models and capacity and faster inference tiers across the largest platforms, and that's the demand engine beneath the semiconductor weights. It is the reason the index is outperforming, and it is also the reason the late-month chip earnings report matters so much: that print is the event that decides whether the theme can carry the index the last three percent through its record.
A wall, and a mechanism that cuts both ways
The supply band overhead is real and it's layered: the prior-day high, the one-month high, and then a stack of pivot and standard-deviation levels before the record itself. Above the immediate band the traded volume thins out, which means the area directly overhead has less prior acceptance and can move quickly once it's engaged. That's where the short-gamma posture matters. A clean push through the band can extend fast because dealers chase it, and a loss of the 30,080 pivot can accelerate lower for the same mechanical reason. There isn't a lot of middle ground in that configuration.
Buy the shelf, don't chase the band
The higher-quality expression isn't to chase strength into the supply band. It's to buy a controlled pullback into the 29,900 to 29,950 shelf, where the five-day average and the first pivot support layer together, with a second tranche at the 30,080 pivot on a shallow dip that holds. The stop sits below 29,820, and the targets run back to the settle, then the 30,244 to 30,272 band, then the 30,380 pivot on continuation. It's a data-day plan: retail sales land before the bell, and a hot number or a hot inflation-expectations print at ten voids the long. No entries before 9:45, and don't chase the band without a pullback or a confirmed break above it. How we grade these afterward is in our performance methodology.
The index that led the whole advance ran straight into the only wall it has not cleared, its own record, and positioning will now push it harder whichever way it breaks.
The leader ran into the one level it hasn't cleared. Whether Friday is a breakout or a double-top test, the mechanism underneath will make the answer bigger than the flow alone.
This is the read our members get every session, before the bell, with the levels drawn and the setup defined. See how the same dealer-positioning work turns into systematic signals.
View pricingThe complete data picture
Every number behind Thursday’s plan, charted first; the full numeric reference follows underneath.
Full numeric reference , every remaining figure from the review
| Average | Value | Settle vs |
|---|---|---|
| 5-day | 29,922 | +266 (about 1.2%) |
| 20-day | 29,079 | +1,109 (about 5.0%, extended) |
| 50-day | 29,523 | +665 |
| 100-day | 28,564 | +1,624 |
| 200-day | 27,193 | +2,995 (well above) |
| Level | Reference |
|---|---|
| 30,244 / 30,272 | prior-day and one-month high |
| 30,380 | first pivot resistance |
| 30,452 | one standard-deviation resistance |
| 30,561-30,573 | two-SD and second pivot stacked |
| 30,644 | three-SD resistance |
| 30,975-31,100 | 52-week high band, the record |
| Metric | Reading |
|---|---|
| Standing state | net SHORT gamma (amplifies) |
| Call / put gamma | -100M / -723M |
| Implied one-day move | about $8.48 (1.16%) |
| Put-to-call OI | 1.18 |
| IV rank / skew rank | about 25% / about 98% |
| Largest delta expiry | the very next session |
| Read | a clean break extends; a pivot loss accelerates |
| Input | |
|---|---|
| Producer inflation | benign, following in-line CPI |
| Sept hold odds | about two-thirds; a cut still live |
| 10-year yield | eased to 4.65% |
| Leadership | memory +5% offshore, SMCI +14%, Netflix +5% |
| AI news flow | dense: new models, capacity, inference tiers |
| Marquee chip earnings | late August, the test |
| When | Event |
|---|---|
| Fri 08:30 | US retail sales, core +0.2% vs -0.2% |
| Fri 10:00 | Michigan sentiment + inflation expectations |
| Fri 10:00 | US business inventories |
| Aug 21 | monthly options expiration |
| Aug 26 | core deflator + marquee semiconductor earnings |
| Aug 27-29 | central-bank symposium |



