
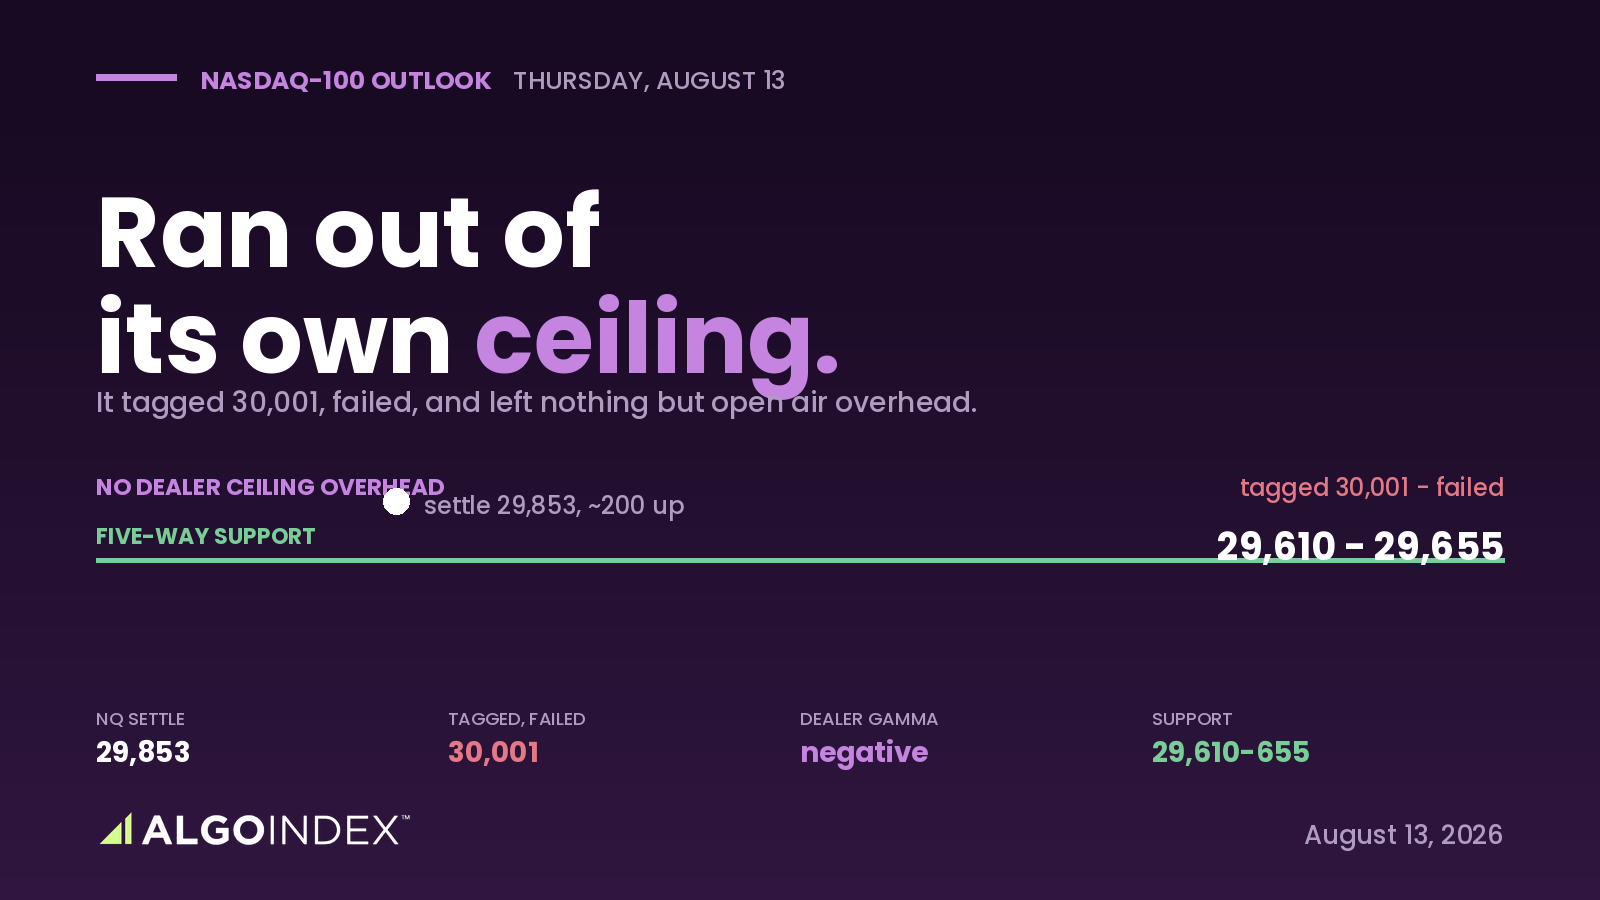
The Nasdaq-100 did something on Wednesday that changes how it trades into Thursday: it ran clean out of its own ceiling. The September contract settled at 29,853.25, up 0.71 percent against a broad index up only 0.26, and the recovery off the July low has now carried price straight through the entire dealer call structure. The primary call resistance sits below spot. There is no mechanical ceiling overhead.
That cuts both ways, and the reason is the gamma. Dealer positioning on this complex is negative on both the call side and the put side, which means hedging flows amplify direction rather than dampening it. So a break higher has nothing to cap it, and a break lower has nothing to catch it. The index tagged 30,000 in the first hour, failed there, and stair-stepped back to close 148 points below its high. Into a producer-price print on Thursday, that is a market with no brakes in either direction, and the 29,610 to 29,655 shelf is the line that decides which way it runs.
A rally built through one door
The advance was extraordinarily narrow. The memory segment rose 8 percent, a server maker jumped 19 percent, and two AI cloud names ran 19 and 34 percent, while a social-platform weight fell 3.38 percent and a software giant fell 2.26. A major device maker raised phone prices across the line citing a severe memory shortage, which is the same shortage repricing the memory suppliers upward, so the story is a physical scarcity rather than a sentiment shift. That is powerful while it holds. It is also fragile, because the index carries real software weight, and at some point the laggards either catch up or cap the advance. After the close, one AI-chip name missed badly on hardware and margin while another networking name beat and guided AI revenue higher. Two results pointing opposite ways on the same theme is why the overnight contract has not committed.
Soft in the middle, firming at the front
The intermediate structure is weaker than the settle suggests. The 20-day average sits 541 points below the 50-day, a bearish crossover the composite still flags as a sell, and it is a mathematical artifact of the late-July collapse that repairs on its own within two to three weeks if price holds. Against that soft backdrop, the front has inflected up: trend strength accelerates from 7 on a 100-day window to 24 on a 9-day, and the directional cross turned positive inside the last two weeks. Stochastics are pinned above 85 while relative strength sits near 55, the profile of a market that has moved fast but not far, which usually resolves sideways rather than through a sharp reversal.
Positioning favors the upside on any non-hostile number. Speculative funds are heavily short and offside after a 2,650-point recovery, skew sits at the 96th percentile, meaning the book is hedged rather than outright short, and a benign print decays that insurance into a bid rather than merely an absence of selling.
Buy the shelf, size for the amplification
The plan buys the 29,610 to 29,655 five-way confluence, where the first pivot support, the 9-day crossing, the 38.2 percent retracement, a volume node and the futures-translated inflection all stack inside 45 points, and where Tuesday evening's higher low must hold to keep the bullish sequence alive. The stop sits below 29,540, beneath the 2.0 projection, and targets run to 29,760, then the settle, then 29,985, taking the majority before the 30,014 to 30,074 grouping where the day's heaviest supply sits. Because gamma amplifies here, first touches overshoot, so the entry requires a five-minute close back above the shelf rather than a limit fill. A core producer print at 0.4 percent or higher voids it entirely. See how we track these setups in our performance methodology.
The recovery ran straight through its own ceiling, so there is nothing mechanical left to cap it, and nothing left to catch it either.
An index with no ceiling overhead and no shelf beneath it isn't safer, it's faster, and Thursday's number decides which direction the speed points.
This is the read our members get every session, before the bell, with the levels drawn and the setup defined. See how the same dealer-positioning work turns into systematic signals.
View pricingThe complete data picture
Every number behind Wednesday’s plan, charted first; the full numeric reference follows underneath.
Full numeric reference , every remaining figure from the review
| Average | Value | Spot vs |
|---|---|---|
| 5-day | 29,772.25 | +81 |
| 20-day | 28,988.40 | +864.85 (below 50-day: SELL) |
| 50-day | 29,529.48 | +323.77 |
| 100-day | 28,502.14 | +1,351.11 |
| 200-day | 27,174.32 | +2,678.93 |
| YTD | 27,489.78 | +2,363.47 |
| Proxy level | Futures equiv |
|---|---|
| Call resistance 730 | about 28,661 (BELOW spot) |
| Vol inflection 718 | about 29,611 |
| Gamma flip 711 | about 29,340 |
| Put support 660 | about 29,211 |
| Concentration strike 700 | about 29,111 |
| Gamma | negative both sides = amplifies |
| Metric | Reading |
|---|---|
| One-month implied / realized | 19.56% / 24.82% |
| Implied-vol rank / skew rank | 32.13% / 96.43% |
| Options-implied move | about 366 index pts (1.23%) |
| Call positioning / put positioning | -897.79M / -1.53B |
| Put-to-call OI | 1.17 |
| 25-delta risk reversal | -0.038 (put bid) |
| Top gamma expiry | Aug 20 |
| Read | heavily insured, lightly short |
| Cohort | Net |
|---|---|
| Leveraged funds | short 78,333 (+15,899 shorts, offside) |
| Asset managers | long 64,359 |
| Commercials | long 15,442 (covered shorts) |
| Read | fast money short, real money accumulating |
| Note | 8 days stale, predates about 2,650-pt recovery |
| Open interest | 274,618 |
| Input | |
|---|---|
| CPI | on forecast; core 2.5%, 5.5-year low |
| Sept hike odds | 40% from 51% |
| Memory / SMCI | +8% / +19.02% |
| Software | Meta -3.38%, Microsoft -2.26% |
| Cisco (AC) | beat + $7.5B FY27 AI revenue guide |
| Cerebras (AC) | hardware miss, margin 14% |
| When | Event |
|---|---|
| Thu 08:15 | Fed dissenter speaks |
| Thu 08:30 | US PPI 4.9% y/y, core monthly 0.3% |
| Thu 08:30 | Jobless claims 202k |
| Thu 13:00 | 30-year bond auction |
| Fri 08:30 | US retail sales |
| Aug 20-21 | proxy gamma expiry + monthly OPEX |



