
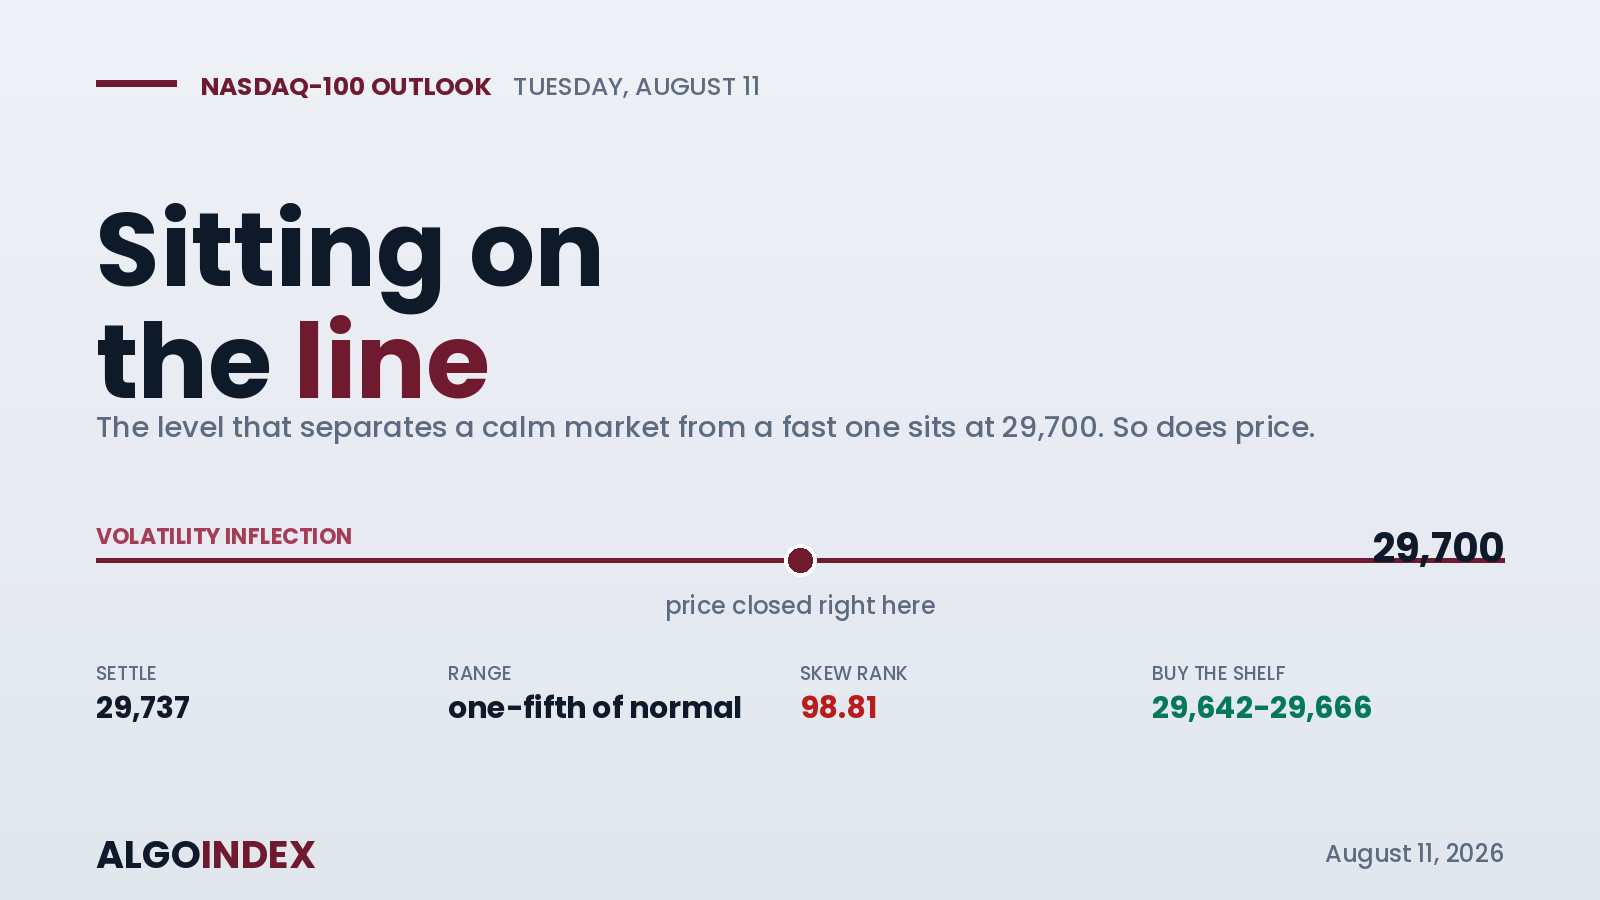
On a day that carried a five percent move in crude, a jump in yields, and open talk of rate hikes from the Federal Reserve, the Nasdaq-100 traded 122 points. That is less than a fifth of a normal day. A market that quiet, on news that loud, is telling you something.
The September contract settled at 29,737.00, off about a third of a percent, and the stillness has a precise cause. Mapped from the options proxy, the level that separates a dampened market from an amplified one sits at roughly 29,700 in futures terms, and that is exactly where price closed. When an index sits on that inflection line, realized range collapses, which is why a genuine macro shock produced almost no movement. The tension into Tuesday is that dealer positioning is supportive beneath the market and the trend has quietly turned up on the short windows, but traders have sold their downside protection to chase upside, leaving the composite skew at the 98.81 percentile. That is a market with the shock absorbers removed, entering a Wednesday inflation print.
This was rates, not technology
The Nasdaq underperformed the broad index by roughly a quarter point, and the reason is duration. Crude's five percent run pushed the 10-year to 4.70 percent, and long-duration growth is the most rate-sensitive corner of the market. The selling was in place before the Cleveland Fed comments crossed in the afternoon, which means rates drove the session and the policy remarks only reinforced it. The technology story itself did not weaken. After the close, the largest semiconductor weight's chief executive said no counterparty had declined the new AI financing push, and a major bank launched a 1.5 trillion dollar infrastructure initiative aimed at AI and defense. Neither is in Monday's price. The bid under the AI trade simply couldn't express itself while rates were moving against it.
A young turn inside a flat quarter
Zoom out and this index has gone nowhere for a quarter. It spiked to 31,100 in early June, sold hard to 27,201 by late July, and has clawed back roughly 2,500 points in eight sessions without reclaiming the June high. Price sits above every major moving average, but the 20-day is still below the 50-day, so the recovery has outrun the averages it left behind. The most useful reading is the directional index: it strengthens as the window shortens, positive direction now leads negative on the 9 and 14-day, and the crossover happened somewhere in the last two to three weeks. That is a young upward turn, and it is the strongest argument for buying weakness rather than selling it.
Against it, stochastics are pinned in the high 80s after a five-day decline, which is compression rather than strength, and the composite has improved to 56 percent buy but stopped advancing. This is a market compressed on its inflection line, not one trending off it.
The shelf that already held
The 29,666 low wasn't just printed on Monday, it was bought, the same way dips kept getting caught through the eight-session recovery off the July 29 bottom. Between 29,642 and 29,666 sit three independent methods: Monday's low, the 14-day stochastic stall, and the first computed support. One of them was already tested and defended. That is where a long is defensible with a tight, structurally justified stop, and dealer positioning maps supportive well beneath it, with the gamma flip equivalent near 29,290.
There's fuel overhead, too. Speculative funds are net short 135,430 contracts on this index and pressed that short into the rally. Reclaim the 29,813 pivot and then the 29,910 grouping, and that short book becomes a covering source. Lose the shelf, and those same shorts get defended rather than covered, which cuts both ways.
The index is parked on the exact line that separates a calm market from a fast one, which is why nothing moved.
A positioning session, not a conviction one
Tuesday's only scheduled US items are second-order: existing home sales at 10:00 and the three-year note auction at 1:00, which is the one that can move this index through the duration channel. Flow is concentrated almost entirely in same-day options, which is another way of saying nobody has conviction past the current session. So the plan buys the 29,642 to 29,670 shelf on a test that holds, stops below 29,540 where the short-term structure breaks, and works targets at 29,788, then the 29,867 to 29,910 grouping, then 29,954. Keep it small. The reward on committing size Tuesday is poor next to committing it after Wednesday's number. See how we track these setups in our performance methodology.
Sitting on the line is a decision deferred, and the inflation print is what finally forces it.
This is the read our members get every session, before the bell, with the levels drawn and the setup defined. See how the same dealer-positioning work turns into systematic signals.
View pricingThe complete data picture
Every number behind Monday’s plan, charted first; the full numeric reference follows underneath.
Full numeric reference , every remaining figure from the review
| Average | Value | Spot vs |
|---|---|---|
| 5-day | 29,675.20 | +62 (the working line) |
| 20-day | 28,954.93 | +782 (below 50-day) |
| 50-day | 29,574.97 | +162 |
| 100-day | 28,395.72 | +1,341 |
| 200-day | 27,140.56 | +2,596 |
| YTD | 27,459.65 | +2,277 |
| Proxy level | Futures equiv |
|---|---|
| Call-side concentration 730 | about 30,110 |
| High-vol point 729 | about 30,070 |
| Vol inflection 720 | about 29,700 (spot) |
| Gamma flip 710 | about 29,290 |
| Primary concentration 700 | about 28,880 |
| Put-side concentration 660 | about 27,230 |
| Metric | Reading |
|---|---|
| One-month implied / realized | 20.30% / 26.05% |
| Implied-vol rank | 37.13% |
| Skew rank | 98.81% |
| Options-implied one-day move | about 217 futures pts (0.73%) |
| Call gamma / put gamma | -473.89M / -1.16B |
| Put-to-call OI / volume | 1.18 / put-heavy |
| Real-time hedging delta | -4B (0DTE call selling) |
| Heaviest gamma/delta expiry | Aug 20 |
| Cohort | Net |
|---|---|
| Leveraged funds | short 78,333 (+15,899 shorts) |
| Asset managers | net long |
| Dealers | long, covered 19,372 shorts |
| Commercials | long, covered 21,883 shorts |
| Non-commercials | short (+20,536 shorts) |
| Open interest | 275,147 |
| Input | |
|---|---|
| 10-year yield | 4.70%, +5 bps on crude |
| WTI crude | +5% |
| Nasdaq vs broad index | -0.34% vs -0.06% |
| Cleveland Fed | hawkish, hikes probably needed |
| After-close AI news | 1.5T infra initiative + chip-CEO financing (unpriced) |
| Volatility index | 15.46, +4% intraday |
| When | Event |
|---|---|
| Tue 13:00 | US 3-year note auction (highest-impact scheduled) |
| Tue 16:05 | Server-maker earnings |
| Wed 08:30 | US CPI 0.1% m/m, 3.4% y/y |
| Wed 16:05 | Networking major earnings |
| Thu 08:30 | US PPI + claims + Fed speakers |
| Fri 08:30 | US retail sales |



