
By the time the cash bell approaches, the Nasdaq-100 E-mini has spent the entire overnight session moving in one direction. The front month opened near 29,282, bottomed within the first few minutes at 29,280, and never looked back, pressing up to 29,746 and closing the globex bar within a few points of that high. A 97% closing range and a 1.58% high-to-low swing tell the whole story: buyers controlled the session from the open, and supply did not appear until price reached the prior session's value highs.
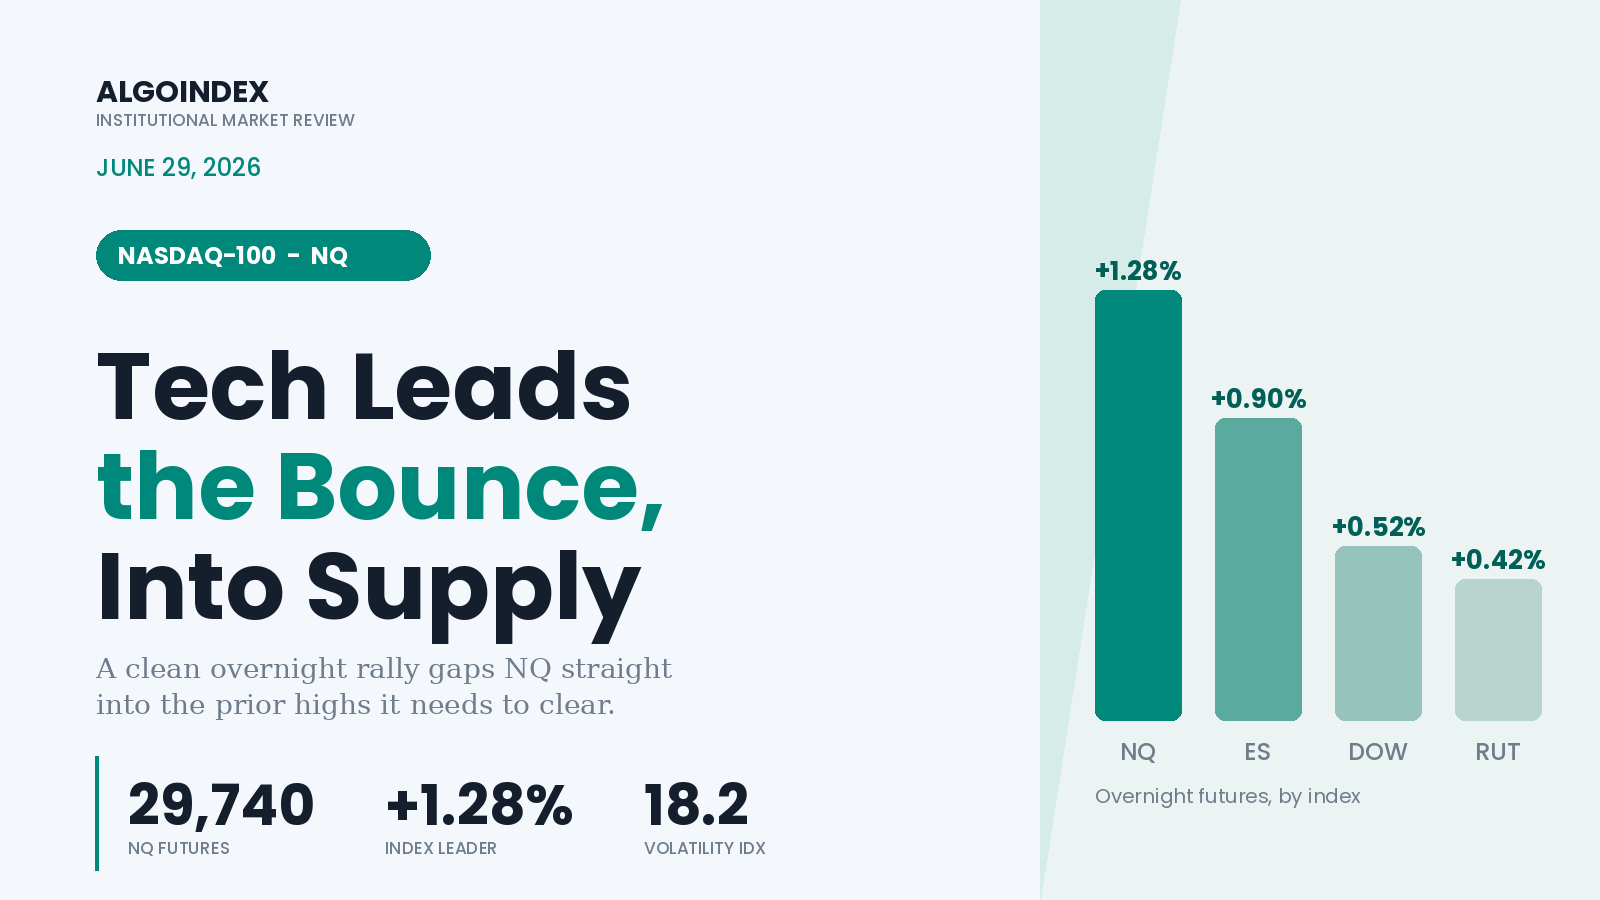
The advance is being led by technology, and the leadership ordering is itself the signal. NQ is up about 1.28% against roughly 0.90% for the S&P contract, 0.52% for the Dow, and 0.42% for the Russell. Large-cap tech first, small-caps last, is a risk-on configuration and a direct reversal of Friday's internal rotation, when capital exited the semiconductor complex and crowded into software. The structural contradiction into today is that this powerful overnight momentum is gapping straight into overhead supply, the prior-session highs near 29,745 and a short-term moving-average band between roughly 29,780 and 29,995, while the index remains down 2.7% on the week even as it holds enormous three-month and one-year gains. Today's gap is a sharp bounce inside a two-week pullback, and the question for the cash session is whether it holds its gains or fades back toward the shelf it just cleared.
Bias for the session is cautiously constructive with moderate conviction. The path of least resistance overnight was up, but price is arriving at resistance into a quarter-end session carrying month-end rebalancing flows and a leading-indicator data point at 9:45 ET. The preferred posture is to buy strength that holds above the prior settle and pivot shelf rather than to chase the gap directly into supply.
A bounce that has not yet earned a trend rating
On the daily chart NQ is recovering inside a corrective pullback. The trailing one-week return is about negative 2.7% and the one-month is about negative 1.9%, but the trend underneath remains firmly up: three-month, six-month, year-to-date, and one-year returns are all strongly positive, the year-to-date alone up about 17% and the one-year up about 31%. The prior-month high and 13-week high both sit at 31,100, the controlling overhead objective and the measuring stick for whether this bounce becomes a trend resumption. Price near 29,740 has reclaimed roughly two-thirds of the recent decline overnight.
Momentum is neutral-to-improving rather than extended. The 14-period strength midpoint computes right where price is trading, near 29,746, meaning the open is balanced with neither overbought nor oversold conditions. The multi-indicator composite reads only a weak 16% buy, reflecting that several medium- and long-term trend studies remain in a hold posture after the two-week pullback even as short-term signals turn up. This is an early-stage bounce, so confirmation from the cash open and from internals will matter more than the overnight drive.
Sitting on the pivot, in a market that amplifies
Dealer-positioning levels here are read from the Nasdaq-100 ETF proxy and should be treated as a proxy for index gamma, not native futures levels. The proxy trades near 705.5, essentially unchanged from its prior close, with its high-volatility inflection computed right at 705. That placement matters: price is sitting directly on its key gamma pivot, and net put gamma in the proxy reads about negative 1.7 billion. When price coincides with the inflection and net dealer gamma is negative, intraday moves tend to be amplified rather than dampened, so both continuations and reversals can extend further than usual.
On a market-wide basis, the latest desk note had the broad index closing just below its risk pivot near 7,380 with a volatility inflection at 7,400 as resistance and support tiers at 7,300 and 7,100. Broad-index futures have since gapped back above both overnight, so the market is now attempting to reclaim the very shelf the note flagged. The same note highlighted declining implied volatility across the curve and longer-dated defensive put buying, plus a week of catalysts: a large quarterly collar roll Tuesday, the monthly jobs report Thursday, and a shortened pre-holiday session Friday.
The macro tailwind, and its caveat
The backdrop is mildly supportive for equities. The dollar index is soft near 101.2 and the 10-year Treasury yield is steady near 4.37%, a neutral-to-slightly-positive tailwind for high-duration technology names with no Fed decision today. Cross-asset signals lean risk-on across the board: volatility down, dollar soft, crude firm but paring near 69.7, and gold lower by about 1.1% near 4,050, consistent with capital rotating toward risk and away from defensives.
Two caveats sit underneath the strength. First, Friday's rotation out of semiconductors and into software means leadership within tech is uneven, and semiconductor breadth tends to set the ceiling for sustained Nasdaq trend days; today's price action will reveal whether buyers return to the chip names. Second, positioning data showed defensive undertones beneath a calm surface, with a meaningful negative cumulative-delta reading in the broad index pointing to index-level hedging via longer-dated put buying. That hedging sits underneath a market now gapping higher, so a portion of today's strength may meet supply from hedgers and from quarter-end rebalancing.
No entries before 9:45 ET. The opening drive decides whether the gap is being accepted, with price holding above the prior close near 29,368 and building value near the highs, or rejected, fading toward and through it. The 9:45 ET Midwest business barometer lands precisely at the end of the opening range, with consensus near 55 against a prior 62.7, so the first clean signal may come immediately after the release rather than at the bell. Quarter-end and month-end rebalancing can dominate the afternoon and concentrate in the final hour.
The overnight session did the easy part. The hard part is the 200 points of supply directly overhead, where last week's sellers are still standing.
The broad-index view: why the S&P bounce runs into a wall. On the dealer-positioning levels referenced above: call walls and put walls explained.
See how AlgoIndex turns this kind of read into systematic, rules-based signals.
View pricing →


