
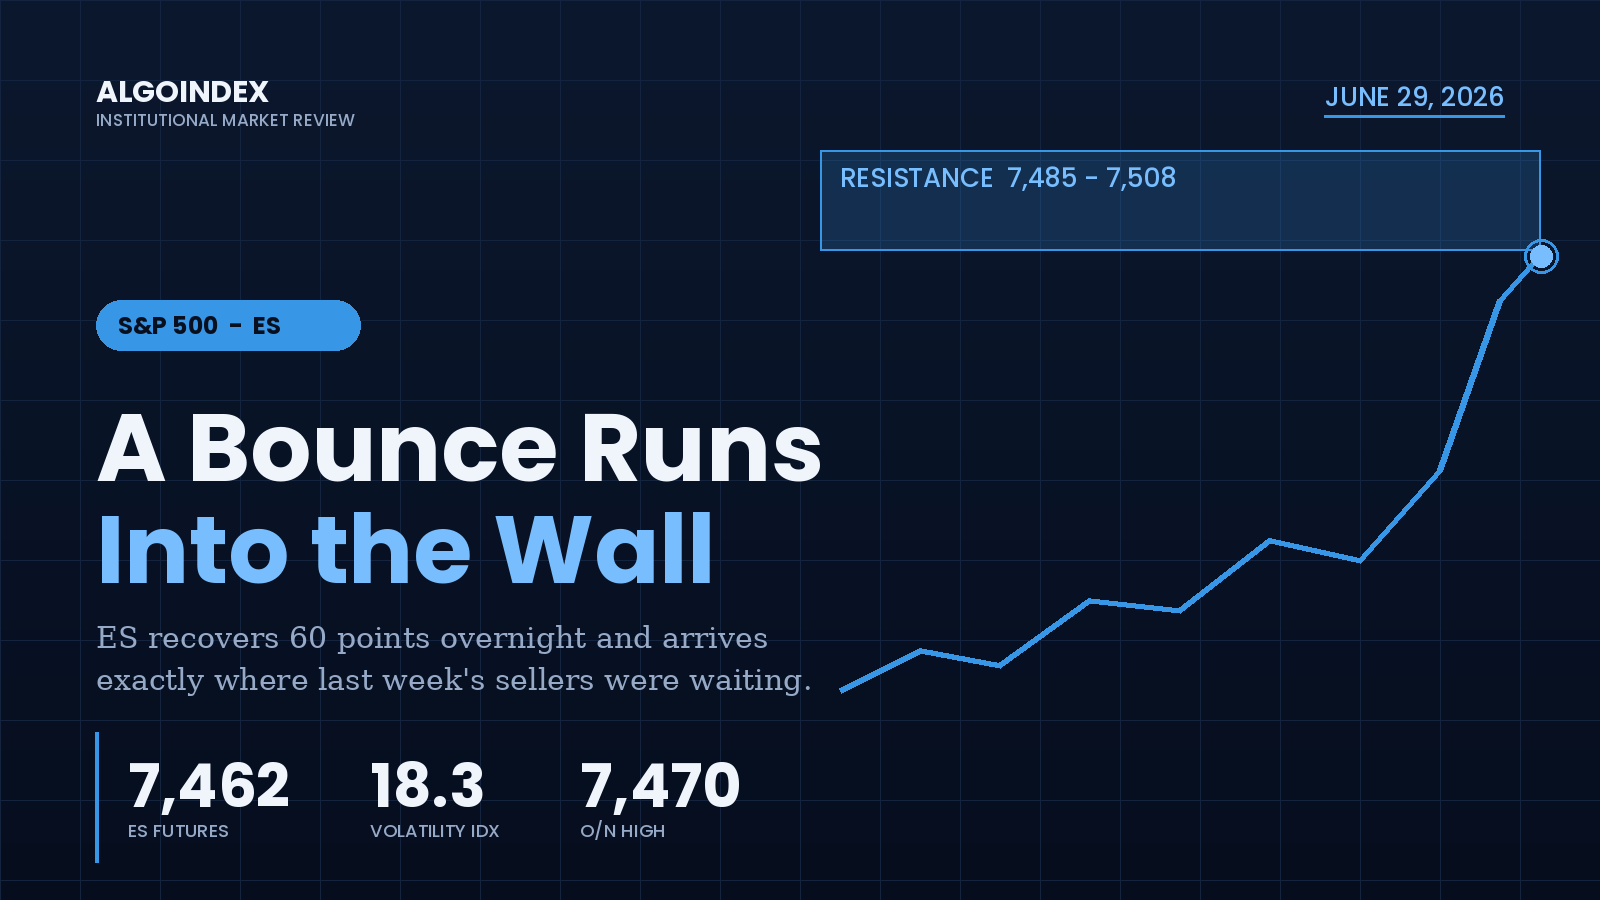
At 7,462, with sixty points already clawed back from Friday's settle, the S&P 500 E-mini arrives Monday at the one level it could not hold last week. The September contract spent the overnight session repairing the damage from a risk-off Friday, climbing in an orderly stair-step from 7,398 to a high of 7,470.50, and it now presses into the same band of overhead supply where sellers were active for most of last week.
The recovery is real, but so is the resistance directly above it. The underlying cash index has reclaimed the dealer-positioning inflection near 7,380 that acted as the bull-bear line for days, which turns the options backdrop supportive and mean-reverting. The catch is that price is now pinned beneath a dense shelf where the prior overnight high, the reset of the short and medium daily averages between roughly 7,485 and 7,508, and the second computed resistance all converge. Whether this is the start of a durable reclaim or a relief bounce into a wall is the question the cash session has to answer, and it has to answer it the day before quarter-end, a large quarterly options expiration, and the JOLTS labor report.
Net bias for the session is cautiously constructive with moderate conviction. The bounce deserves the benefit of the doubt while the underlying holds its inflection, but the immediate path is gated by that resistance shelf. The higher-probability long is a continuation entry that requires the market to first prove it can hold above the overnight high, not a bet placed in anticipation of it.
The decision band overhead
Friday's regular session was a distribution day wearing a flat headline. The cash index closed essentially unchanged near 7,354, but underneath, capital rotated hard out of chip names, with the semiconductor complex off roughly 4%, and into software, which gained roughly 4%. The trigger was overseas: Korea's primary index fell more than 5% on heavy losses in major memory and foundry names, plus a report that a large artificial-intelligence platform may delay its public listing. The Nasdaq 100 underperformed sharply while the broad index was cushioned by the rotation.
On the daily chart the contract sits below its recent four-week high near 7,694, which is also the 52-week high, and the five-day change remains negative at about 1.08%. This morning's strength is a bounce inside a week that trended lower, not a fresh breakout. Price near 7,462 still trades below the 9-day average near 7,485, the 18-day near 7,500, and the 40-day near 7,506, so the daily averages now act as overhead resistance rather than support. A decisive reclaim of the 7,485 to 7,508 band is the single most important technical event to watch, because it would flip the daily posture from corrective to constructive.
Momentum agrees that this is repair, not launch. The 14-day strength reading sits near 48.7, squarely neutral, with its midpoint calculated near 7,479, right at the lower edge of the average resistance. The multi-indicator composite reads a weak 32% buy, a soft signal that argues against chasing strength. Realized one-month volatility near 16.9% is running above one-month implied near 14.9%, the implied volatility percentile is low near 29%, and the downside skew rank is elevated near 67%. Translation: headline volatility is compressing, but protection is still being paid for.
What the options market is signaling
The cash S&P 500 is this contract's primary options-flow surface, and the single most important development is the reclaim of the inflection near 7,380. Above it, the positioning lens turns supportive and mean-reverting. Below it, the same flows become a downside accelerant. The volatility inflection marker sits near 7,400 and capped Friday's trade, so the index is now pressing on that level from below, with named resistance steps at 7,400 and 7,500 in cash terms.
The day's call-side positioning notional sits near $3.0 billion against put-side near $2.1 billion, and the major upside concentration, a strong magnet and resistance, sits far overhead near 7,680 in the cash domain. Real-time hedging flows last week were dominated by longer-dated put buying, a defensive footprint, while implied volatility compressed across the curve, with expirations ahead of the holiday falling one to three volatility points. That compression generates supportive hedging that dampens intraday swings. The practical read for the E-mini: constructive while the underlying holds the inflection, but capped by defensive positioning until the cash index can clear and hold above 7,400 and then 7,500.
Where the macro cuts
Positioning data shows the U.S. dollar remaining the largest long across the major currencies after more buying last week, a mildly restrictive backdrop for risk assets that has not, so far, prevented the recovery. With the prior week's core inflation print digested, the rates picture is in a holding pattern and the market's attention turns to tomorrow's labor-demand data. Desk commentary frames the sharp upside as on hold until softer inflation or cooler activity arrives.
The dominant equity story is the artificial-intelligence and semiconductor complex, and right now it is a source of drag rather than leadership. Friday's chip selloff, echoed by overseas memory and foundry weakness, put the highest-beta corner of the market on the back foot. The rotation into software shows capital is staying in the market but moving down the volatility ladder, a defensive signal worth respecting. The most market-relevant overnight headline was a report that Iran has requested a meeting in Doha the following day, which the market is reading as de-escalation and which is a meaningful contributor to the risk-on tone. Any reversal of that narrative would quickly re-introduce a risk premium. Across assets the picture is calm: crude near 70.3, gold near 4,036, the volatility index near 18.3, and an overseas manufacturing survey that printed a marginal 50.1 expansion.
Defensive positioning is a double-edged condition: it caps the velocity of any rally, but it also means a portion of the market is already hedged, which can blunt the downside if selling resumes.
The session script
No positions are taken in the first fifteen minutes; the opening range defines the day's reference band. The constructive path sees buyers reclaim and hold 7,470, then work into the 7,485 to 7,508 resistance band where the first real test of the recovery occurs. The corrective path sees the morning fail at 7,470, rotate back through the 7,455 shelf, and retest the 7,406 pivot and the 7,398 to 7,401 pocket. Given mixed momentum and defensive positioning, a probe-and-fade into resistance is at least as likely as a clean breakout. The afternoon is conditioned by positioning into tomorrow's expiration, with late-day adjustments capable of adding two-sided volatility in the final hour.
The data slate is light but not empty. The first-order release is a regional business activity survey near 9:45 ET, followed by a regional manufacturing index near 10:30 ET; both are second-tier but can move a quiet pre-holiday morning. The larger event is tomorrow's combination of quarter-end, quarterly options expiration, and the JOLTS labor report.
Reclaim the shelf and the daily trend posture flips with it; fail at it, and the pivot at 7,406 becomes the magnet into expiration. The averages sit right where the recovery has to prove itself, waiting for the cash session to cast the deciding vote.
Today across the complex: the Nasdaq leads the bounce into supply. Background on tomorrow's setup: how triple-witching expiration moves the market.
See how AlgoIndex turns this kind of read into systematic, rules-based signals.
View pricing →Next session: S&P 500 quarter-end, positive gamma returns and the call wall at 7,561.



