
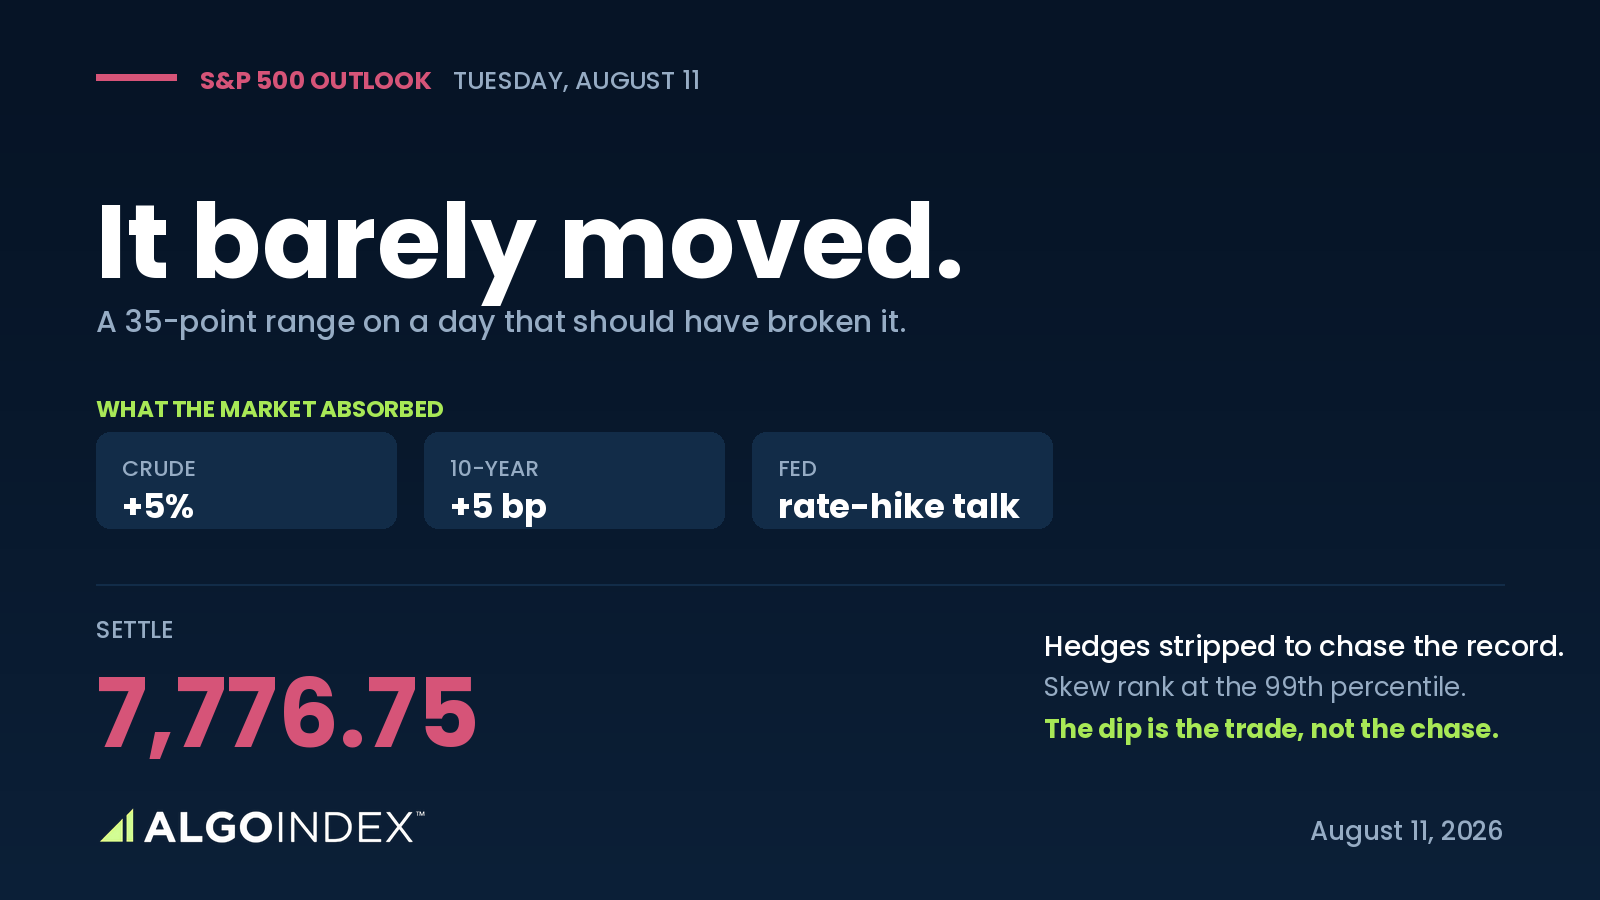
By the closing bell on Monday, the S&P 500 had done something that should not be possible. It absorbed a five percent move in crude oil, a five basis point jump in the 10-year yield, and a Federal Reserve official openly talking about rate hikes, and it gave back five and a half points. Thirty-five points, high to low, on a day like that.
That compression is the whole story. The September E-mini settled at 7,776.75, sitting 43 points under the record it set last Wednesday, and the reason it barely moved is mechanical. Dealers are short a wall of put positions between roughly 7,624 and 7,774 in futures terms, and as price slid toward the bottom of that band in the early afternoon, those dealers were structurally forced to buy. That is what held a five percent oil shock to a 35-point range. Here's the catch. The same options market that provides that base of support has also stripped out its downside protection to chase the record, and the composite skew reading sits at the 99.60 percentile. A market with a mechanical cushion under it and no hedges left in it is a compressed spring, and Wednesday's inflation print is the release.
Why a quiet day is the loud signal
Start with what actually moved the market, because it tells you how to trade Tuesday. This wasn't about the economy. Crude ran more than five percent on a chain of energy headlines: a drone strike on a fuel storage tank at a Libyan refinery, and a presidential post demanding compensation from Iran. Higher oil fed straight into inflation expectations, which lifted the 10-year to 4.70 percent, and a long-duration index sells off when rates rise. Then the Cleveland Fed president added that she sees no trouble in the job market, that inflation isn't coming down on its own, and that policy would probably need some rate hikes. Two days before a CPI report, that is a live threat.
And here's the part that sets your size. The options market is pricing Tuesday cheap. One-month implied volatility reads 12.08 percent against realized of 14.34, and the implied-volatility rank sits at the 11th percentile of its own year. Cheap protection, into a known catalyst, with the crowd's hedges already gone. The real event isn't Tuesday. It's Wednesday at 8:30.
A trend that's still accelerating
The technical stack is as clean as it gets. Price sits above every moving average, and the multi-indicator composite reads a full 100 percent buy across all thirteen studies. The detail that matters most is the directional index, because it's accelerating rather than fading. The 9-day reading is 34.77 with positive direction beating negative by better than two to one, while the 50-day sits at 8.82. Translated, the move of the last two weeks is stronger than anything in the two months before it. This is a young, forceful push out of a long base.
The caution flag is momentum. Stochastics are pinned above 90 percent on every window out to 100 days, and being that stretched on a long lookback is a statement about how far this market has run without resting. It isn't a sell signal, and strong trends hold these readings for weeks, but it does mean new longs are paying up. That's why we want the dip, not the chase.
Where the buyers keep showing up
We flagged the 7,725 shelf on Friday and it held into the payroll release. Monday the market built the next one 30 points higher and defended it on a five percent oil move. Look at what stacks up between 7,756.93 and 7,763.00: the first standard-deviation support, the first computed support, the 5-day average, and Monday's session low. Four independent methods inside six points, and that band sits squarely in the dealer short-put zone where hedging flows work in a buyer's favor.
Positioning leans the same way. Asset managers hold a 937,000-contract structural long, and speculative funds added more than 82,000 shorts into the advance. A market that grinds higher against an expanding fast-money short base makes its own buying pressure when those shorts have to cover. None of that guarantees direction, but it stacks the odds behind the shelf holding.
A market that closes strong on the day it absorbs a five percent oil move is not a market that wants to break.
The plan is small and tactical
Tuesday carries no first-order US data. The one scheduled item with teeth is the 1:00 PM three-year note auction, and a weak result into a hawkish Fed and a 4.70 percent 10-year is the most plausible route to a real break of support. So the plan buys the 7,756 to 7,764 shelf on a rejection candle with declining volume, stops below 7,741 where all three lower supports would have to fail, and works targets at the 7,779 pivot, then 7,795, then 7,814. Take profits rather than hold for extension, and be flat before the print. The record wall at 7,814 to 7,820 is a four-way grouping and a low-quality place to chase without a driver behind it. How we grade these calls after the fact is in our performance methodology.
The cushion and the missing hedges are the same fact seen twice, and Wednesday morning decides which one the market feels first.
This is the read our members get every session, before the bell, with the levels drawn and the setup defined. See how the same dealer-positioning work turns into systematic signals.
View pricingThe complete data picture
Every number behind Monday’s plan, charted first; the full numeric reference follows underneath.
Full numeric reference , every remaining figure from the review
| Average | Value | Settle vs |
|---|---|---|
| 5-day | 7,762.95 | +13.80 (inside support) |
| 20-day | 7,580.90 | +195.85 |
| 50-day | 7,552.61 | +224.14 |
| 100-day | 7,349.05 | +427.70 |
| 200-day | 7,168.20 | +608.55 |
| YTD | 7,225.35 | +551.40 |
| Level | Reference |
|---|---|
| 7,721.00-7,725.50 | third computed support + swing low |
| 7,704 | desk structural pivot (futures) |
| 7,678.28 | 9-day average crossover |
| 7,580.90 | 20-day average |
| 7,567.74 | 18-day average crossover |
| 7,552.61 | 50-day average |
| Metric | Reading |
|---|---|
| One-month implied / realized | 12.08% / 14.34% |
| Implied-vol rank | 11.19% |
| Options-implied move | 59.15 index points |
| Composite skew rank | 99.60% (near record) |
| Call vs put positioning | +1.09B vs -4.35B |
| Put-to-call OI / volume | 1.28 / 1.52 |
| Real-time hedging delta | -4B (0DTE call selling) |
| Dealer short-put support | 7,624-7,774 futures |
| Cohort | Net |
|---|---|
| Asset managers | long 937,033 |
| Leveraged funds | short 329,999 (+82,598 shorts) |
| Dealers / intermediaries | short 716,826 |
| Commercials | short 84,376 |
| Non-commercials | short 27,258 |
| Front-contract open interest | 2,064,770 |
| Input | |
|---|---|
| WTI crude | +5% to 82.10 (Brent above 87) |
| 10-year yield | 4.70%, +5 bps |
| Dollar index | 99.807, +0.20% |
| Cleveland Fed | hawkish: rate hikes probably needed |
| Volatility index | 15.45, +3.76% |
| Gold | 4,458.0, +0.87% (geopolitical bid) |
| When | Event |
|---|---|
| Tue 13:00 | US 3-year note auction (the day’s key event) |
| Tue 16:05 | Server-maker earnings |
| Wed 08:30 | US CPI: 0.1% m/m, 3.4% y/y, core 0.2%/2.5% |
| Wed 10:30 | Crude inventories |
| Thu 08:30 | US PPI + jobless claims + Fed speakers |
| Fri 08:30 | US retail sales |



