
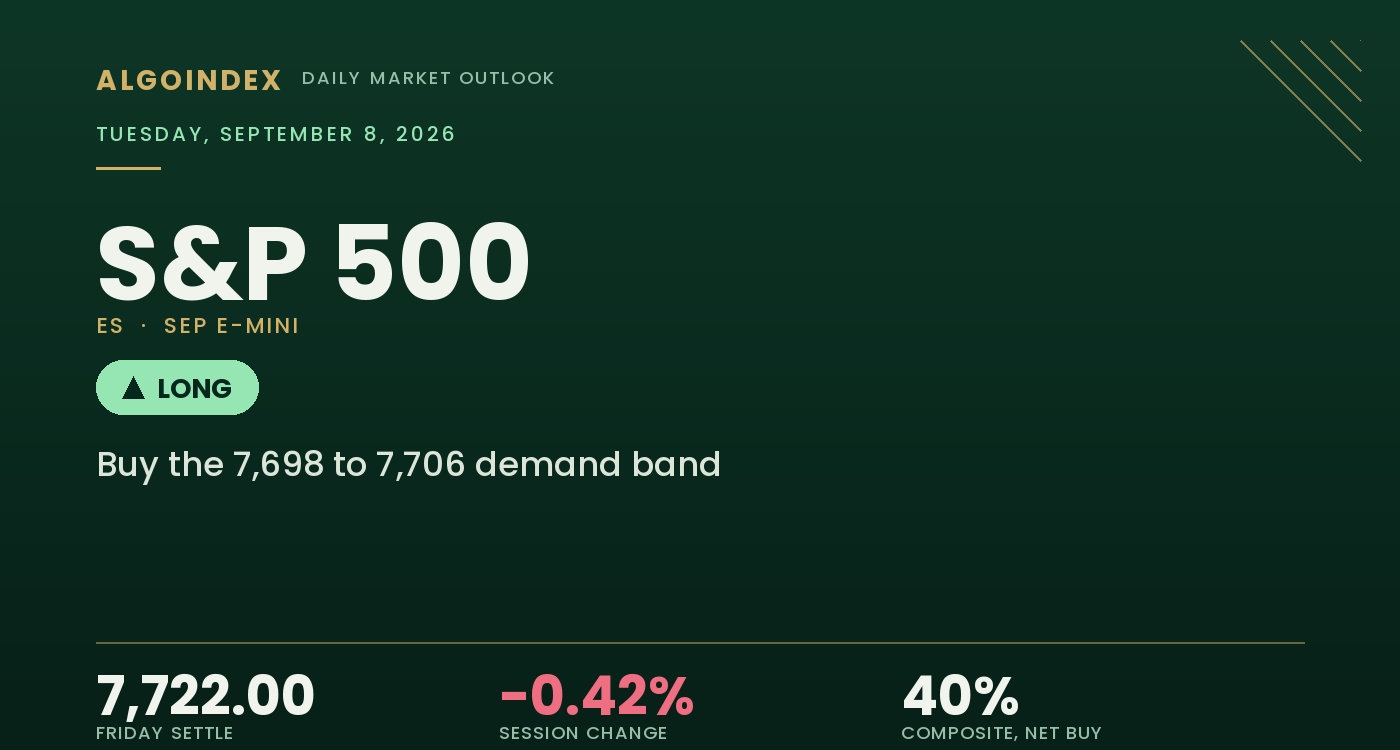
The September E-mini settled Friday at 7,722.00 (SPX 7,719), down 32.75 points or 0.42 percent, in a session that opened at 7,749.75, stretched to 7,764.50 and spent the balance of the day grinding toward the lower end of a 52.75 point range before basing at 7,711.75 and finishing at 19 percent of the range, a seller's finish. The cash index closed at 7,718.60, down 0.38 percent. The driver arrived early and was singular. The August employment report at 8:30 AM ET printed payrolls of 162,000 against a 55,000 consensus, the prior month was revised from a 23,000 decline to a 21,000 gain, private payrolls came in at 127,000 against 50,000, the workweek lengthened to 34.4 hours and average hourly earnings accelerated to 0.3 percent monthly. Rate futures moved the implied chance of a September increase to between 58 and 60 percent from roughly 52 percent, and short-dated Treasuries sold off alongside equities, the signature of a rates event rather than a growth scare.
The structural tension into Tuesday is sharp. A market pricing a live chance of a rate increase in twelve days should be repricing volatility upward; it did the opposite. Implied volatility on the cash index sits at an 8.07 percent rank, one-month implied at 12.10 percent against realized of 7.57 percent, and dealer positioning is firmly long gamma with a 1.322 tilt and positive 1.123 billion dollars of notional, which mechanically dampens range. Trend has gone quiet as well, the 14-day directional index at 13.04 and the multi-indicator composite decayed from 100 percent buy a month ago to 40 percent Friday. The result is a hawkish macro repricing landing on a compressed, positively hedged and directionless market immediately before a three-day weekend and a data-light Tuesday whose only first-order event is a 1:00 PM ET three-year note auction.
A hawkish payrolls print that failed to lift volatility
The mechanical case for a bounce starts with dealer positioning. Gamma tilt on the cash index reads 1.322 and market-maker gamma notional a positive 1.123 billion dollars, the largest positive reading across the index and fund complex, an arrangement that pulls price toward the centre of the mapped range and has hedgers selling strength and buying weakness. The settle at 7,722.00 (SPX 7,719) sits 68.12 points above the modeled gamma-flip level at 7,653.88 (SPX 7,644), so the compressed, dampening structure remains in force. Price also holds above every average from the 50-day out, the 50-day at 7,622.46 some 99.54 points below the settle, the 100-day at 7,529.62 and the 200-day at 7,234.30 far beneath, so the intermediate uptrend is intact even after the short-term average was lost.
The qualifier is the 20-day loss and the trend vacuum. The single most important daily fact is that the settle now sits below the 20-day moving average at 7,724.95 (SPX 7,722) by 2.95 points, the first average in the stack to flip against price and the one component of the composite reading outright sell. The trend measures describe essentially no trend: the 14-day directional index at 13.04, the 20-day at 10.47, and historic volatility compressed to 7.99 percent on the 20-day against 12.22 percent on the 100-day. The multi-indicator composite finished at 40 percent buy, its short-term panel averaging 20 percent, and its trajectory is the warning, 100 percent a month ago to 64 percent Thursday to 40 percent Friday. The invalidation is a sustained trade beneath 7,676, below the 7,679 to 7,683 shelf whose loss opens the modeled gamma-flip level and changes the compressed environment.
The 7,698 to 7,706 support band and the 7,732 to 7,754 resistance shelf frame Tuesday
Two zones define the session. Below the settle, the 7,698 to 7,706 (SPX 7,695 to 7,703) band is the densest confluence near price, where the first pivot support at 7,701.00 with a 92.28 positioning conviction score, the 9-day average crossing at 7,706.19 and the 38.2 percent retracement from the four-week low at 7,702.54 converge, and it is where a pullback is bought. Above, the first obstacle is the 20-day at 7,724.95 with the modeled volatility threshold at 7,729.88 (SPX 7,720) immediately over it, then the pivot at 7,732.75 (SPX 7,729) at the centre of Friday's range, then the 7,753.75 (SPX 7,750) first pivot resistance reinforced by the 38.2 percent retracement from the four-week high at 7,754.46. The volatility surface reads cheap, an 8.07 percent implied-volatility rank and a mild put skew, protection inexpensive into a data-light Tuesday whose one first-order event is the afternoon auction.
Buy the pullback into the support band, respect the shelf, mind the auction
The plan buys a pullback into the 7,698 to 7,706 (SPX 7,695 to 7,703) band where the first pivot support at 7,701.00, the 9-day crossing at 7,706.19 and the 38.2 percent retracement from the four-week low at 7,702.54 overlap alongside the highest positioning conviction score near price. The stop is 7,676 (SPX 7,673), beneath the second pivot support at 7,680.00 and the one standard deviation support at 7,679.26 and below the 7,679 to 7,683 shelf, about 26 points from the 7,702 entry midpoint, so the position exits only after the invalidation area gives way. Targets run to 7,732.75 (SPX 7,729), the pivot and the natural magnet in a positive-gamma session, then 7,753.75 (SPX 7,750), the first pivot resistance paired with the 38.2 percent retracement from the four-week high at 7,754.46, then an extended 7,782 (SPX 7,779) at the two standard deviation resistance and charted extension, reachable only if momentum extends through the second target on expanding volume, for roughly one-to-1.2, one-to-2.0 and one-to-3.1 reward-to-risk. Two developments override the level map in real time. A weak three-year note auction at 1:00 PM ET, a tail against a soft cover relative to the prior 2.710, would confirm the market is genuinely repricing the policy path and would likely carry the contract through 7,701 regardless of positioning. A weekend development involving Iran or the Strait, or an escalation of the policy story around the semiconductor complex that led Friday, would do the same; in either case the setup is void rather than merely stopped. A sustained session beneath 7,676 exposes the modeled gamma-flip level at 7,653.88 and the 7,645 to 7,648 confluence beneath it. Our published record lays out how we grade these calls.
Friday repriced the policy path higher on a strong payrolls print, yet the E-mini settled at 7,722.00 at only 19 percent of its range and just beneath the 20-day average, the first average to flip against price. The contract is boxed between a support confluence at 7,698 to 7,706 and an overhead shelf that runs from the 7,724.95 average through the 7,732.75 pivot to 7,753.75, with positive dealer positioning dampening realized movement and a 1:00 PM ET three-year note auction the print that resolves the tension. The 7,698 to 7,706 band is where a pullback is bought, the 7,732 to 7,754 shelf is the first objective, and a sustained trade beneath 7,676 is what would open the modeled gamma-flip level and change the compressed environment.
A hawkish payrolls print that failed to lift volatility, on a market pinned by positive dealer gamma, is a pullback to buy into support, not a level to chase. The edge is the 7,698 to 7,706 (SPX 7,695 to 7,703) support confluence, and the failure is a sustained session beneath 7,676 or a weak three-year note auction at 1:00 PM ET.
This is the read our members get every session, before the bell, with the levels drawn and the setup defined. See how the same dealer-positioning work turns into systematic signals.
View pricingThe complete data picture
Every number behind Tuesday’s plan, charted first; the full numeric reference follows underneath.
Full numeric reference, every remaining figure from the review
| Average | Value | Settle vs |
|---|---|---|
| 5-day | 7,699.00 | below spot by 23.00, the short average the advance still holds above |
| 20-day | 7,724.95 | above spot by 2.95, the first average to flip against price and the one composite component reading outright sell |
| 50-day | 7,622.46 | below spot by 99.54, the line that keeps the intermediate uptrend intact |
| 100-day | 7,529.62 | below spot by 192.38 |
| 200-day | 7,234.30 | below spot by 487.70 |
| Level | Reference |
|---|---|
| 8,010 | primary gamma concentration strike, cash 8,000 |
| 7,838.50 | August 13 contract high and 52-week high, cash 7,835 |
| 7,809.88 | call-side hedging boundary, cash 7,800 |
| 7,806.50 | third pivot resistance with the three standard deviation band 7,796.03, cash 7,803 |
| 7,785.50 | second pivot resistance with two standard deviation resistance 7,782.45 and the charted extension 7,782.50, cash 7,782 |
| 7,766.50 | the week's high just above one standard deviation resistance 7,764.74, cash 7,763 |
| 7,764.50 | Friday's session high, cash 7,761 |
| 7,753.75 | target 2, first pivot resistance with the 38.2 percent retracement 7,754.46 and the computed target 7,747.11, cash 7,750 |
| 7,735.71 | three-to-ten day crossover reference |
| 7,732.75 | target 1, the pivot point and centre of Friday's range, cash 7,729 |
| 7,729.88 | modeled volatility threshold, cash 7,720 |
| 7,724.95 | 20-day moving average, the first average to flip against price, cash 7,722 |
| 7,722.00 | September settle, just beneath the 20-day average |
| 7,711.75 | Friday's session low, defended into the afternoon, cash 7,708 |
| 7,706 to 7,698 | the support confluence and entry, the 9-day crossing 7,706.19, the 38.2 percent retracement from the four-week low 7,702.54 and the first pivot support 7,701.00 with a 92.28 conviction score, cash 7,703 to 7,698 |
| 7,680 | stop reference, second pivot support with one standard deviation support 7,679.26 and the 7,679 to 7,683 shelf, cash 7,677 |
| 7,653.88 | modeled gamma-flip level, cash 7,644 |
| 7,648.25 | third pivot support with three standard deviation support 7,647.97 and the 40-day crossing 7,645.06, cash 7,645 |
| 7,618.50 | one-month low and the week's low from September 2, cash 7,615 |
| 7,510 | put-side hedging boundary, cash 7,500 |
| Metric | Reading |
|---|---|
| Call gamma / put gamma | call gamma 7.11 billion against put gamma negative 2.01 billion, a net positive 5.10 billion, cash index |
| Index gamma and notional | gamma tilt reads 1.322 on the cash index and market-maker gamma notional a positive 1.123 billion dollars, the largest positive reading across the index and fund complex, against the large-cap fund at 0.984 tilt and positive 134.4 million, the small-cap fund at 0.496 and negative 1.105 billion, so positive positioning concentrates in the index itself |
| Positioning versus the flip | the 7,722.00 settle sits 68.12 points above the modeled gamma flip at ES 7,653.88, a positive arrangement in which hedging works against movement, selling strength and buying weakness |
| Real-time hedging flow | cumulative index hedging flow finished negative 9 billion dollars of delta on the day, dominated by put buying, with roughly 75 percent in same-day-expiry contracts, while Nasdaq flow ran positive 4 billion from same-day put selling and longer-dated call buying |
| Volatility threshold and gamma flip | cash 7,720 (ES 7,729.88) and cash 7,644 (ES 7,653.88), the two modeled thresholds around and beneath the market |
| Concentration strike, call ceiling, put base | cash 8,000 (ES 8,009.88), cash 7,800 (ES 7,809.88) overhead, cash 7,500 (ES 7,509.88) far below |
| A dampening episode | roughly 10,000 lots of same-day iron condors were opened near 10:00 AM ET at the 7,750 and 7,755 strikes on the upside and the 7,675 and 7,670 strikes on the downside, cumulative hedging flow fell to negative 8 billion and the index dropped about 50 basis points, before the call side was closed near 10:45 AM ET and the market based at 7,711.75 |
| Largest expiries | the largest expiry by gamma is December 18 and the largest by delta was Friday September 4 itself, the signature of daily near-dated turnover against structural exposure months out |
| Put-to-call | call volume 806,269 against put volume 1.03 million for a ratio near 1.28 puts to calls, with call open interest 9.915 million against put open interest 14.039 million for a 1.42 ratio |
| 25-delta risk reversal and surface | the 25-delta risk reversal at negative 0.033, a mild put skew, with implied-volatility rank 8.07 percent, an implied-volatility percentile of 6 percent, a garch rank of 11.79 percent and skew rank 61.26 percent, cheap absolute volatility against a relatively bid downside |
| Cohort | Weekly change |
|---|---|
| Asset managers and dealers | for the week ended September 1, asset manager accounts hold 1,156,793 long against 222,613 short, having reduced longs by 9,291 and added 9,757 to shorts, while dealer and intermediary accounts hold 201,959 long against 922,706 short, cutting 45,607 of short exposure, the largest single adjustment in the table; equity fund managers separately cut net length 19,361 contracts to 927,454 |
| Leveraged funds and non-commercials | leveraged funds hold 165,311 long against 482,875 short, adding 14,785 to longs and 17,145 to shorts, equity fund speculators increased their net short 4,587 contracts to 307,558 and commercials cut 26,508 of short exposure, a market rebuilding two-way risk, with open interest at 1,979,470 and 13 days to the September 17 options expiration ahead of the September 18 contract expiry |
| Input | |
|---|---|
| Fed policy | the August employment report at 8:30 AM ET printed payrolls of 162,000 against a 55,000 consensus with the prior month revised from a 23,000 decline to a 21,000 gain, private payrolls 127,000 against 50,000, the workweek lengthening to 34.4 hours from 34.3 and average hourly earnings accelerating to 0.3 percent monthly from 0.1 percent while easing to 3.1 percent yearly, unemployment holding at 4.1 percent, moving the implied chance of a September increase to between 58 and 60 percent from roughly 52 percent |
| Dollar and rates | short-dated Treasuries sold off alongside equities, the tell that Friday was a rates event rather than a growth scare, with the next inputs producer prices on September 10 and consumer prices on September 11 |
| Volatility | the volatility index closed at 14.52 up 1.5 percent with the volatility-of-volatility measure at 84.42, cash implied-volatility rank at 8.07 percent, one-month implied 12.10 percent against realized 7.57 percent, short-dated fixed-strike volatility ahead of the September 11 inflation print falling about two points and at-the-money implied volatility for Tuesday near 5.9 percent |
| Large-cap leadership | leadership inverted, the Nasdaq 100 up 0.21 percent at 29,544.16 while the broad index fell 0.38 percent and the Dow fell 0.51 percent, semiconductor and artificial-intelligence infrastructure names carrying the complex while the largest consumer-hardware name fell 2.51 percent and credit-scoring, credit-bureau and information-services names fell hard, a violent rotation inside technology rather than a technology rally |
| Breadth | breadth is best read through the sector spread rather than advance-decline internals, which are end-of-day values, semiconductors up roughly 4 percent against mega-cap technology down roughly 1 percent and software down roughly 2 percent, an index held up by one sub-sector and therefore carrying a single point of failure |
| Cross-asset | the 25-delta risk reversal on the cash index reads negative 0.033, a mild put skew, with skew rank at 61.26 percent, so the market pays a relatively higher premium for downside protection even as the absolute level of volatility sits near the bottom of its annual range, crude trading near 91.48 and little changed |
| Geopolitics | the President spoke between roughly 2:41 PM ET and 3:04 PM ET on Iran, the Strait of Hormuz, China and tariffs, market-relevant without being market-moving, and at 4:19 PM ET officials indicated no mid-September artificial-intelligence talks and no delegation of Chinese chief executives, a mild negative for the semiconductor leadership that landed after the close and has not been priced, with a state visit on the calendar for September 24 |
| Institutional positioning | dealers and commercials reduced short exposure, asset managers reduced net length and leveraged funds increased gross exposure on both sides, a market rebuilding two-way risk rather than committing to a direction, consistent with the flat weekly candle and a 13 reading on the directional index |
| When | Event |
|---|---|
| Tue Sep 8 | a data-light session whose single first-order event is the three-year note auction at 1:00 PM ET, with three-month and six-month bill auctions at 11:30 AM ET, consumer credit at 3:00 PM ET, German trade balance at 2:00 AM ET, a Bank of England committee appearance at 10:15 AM ET and Chinese consumer and producer prices at 9:30 PM ET |
| Wed Sep 9 | a consumer-hardware product event tentatively at 10:00 AM ET and a ten-year note auction at 1:00 PM ET, the prior having cleared at 4.683 percent on a 2.530 cover |
| Thu Sep 10 | the European Central Bank decision at 8:15 AM ET expected to lift the main rate to 2.65 percent from 2.40 percent, United States producer prices at 8:30 AM ET expected to jump to 5.2 percent annually from 4.7 percent, initial claims of 205,000, existing home sales at 10:00 AM ET and a thirty-year bond auction at 1:00 PM ET |
| Sep 11 to 18 | consumer prices at 8:30 AM ET Friday September 11 with the headline expected at 3.4 percent annually and 0.4 percent monthly and consumer sentiment at 10:00 AM ET, the policy statement and projections at 2:00 PM ET Wednesday September 16, and the September contract expiry alongside quarterly index expiration on September 18 |
The economic releases referenced above are published on the official government calendars below. Price levels are derived from standard technical and statistical methods, and the market read is AlgoIndex's own analysis. How we grade these calls is set out in our performance methodology.
- US Bureau of Economic Analysis, Personal Income and Outlays (PCE)
- US Bureau of Economic Analysis, Gross Domestic Product
- US Bureau of Economic Analysis, release schedule
- US Census Bureau, Advance Durable Goods (M3) release schedule
- US Energy Information Administration, Weekly Petroleum Status Report
- US Department of the Treasury, auction schedule and results
- AlgoIndex performance methodology



