
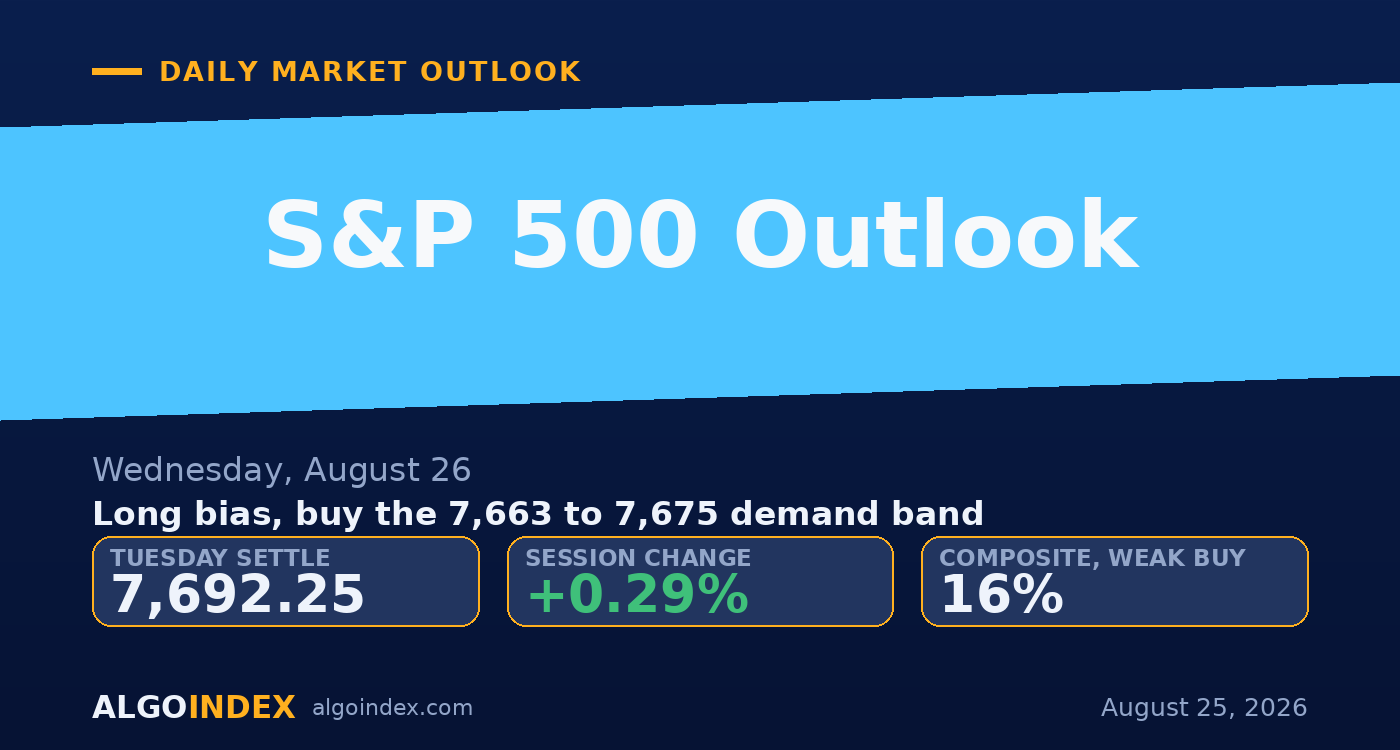
The September E-mini settled Tuesday's regular session at 7,692.25, up about 0.29 percent, and the S&P 500 cash index closed 0.32 percent higher at 7,677.28. That's a smaller move than it sounds. Cash held inside a 46 basis point band the entire day, one of the tightest full sessions of the month, and the contract finished within a quarter point of its own 20-day average at 7,692.51. Nothing here resolved the month-long pullback from the August 13 high; it just pushed the decision out one more day. The engine wasn't equities at all, it was energy. Crude fell more than 3 percent on reports of a Middle East de-escalation, that dragged inflation expectations lower, and the 10-year yield eased about 6 basis points to 4.64 percent. Cheaper rates lifted the chips, with the semiconductor group up about 2 percent and memory names about 4 percent, and mega-cap technology carried the index while the Dow contract sat flat.
Here's the discomfort heading into Wednesday. Index-level dealer positioning is marginally net long gamma, with call gamma of about 6 billion against put gamma of about negative 1.5 billion and a gamma tilt of 1.013, and a book like that mechanically damps movement by leaning against price both ways. That's the plain reason a day carrying two live geopolitical threads still printed a 46 basis point cash range. The catch is the calendar. Wednesday stacks the personal-consumption price data and the second-estimate GDP at 8:30 AM ET, then the quarter's most-watched chip earnings after the close. And the options market isn't paying for any of it: the implied one-day move is just 0.71 percent, below the contract's own average daily range. Traders leaned constructive for Tuesday and flatly declined to price the event sitting right in front of them.
Pinned to the mean, thin room on top
The constructive read starts with location and momentum. Cash closed above the 7,650 directional pivot, the bullish-above line last refreshed August 20, and the 1-hour chart stamped a higher high near 7,714 during the session, a genuine short-term improvement inside an unresolved 4-hour downtrend. The short-dated stochastics back it up. The 9-day percent-K sits at 15.58 and the 14-day raw reads 20.16, both washed out, while the 20-day holds up near 71. Depressed fast momentum against a firmer slower read is the split that's favored an upside resolution more often than not, though it isn't a signal on its own.
The problem is how little space sits overhead. The settle is glued to the 20-day at 7,692.51, a quarter point away, and the 5-day at 7,688.90 is three points under it, so price, the 5-day and the 20-day are packed into a 3.61 point window. That's a compression setup in everything but name, and it tends to release hard once a catalyst lands. The trend statistics have gone slack too. The 14-day directional index at 16.84 sits under the 20 line, the multi-indicator composite reads just 16 percent buy and weakening, and the short-term studies have turned 40 percent sell even while the long-term stack stays intact.
The 7,714 band is the whole question
Two bands frame Wednesday. Overhead, the 7,714 session high stacks with the 7,717.25 first pivot resistance into a single decision band of about 7,714 to 7,718, and acceptance above it is the cleanest constructive trigger on the board, with the 7,737 to 7,743 grouping the next magnet up. Below, the support is dense: the 7,675.50 volatility inflection level, an 89.20-score concentration strike at 7,668.50, the 7,665.50 directional pivot and the 7,663.50 first support pivot all pack into a 12 point window, the tightest demand band available. Implied volatility is cheap at 12.61 percent on the 23-day against 7.17 percent realized, and the 25-delta risk reversal at negative 0.042 shows only a mild lean toward downside protection. This isn't a frightened market walking into its heaviest day.
Buy the shelf, respect the wall, size it down
The plan buys the 7,663 to 7,675 support band on a pullback that holds and turns, not on the first touch, leaning on the damping book and the washed-out short-term readings rather than betting on a fresh trend. The stop is 7,651, tucked beneath Monday's 7,655.00 low and the whole demand band, about 18 points from the 7,669 entry midpoint. Targets run to 7,692.25, where the settle, the 20-day and the pivot point all sit inside four points, then the 7,714 session high, then the 7,742.50 second pivot resistance only if momentum carries through on expanding volume. Two things void it in real time. A core personal-consumption print of 0.3 percent or higher at 8:30 AM ET revives the stalled-disinflation worry, and the repriced front-end yields would overwhelm the positioning structure; a confirmed reversal of the Middle East de-escalation does the same through the crude and inflation-expectations channel. Size stays trimmed, and exposure carried into the 4:20 PM ET release is earnings-event exposure rather than the technical setup described here, with negative single-stock dealer gamma and a 5 percent implied move. Our published record lays out how we grade these calls.
The ES contract settled right on its 20-day inside a long-gamma book that quiets the downside, but the 7,714 to 7,718 band is a wall the market couldn't clear, and Wednesday's inflation print and chip earnings are the events it's really waiting on. Constructive underneath, capped on top, glued to the mean.
A washed-out fast stochastic pinned to the 20-day mean is a dip worth buying at reduced size. The edge is the 7,663 to 7,675 shelf, and the failure is a sustained loss of 7,653.50.
This is the read our members get every session, before the bell, with the levels drawn and the setup defined. See how the same dealer-positioning work turns into systematic signals.
View pricingThe complete data picture
Every number behind Wednesday’s plan, charted first; the full numeric reference follows underneath.
Full numeric reference, every remaining figure from the review
| Average | Value | Settle vs |
|---|---|---|
| 5-day | 7,688.90 | above by 3.35 |
| 20-day | 7,692.51 | below by 0.26 |
| 50-day | 7,591.62 | above by 100.63 |
| 100-day | 7,461.28 | above by 230.97 |
| 200-day | 7,203.61 | above by 488.64 |
| Level | Reference |
|---|---|
| 8,015.55 | primary gamma concentration strike, cash 8,000 |
| 7,915.55 | primary call-side ceiling, cash 7,900 |
| 7,838.50 | 52-week and 13-week high, cash 7,823, set Aug 13 |
| 7,771.00 | third pivot resistance, cash 7,755 |
| 7,750.25 | upper edge of the implied one-day move, cash 7,735 |
| 7,742.50 | second pivot resistance, cash 7,727, the realistic upside objective |
| 7,737.50 | dealer strike 92.56, cash 7,722, first upside magnet |
| 7,717.25 | first pivot resistance, cash 7,702 |
| 7,714.00 | session and week high, cash 7,698, first ceiling |
| 7,692.51 | 20-day average, cash 7,677, the pin |
| 7,692.25 | September settle |
| 7,688.75 | pivot point, cash 7,673, coincident with the 5-day |
| 7,675.50 | volatility inflection level, cash 7,660 |
| 7,668.50 | concentration strike 89.20, cash 7,653 |
| 7,665.50 | major dealer-positioning pivot, cash 7,650, refreshed Aug 20 |
| 7,663 to 7,675 | primary demand band, the entry |
| 7,660.25 | session low, cash 7,645 |
| 7,653.50 | concentration strike 94.47, cash 7,638, first downside magnet |
| 7,641.25 | lower edge of the implied one-day move, cash 7,626 |
| 7,635.00 | second pivot support, cash 7,619 |
| 7,623.55 | dealer gamma flip level, cash 7,608 |
| 7,515.55 | primary put-side support base, cash 7,500 |
| Metric | Reading |
|---|---|
| Call gamma | about 6 billion, cash index |
| Put gamma | about negative 1.5 billion |
| Index gamma tilt | 1.013 with notional plus 26.852 million, the mechanical cause of the 46 basis point cash range |
| Tracking-fund gamma | S&P fund tilt 0.648 at minus 1.147 billion, Nasdaq-100 fund minus 402.919 million, damping not shared by the funds |
| Real-time hedging flow | closed minus 1.6 billion after reaching minus 7 billion intraday, zero-day call and put selling on both sides |
| Single-stock flow | plus 1.4 billion positive delta from longer-dated call buying |
| Put-to-call | volume 1.376, open interest 1.423 |
| 25-delta risk reversal | negative 0.042, only mildly put-skewed |
| Directional pivot | cash 7,650, futures 7,665.55, bullish above, last set Aug 20 |
| Cohort | Weekly change |
|---|---|
| Commercials | net short 113,553; 1,482,869 long vs 1,596,422 short, cut the net short by 28,887 (data Aug 18) |
| Non-commercials | net short 10,560; flipped from a net long of 11,280 as longs fell 16,392 and shorts rose 5,448 |
| Input | |
|---|---|
| Long-end Treasury yields | 10-year near 4.64 percent, down about 6 basis points, driven by the crude decline |
| Dollar index | 98.902, down 0.08 percent, stuck in its August range |
| Volatility index | 15.46, down 2.40 percent, vol-of-vol 85.67 down 3 percent |
| Crude oil | settled 82.36, down 3.12 percent, electronic read near 80.97 on de-escalation reports |
| Gold | settled 4,694.5, quoted 4,726.8 up 0.69 percent electronically, the day's one risk-off tell |
| Semiconductors | up about 2 percent, memory names up about 4 percent, leading a narrow advance |
| Two-year auction | stopped 4.204 percent against 4.315 prior on a 2.600 cover, mildly constructive |
| Sector leadership | Nasdaq-100 up 0.64 percent versus the S&P 0.32 percent, Dow contract flat, large-cap growth led |
| When | Event |
|---|---|
| Wed Aug 26 | core PCE month-over-month 0.2 percent and second-estimate GDP 1.5 percent 8:30 AM ET, crude inventories 10:30 AM ET, five-year auction 1:00 PM ET, marquee chip earnings 4:20 PM ET |
| Thu Aug 27 | weekly jobless claims and the seven-year auction, the central-bank symposium opens, a second chip name reports with a 9 percent implied move |
| Fri Aug 28 | the Federal Reserve chair keynote at 10:00 AM ET, the symposium continues |
| Wed Sep 2 | a third large chip name reports |
| Sep 24 | US-China leadership summit, expected to reaffirm the managed-competition framework |
The economic releases referenced above are published on the official government calendars below. Price levels are derived from standard technical and statistical methods, and the market read is AlgoIndex's own analysis. How we grade these calls is set out in our performance methodology.
- US Bureau of Economic Analysis, Personal Income and Outlays (PCE)
- US Bureau of Economic Analysis, Gross Domestic Product
- US Bureau of Economic Analysis, release schedule
- US Census Bureau, Advance Durable Goods (M3) release schedule
- US Energy Information Administration, Weekly Petroleum Status Report
- US Department of the Treasury, auction schedule and results
- AlgoIndex performance methodology



