
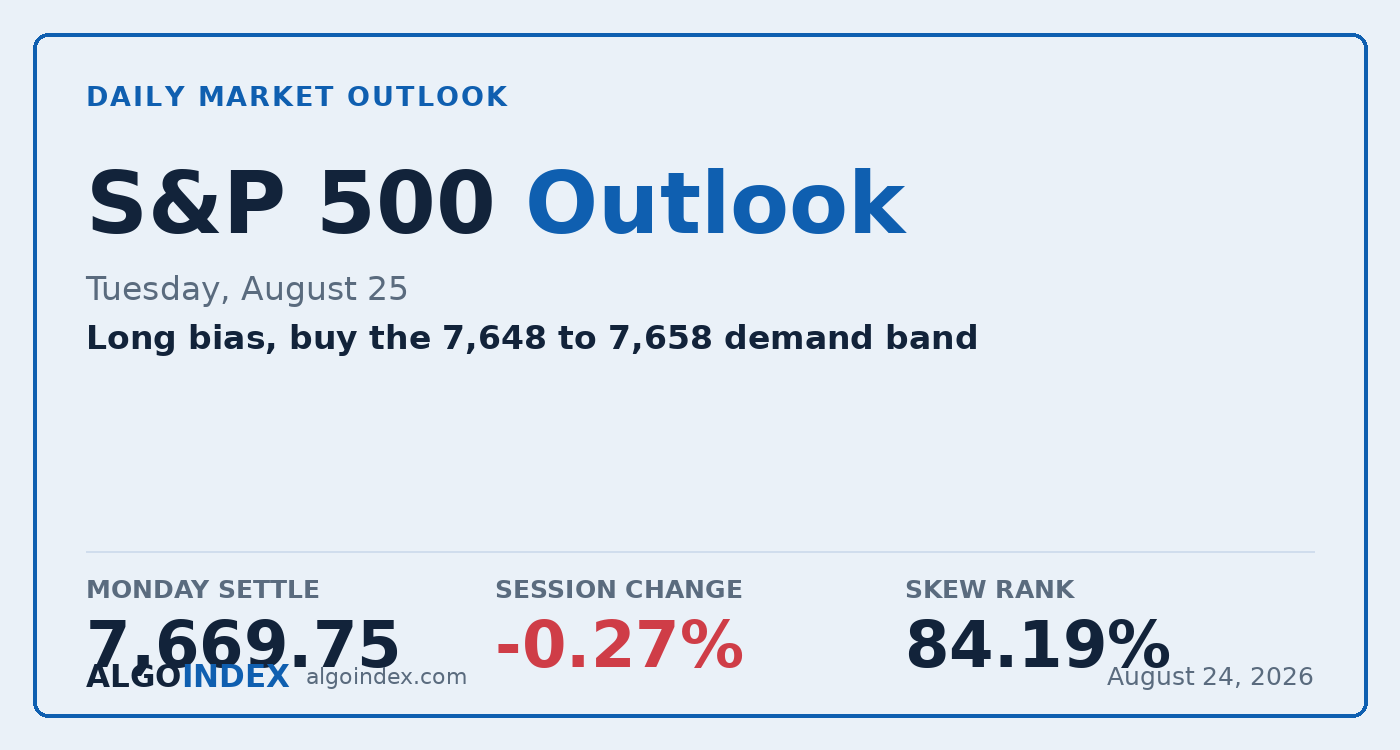
The September E-mini settled Monday's regular session at 7,669.75, down about 0.27 percent, and the S&P 500 cash index closed near 7,653. The number is quieter than it looks. Cash covered a range of just 41 basis points, about 31 index points, and the contract dipped to 7,655.00 before grinding back into the bell. This was the first session after August monthly expiration, and it read like a market that's lost its upside push without picking up any downside conviction. The damage wasn't broad, either. Memory names dropped about 6 percent and the semiconductor group about 3 percent, but financials added about 1 percent and staples about 2 percent, so capital rotated rather than fled.
Here's the tension heading into Tuesday. Dealer positioning on the index is net long gamma, with call gamma of 5.95 billion against put gamma of negative 1.46 billion, and that kind of book mechanically damps movement by leaning against price both ways. It's exactly why two live geopolitical escalations still produced a 41-basis-point cash day. Cumulative index options flow ran about 12 billion dollars of positive delta, but almost all of it sat in same-day contracts that expire overnight and have to be rebuilt each morning. Traders leaned long for Monday and flatly declined to carry that lean into Wednesday, where the personal-consumption price index and the year's most-watched chip earnings both land.
Constructive close, thin cushion
The bull case is location. Cash finished at 7,653, three points above its own 7,650 pivot and 24 points above the dealer gamma flip level at 7,629, and in that zone hedging activity quiets swings instead of feeding them. That's the plain reason Monday stayed so narrow. The short-dated stochastics tell the same story from another angle: the 9-day and 14-day both print 8.04 percent, pinned at the bottom, while the 20-day near 67 keeps the wider structure intact. Washed-out fast momentum against a steady slower read is the split that argues for a bounce attempt rather than another leg down.
The catch is how little room there is. The settle sits only 1.20 points above the major dealer-positioning pivot at 7,668.55, so the constructive read rests on a very thin shelf. Above it, the 5-day average at 7,693.30 and the first pivot resistance at 7,697.00 stack into a compact reclaim band the contract has to clear to restore any short-term structure. And the trend statistics have gone flat: the 14-day directional index at 17.65 sits under the 20 line, the multi-indicator composite reads just 16 percent constructive and weakening, and price closed beneath both its 5-day and 20-day averages for the first time in weeks.
The 7,700 strike is still the ceiling
Two bands frame Tuesday. Overhead, the 7,676.00 pivot is the first real test off the open, and above it the 7,693 to 7,697 reclaim band pairs the 5-day average with the first pivot resistance. The 20,000-lot dealer short call position at cash 7,700, which lines up with the volatility inflection level at 7,718.55, is the wall that capped Monday and hasn't moved. Below, four support references crowd a 21-point band from the 7,668.55 pivot down to the 7,647.55 gamma flip. Implied-vol rank at 10.31 says movement is cheap and one-month implied is running under realized, but skew rank at 84.19 is high, so this is a complacent market that's still paid up specifically for downside protection.
Buy the shelf, respect the wall
The plan buys the 7,648 to 7,658 support confluence and leans on the dampening book rather than betting on a trend, because Tuesday is data-light and wedged between a finished expiration and a Wednesday that carries real weight. The stop is 7,634, tucked beneath the gamma flip at 7,647.55, the one-standard-deviation support at 7,641.42 and the two-standard-deviation support at 7,629.69, about 19 points from the 7,653 midpoint. Targets run to the 7,676 pivot, then the 7,697 first pivot resistance where the 5-day average sits, then 7,718 only if momentum carries through on expanding volume. Two things can void it in real time: any confirmed interference with Strait of Hormuz transit, which would reprice volatility at once, or a markedly weak two-year auction at 1:00 in the afternoon that lifts front-end yields and undercuts the rate-relief support. Our published record shows how we grade these calls.
Cash closed above its own pivot and well above the gamma flip in a long-gamma book that quiets downside, but a 20,000-lot dealer short call sits right at 7,700. Constructive underneath, capped on top, and holding by barely a point.
A washed-out fast stochastic into a long-gamma close is a dip worth buying at reduced size. The edge is the 7,648 to 7,658 shelf, and the failure is 7,634.
This is the read our members get every session, before the bell, with the levels drawn and the setup defined. See how the same dealer-positioning work turns into systematic signals.
View pricingThe complete data picture
Every number behind Tuesday’s plan, charted first; the full numeric reference follows underneath.
Full numeric reference, every remaining figure from the review
| Average | Value | Settle vs |
|---|---|---|
| 5-day | 7,693.30 | below by 23.55 |
| 20-day | 7,681.17 | below by 11.42 |
| 50-day | 7,587.73 | above by 82.02 |
| 100-day | 7,451.08 | above by 218.67 |
| 200-day | 7,199.70 | above by 470.05 |
| Level | Reference |
|---|---|
| 8,018.55 | primary gamma concentration strike, cash 8,000 |
| 7,918.55 | primary call-side ceiling, cash 7,900 |
| 7,838.50 | 52-week high, cash 7,820, set Aug 13 |
| 7,770.50 | five-session high, cash 7,752 |
| 7,745.25 | third pivot resistance, cash 7,727 |
| 7,724.25 | second pivot resistance, cash 7,706 |
| 7,718.55 | volatility inflection level, cash 7,700, the 20,000-lot short call |
| 7,697.00 | first pivot resistance, cash 7,678 |
| 7,693.30 | five-day average, cash 7,675 |
| 7,676.00 | pivot point, cash 7,657 |
| 7,669.75 | September settle |
| 7,668.55 | major dealer-positioning pivot, cash 7,650, refreshed Aug 20 |
| 7,648 to 7,658 | primary demand band, the entry |
| 7,647.55 | dealer gamma flip level, cash 7,629 |
| 7,627.75 | second pivot support, cash 7,609 |
| 7,618.55 | secondary support base, cash 7,600, the 13,000-lot long call |
| 7,518.55 | primary put-side support base, cash 7,500 |
| Metric | Reading |
|---|---|
| Call gamma | 5.95 billion |
| Put gamma | negative 1.46 billion |
| Net gamma | positive 4.49 billion, index above the flip |
| Cumulative index options flow | about 12 billion positive delta, same-day put selling and call buying |
| Dealer short calls at cash 7,700 | about 20,000 lots, the mechanical ceiling |
| Dealer long calls at cash 7,600 | about 13,000 lots, Monday's downside cushion |
| Put-to-call | volume 1.42, open interest 1.33 |
| 25-delta risk reversal | negative 0.037 |
| Implied-vol rank and skew rank | 10.31 percent versus 84.19 percent |
| Input | |
|---|---|
| Long-end Treasury yields | eased on expanded Treasury buybacks for longer-dated issues, an equity-valuation tailwind |
| Volatility index | 15.84, essentially unchanged, vol-of-vol up about 3% to 88.64 |
| Skew rank | 84.19 percent, downside protection bid despite calm headline volatility |
| Crude oil | near 85.60, fell despite Hormuz escalation, energy discounting containment |
| Gold | 4,661.10, up about 0.21%, a mild defensive bid |
| AI chipmaker | down about 3%, seven straight lower closes into Wednesday's report |
| Sector rotation | memory down about 6%, semis about 3%, financials up about 1%, staples about 2% |
| When | Event |
|---|---|
| Tue Aug 25 | consumer confidence and new home sales 10:00, two-year auction 13:00, Fed president 08:00 and 16:00 |
| Wed Aug 26 | personal-consumption price index 08:30, durable goods, second-estimate GDP, dominant chipmaker report 16:20 with call 17:00 |
| Thu Aug 27 | weekly jobless claims 08:30, central-bank symposium opens |
| Fri Aug 28 | Federal Reserve governor speaks 10:00, preliminary benchmark payrolls revision, consensus 157,000 versus prior negative 911,000 |
| Wed Sep 16 | policy decision with updated projections |
The economic releases referenced above are published on the official government calendars below. Price levels are derived from standard technical and statistical methods, and the market read is AlgoIndex's own analysis. How we grade these calls is set out in our performance methodology.
- US Census Bureau, New Residential Construction (housing starts and building permits)
- US Bureau of Labor Statistics, Import and Export Price Indexes
- Federal Reserve, Industrial Production and Capacity Utilization (G.17)
- Federal Reserve, FOMC calendar and meeting minutes
- US Department of the Treasury, auction schedule and results
- AlgoIndex performance methodology



