
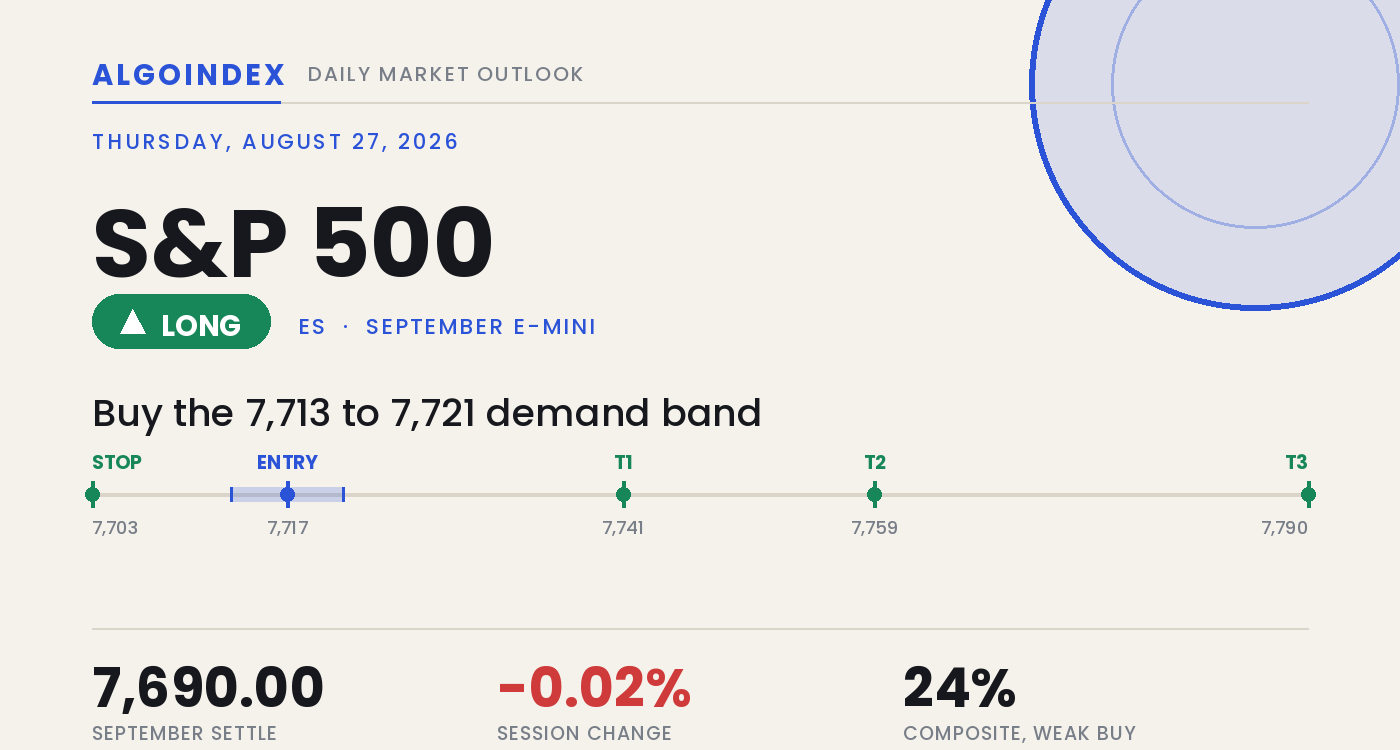
The September E-mini settled Wednesday's regular session at 7,690.00, and the S&P 500 cash index closed effectively flat at 7,675.70, a move of about minus 0.02 percent inside one of the month's narrowest bands. Then the session's real event landed. Nvidia reported after the cash close and beat on every headline line, revenue of 96.2 billion dollars against roughly 92.38 billion expected and data-center revenue of 89.0 billion, and futures gapped on the 6:00 PM ET reopen to 7,722.00 before extending to 7,741.25. Measured from the 7,690.00 settlement, that overnight high is a 51.25-point advance, and it has already consumed better than 90 percent of a normal day's range before the cash session has opened. The compression through Wednesday was the market declining to take a position ahead of the event. The gap is the market taking one now.
Here is the tension heading into Thursday, and it is not technical. Wednesday morning delivered inflation data that ran hot, with the headline personal-consumption price index at 3.7 percent year over year against 3.6 expected and the monthly figure at 0.2 against 0.1. Long-end yields rose, with the 30-year reported at its highest since 2007, and market pricing drifted toward a Federal Reserve that raises rates later this year rather than cuts. So the market is being asked to hold an equity repricing driven by one company's demand cycle on top of a rates backdrop moving against equity multiples. Those two forces are not aligned. Dealer positioning is net positive and dampening, with a market-maker gamma notional of plus 302 million dollars, which favors mean reversion toward the concentration strikes over a clean trend extension. The constructive path is the retest, not the chase.
The gap reclaimed every average overhead
The constructive read starts with location. The overnight advance to 7,741 has moved price above all six of its reference moving averages, including the 20-day at 7,709.45 that had been acting as the effective ceiling through the pullback from the August 13 high. A market trading above every average it tracks, with the longest-dated ones still rising, is not one to be structurally short. The short-dated momentum readings back a bounce too. The 9-day raw stochastic sits at 19.80 and the 14-day at 19.07, both washed out from several sessions of drift, while the 20-day holds near 71. Depressed fast momentum against a firmer slower read is the split that has favored an upside resolution more often than not.
The problem is confirmation, not direction. The entire move rests on a single catalyst, with no session of two-way trade behind it, and there is an unfilled gap between the 7,710.00 pre-pause close and the 7,722.00 reopen. Trend strength is genuinely weak, which is the key qualifier. The directional index reads 21.83 on the 9-day and 16.08 on the 14-day, and a reading beneath 20 describes a market without an established trend. The multi-indicator composite closed at 24 percent buy, weak and weakening, its short-horizon component averaging a sell even as the long-horizon stack stays firm. The trend is intact on the long lens and unproven on the short one.
The 7,710 gap-fill line is the whole question
Two levels frame Thursday. Below, the 7,710 shelf is the single most important level on the board, where the pre-pause futures close, the 20-day average and the first computed pivot resistance converge inside a point of each other, with the post-earnings high at 7,710.25 printed directly into it. Holding above it keeps the gap open and the constructive scenario alive; losing it fills the gap and puts the 7,690 pivot, coincident with the settlement, back in play. Above, the ceiling is a combined band at 7,759 to 7,763, where the heaviest overhead positioning on the near-term map sits at a conviction score of 96.86. That band should be treated as one obstacle, and it is where a chase of the current print pays the worst against a defined retest lower. Volatility is cheap, with one-month implied at 12.29 percent beneath one-month realized of 13.25 percent, while skew stays expensive, the market relaxed about movement in general and specifically insured against downside.
Buy the retest, respect the ceiling, size it down
The plan buys the 7,713 to 7,721 shelf on a controlled retest that holds and turns, not the 7,741 print into a heavy overhead band. That shelf combines prior resistance flipped to support, a near-term positioning confluence and the overnight session low, so it is a defended level rather than an arbitrary line. The stop is 7,703, tucked beneath the 7,710 confluence and the settle-window high at 7,705.50; a sustained break there fills the gap and invalidates the reclaim, about 14 points from the 7,717 entry midpoint. Targets run to the 7,741 overnight high, then the 7,759 concentration strike where genuine supply should appear, then 7,790 only if the 7,759 to 7,763 band clears on expanding volume with confirming breadth. Two things override the technical structure in real time. A weak seven-year auction at 1:00 PM ET that pushes long-end yields higher revives the rates pressure the whole advance is fighting, and any symposium remark that hardens the case for a rate increase does the same regardless of level. Size stays trimmed for the opening day of the symposium, and the setup stands down across the 12:55 PM to 1:05 PM ET auction reaction window. Our published record lays out how we grade these calls.
The gap reclaimed every average overhead on a single earnings catalyst, but it has not been retested, and the 7,710 line where the pre-pause close, the 20-day and the pivot converge is where the breakout either proves itself or fills. Constructive above it, unproven beneath it, and the rates side wins whenever it speaks loudly.
A gap that reclaims every average on one catalyst is a retest to buy, not a print to chase. The edge is the 7,713 to 7,721 shelf, and the failure is a sustained loss of 7,703 that cannot reclaim 7,710.
This is the read our members get every session, before the bell, with the levels drawn and the setup defined. See how the same dealer-positioning work turns into systematic signals.
View pricingThe complete data picture
Every number behind Thursday’s plan, charted first; the full numeric reference follows underneath.
Full numeric reference, every remaining figure from the review
| Average | Value | Settle vs |
|---|---|---|
| 5-day | 7,681.10 | above by 8.90 |
| 20-day | 7,709.45 | below by 19.45, the reclaimed ceiling |
| 50-day | 7,592.89 | above by 97.11 |
| 100-day | 7,471.46 | above by 218.54 |
| 200-day | 7,207.49 | above by 482.51 |
| Level | Reference |
|---|---|
| 8,013 | primary gamma concentration strike, cash 8,000 |
| 7,913 | primary call-side ceiling, cash 7,900 |
| 7,838.50 | 52-week and contract high, cash 7,824, set Aug 13 |
| 7,813 | fourth resistance shelf, cash 7,800, conviction 98.81 |
| 7,763 | third resistance shelf, cash 7,750 |
| 7,759 | primary overhead concentration, cash 7,746, conviction 96.86, target 2 |
| 7,749.42 | third pivot resistance, cash 7,736 |
| 7,741.25 | overnight high, cash 7,728, target 1 |
| 7,736 | first support strike, cash 7,723, conviction 95.83 |
| 7,729.83 | second pivot resistance now support, cash 7,717 |
| 7,721 | near-term support confluence, cash 7,708, overnight low, top of entry |
| 7,713 to 7,721 | primary demand shelf, the entry |
| 7,713 | flipped resistance shelf, cash 7,700, base of entry |
| 7,710 | the pivot: pre-pause close, 20-day average, first pivot resistance, cash 7,697, the gap-fill line |
| 7,690.33 | computed pivot point, cash 7,677 |
| 7,690.00 | September settle |
| 7,688 | volatility inflection level, cash 7,675 |
| 7,670.42 | first pivot support, session low near 7,670.75, cash 7,657 |
| 7,663 | directional pivot, cash 7,650, refreshed Aug 20 |
| 7,645 | dealer gamma flip level, cash 7,632 |
| 7,513 | primary put-side support base, cash 7,500 |
| Metric | Reading |
|---|---|
| Call gamma / put gamma | about 4.52 billion / negative 2.02 billion, cash index |
| Index gamma and notional | gamma index 0.861, tilt 1.061, market-maker notional plus 302.122 million, net positive and dampening |
| Tracking-fund gamma | the principal fund reads minus 0.394, damping not shared by the fund |
| Real-time hedging flow | about plus 6 billion net delta on the day, put selling and call buying, the majority in same-day expiries |
| Volatility inflection and gamma flip | cash 7,675 (ES 7,688) and cash 7,632 (ES 7,645), both well beneath spot |
| Concentration strike, call ceiling, put base | cash 8,000 (ES 8,013), cash 7,900 (ES 7,913), cash 7,500 (ES 7,513) |
| Put-to-call | volume 1.50, open interest 1.34 |
| 25-delta risk reversal | negative 0.039 on the cash index |
| Directional pivot | cash 7,650, ES 7,663, constructive above, last set Aug 20 |
| Options impact and heaviest expiries | impact 8.16 percent, heaviest gamma Dec 17 2026, heaviest delta Feb 18 2027 |
| Cohort | Weekly change |
|---|---|
| Leveraged funds | net short 281,402; 166,291 long vs 447,693 short, both sides cut (longs 39,453, shorts 38,497), a gross reduction rather than a directional shift (data Aug 18) |
| Asset managers | net long 960,566; 1,165,359 long vs 204,793 short, added 10,659 longs and trimmed 1,426 shorts, moving further long |
| Dealers and intermediaries | 219,986 long vs 1,004,401 short, the structural hedging book the intermediaries always carry |
| Input | |
|---|---|
| Long-end Treasury yields | the 30-year at its highest since 2007, the long end selling off, the dominant driver pointed against equities |
| PCE inflation | headline 3.7 percent year over year against 3.6 expected, monthly 0.2 against 0.1, preliminary quarterly core revised to 3.6 percent |
| Dollar index | traded higher on the hot inflation data |
| Nvidia | revenue 96.2 billion against 92.38 expected, data-center 89.0 against 85.86, adjusted EPS 2.22, gross margin 75 percent, stock near 218 up about 4 percent after hours |
| Salesforce | adjusted EPS 5.90 against 2.91 a year prior, revenue 11.35 billion, an artificial-intelligence partnership announced |
| Demand data | durable goods up 1.1 percent and personal income up 0.4, but core durables up 0.4 against 0.6 expected and real spending flat |
| Rate expectations | pricing shifted toward a Federal Reserve that raises rather than eases this year |
| Index dispersion | Dow minus 0.21, cash S&P minus 0.02, Nasdaq 100 plus 0.05, widening overnight to Nasdaq plus 1.10 against the S&P complex 0.65 |
| When | Event |
|---|---|
| Thu Aug 27 | jobless claims 208,000 8:30 AM ET, Federal Reserve remarks 10:00 AM ET, seven-year note auction 1:00 PM ET, the central-bank symposium opens Thursday through Saturday |
| Fri Aug 28 | preliminary benchmark payrolls revision 157,000 against a prior minus 911,000, final consumer sentiment and inflation expectations, further symposium remarks |
| Tue Sep 9 | Treasury buyback date, with large long-duration options positioning flagged in the fund complex |
| Tue Sep 16 | Federal Reserve policy decision with updated projections |
| Wed Sep 17 | September contract expiration, 22 days out at the time of the review |
The economic releases referenced above are published on the official government calendars below. Price levels are derived from standard technical and statistical methods, and the market read is AlgoIndex's own analysis. How we grade these calls is set out in our performance methodology.
- US Bureau of Economic Analysis, Personal Income and Outlays (PCE)
- US Bureau of Economic Analysis, Gross Domestic Product
- US Bureau of Economic Analysis, release schedule
- US Census Bureau, Advance Durable Goods (M3) release schedule
- US Energy Information Administration, Weekly Petroleum Status Report
- US Department of the Treasury, auction schedule and results
- AlgoIndex performance methodology



